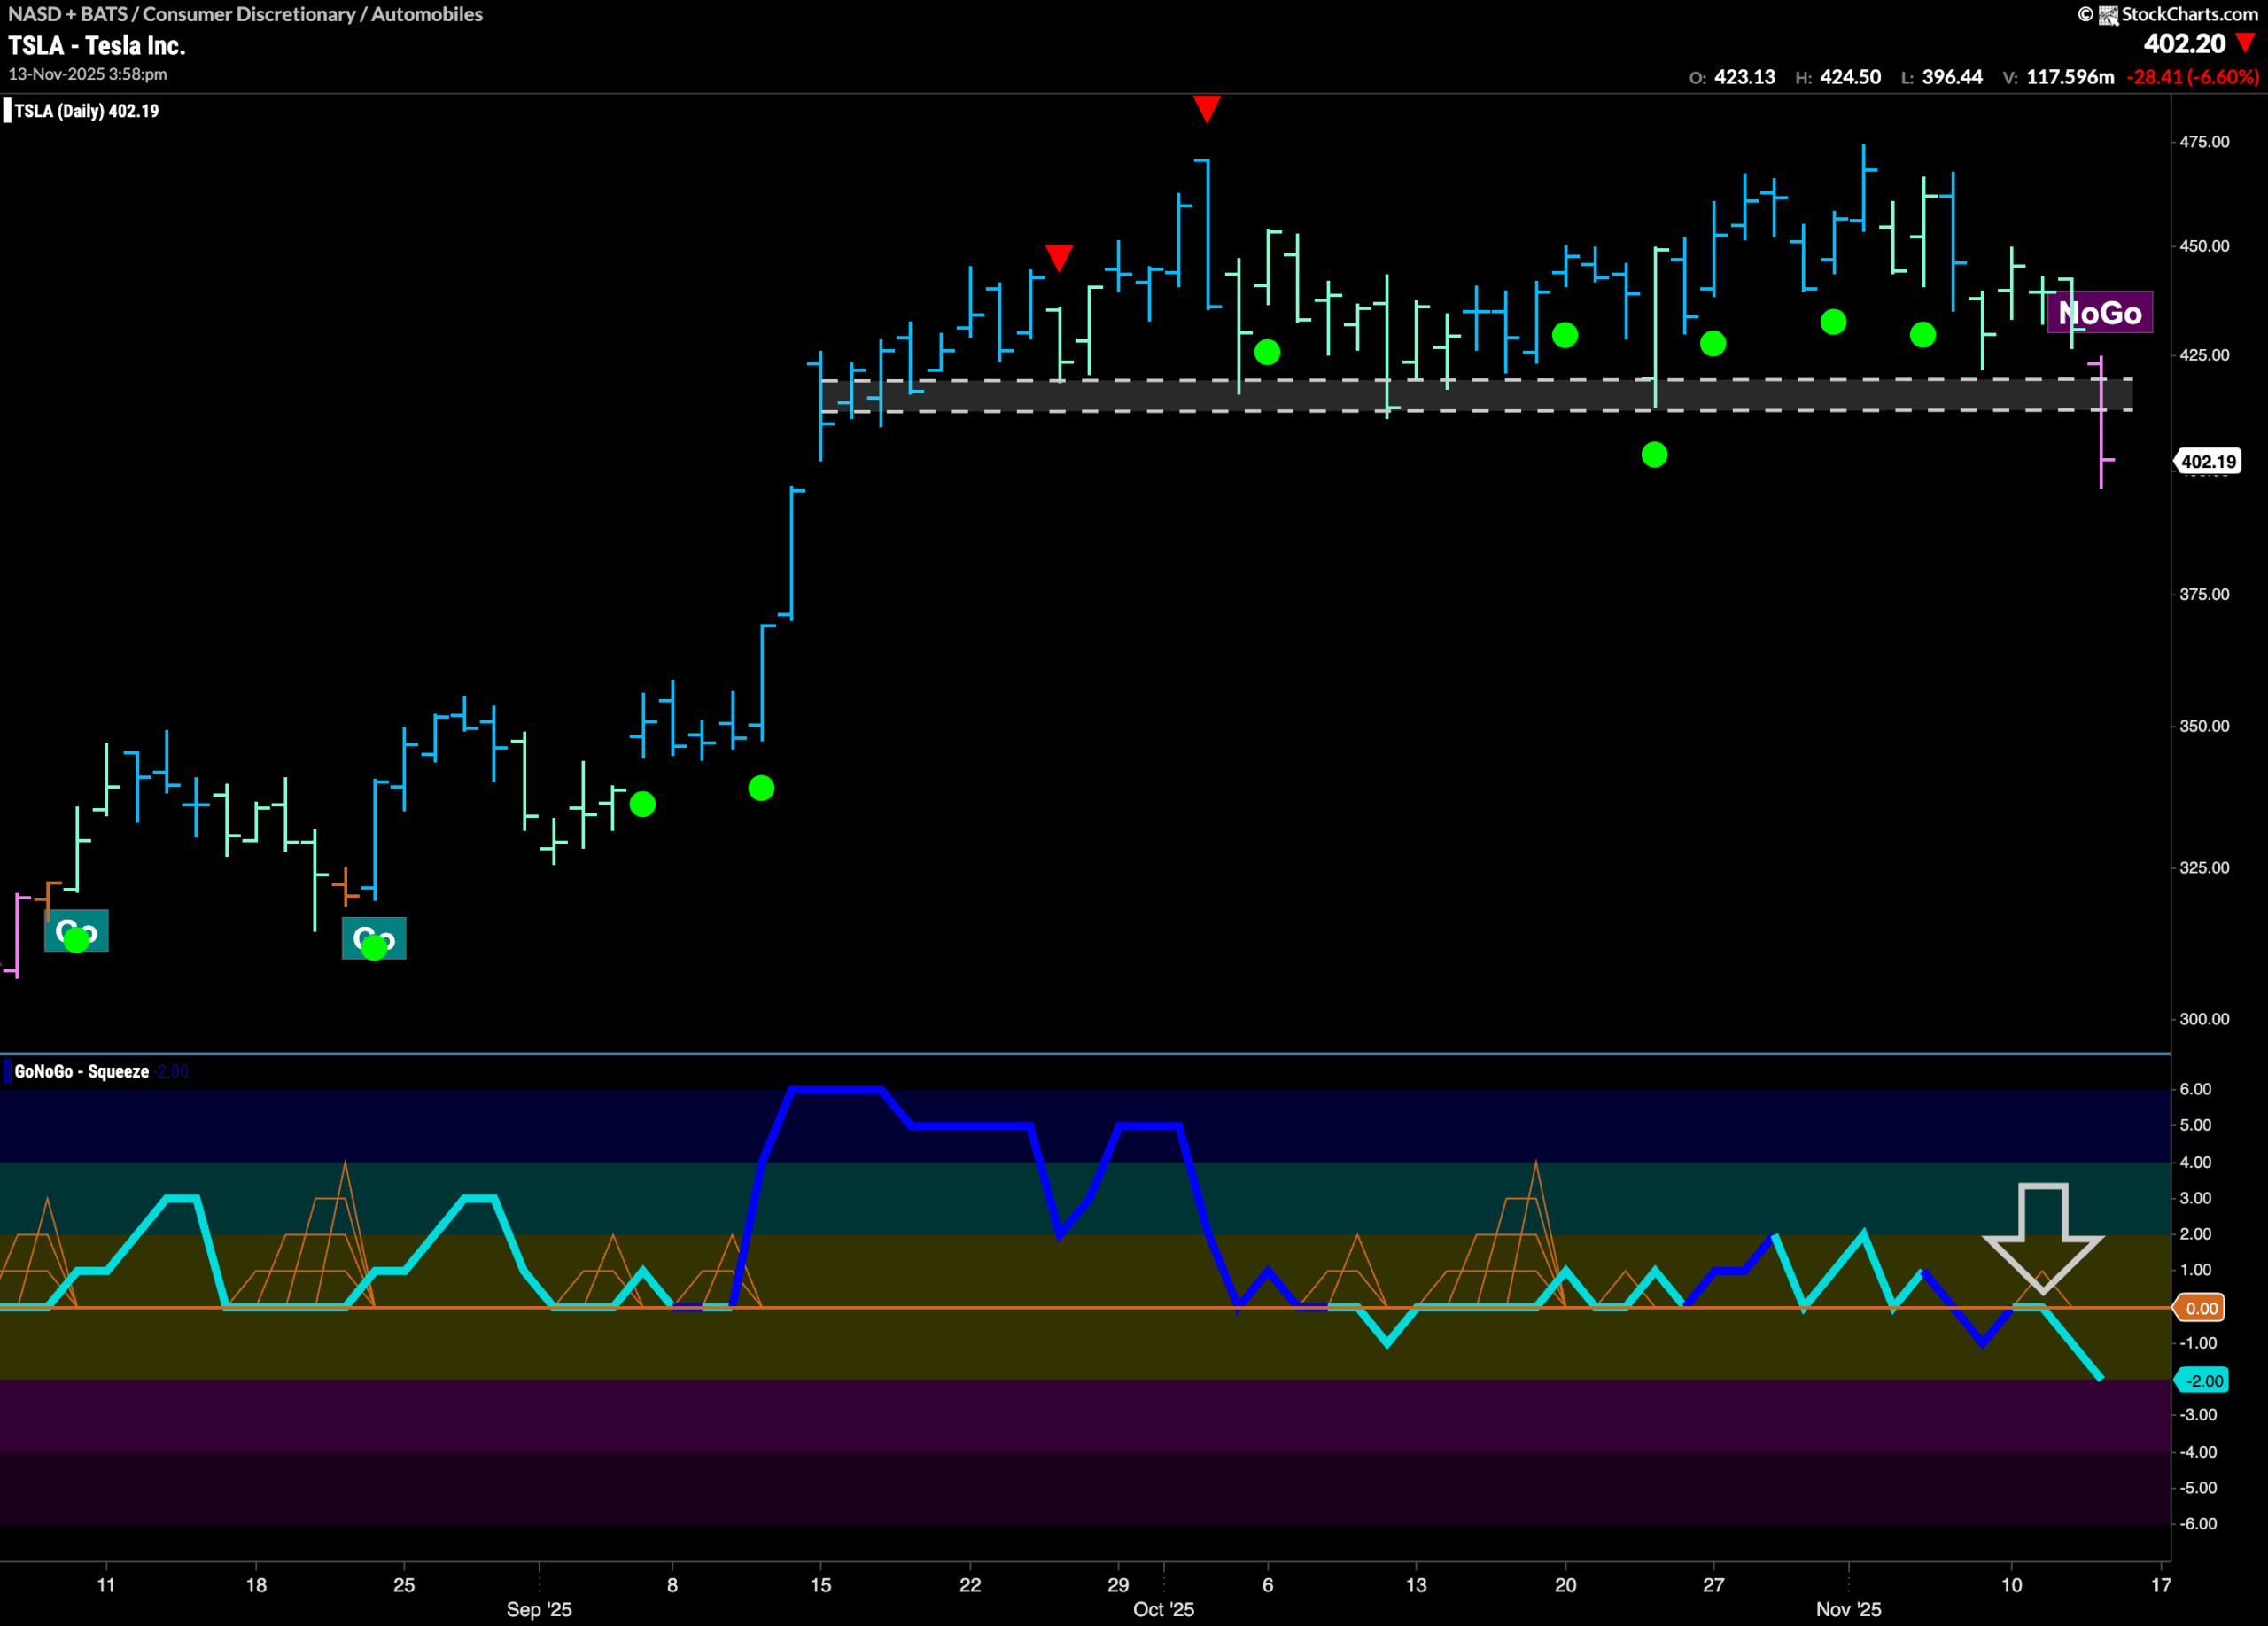

$TSLA had been in a “Go” trend since early August.
Since then we have seen a series of higher highs and higher lows as price climbed over $474. After the high in early October, we saw a Go Countertrend Correction Icon (red arrow) indicating that price may struggle to go higher in the short term. Indeed, since then, we have see price move sideways for several weeks with one failed attempt at a new high. During that time, GoNoGo Oscillator primarily found support at the zero line and price continued to find support at the horizontal level on the chart. Now, for the first time, price has broken down to a new low on a new “NoGo” bar. GoNoGo Oscillator has broken through into negative territory and quickly tested the zero line where it met resistance. With momentum surging in the direction of the new “NoGo” trend, we will watch to see if price falls further in the coming days.