Disciplined investing is simple, but not easy. Many traders and investors are overwhelmed by the often redundant, occasionally contradictory, and ever-complicated battery of indicators. GoNoGo Charts help investors understand the direction and continuity of price trends for any security, any asset class, across any time frame.
By blending objective principles of technical analysis and the most widely used statistical measures, GoNoGo Charts remove “indicator overload.” Investors remain focused on what matters most – price – while the colors of each bar or candle reflect the strength & direction of the trend.

ALEX COLE
CO FOUNDER

TYLER WOOD, CMT
CO FOUNDER
Financial markets can be complicated. Your charts don’t have to be.
GoNoGo Charts were developed over many years working with long/short equity fund managers, RIAs focused on tactical asset allocation, sell-side research analysts and traders as well as fundamental investors who seek a simplified technical screening tool. ChartIQ has now enabled the tools for broker dealers and trading platforms serving self-directed investors.
Below is a summary of why GoNoGo Charts are important to ChartIQ Clients and their end users:
Risk Managment

Avoid Analysis Paralysis

User Control

Diverse Applications

Commercial Partnerships

Product Details
GoNoGo Charts implementation on ChartIQ include four core indicators in a single chart as shown to the right.
The four component tools are listed in detail below:
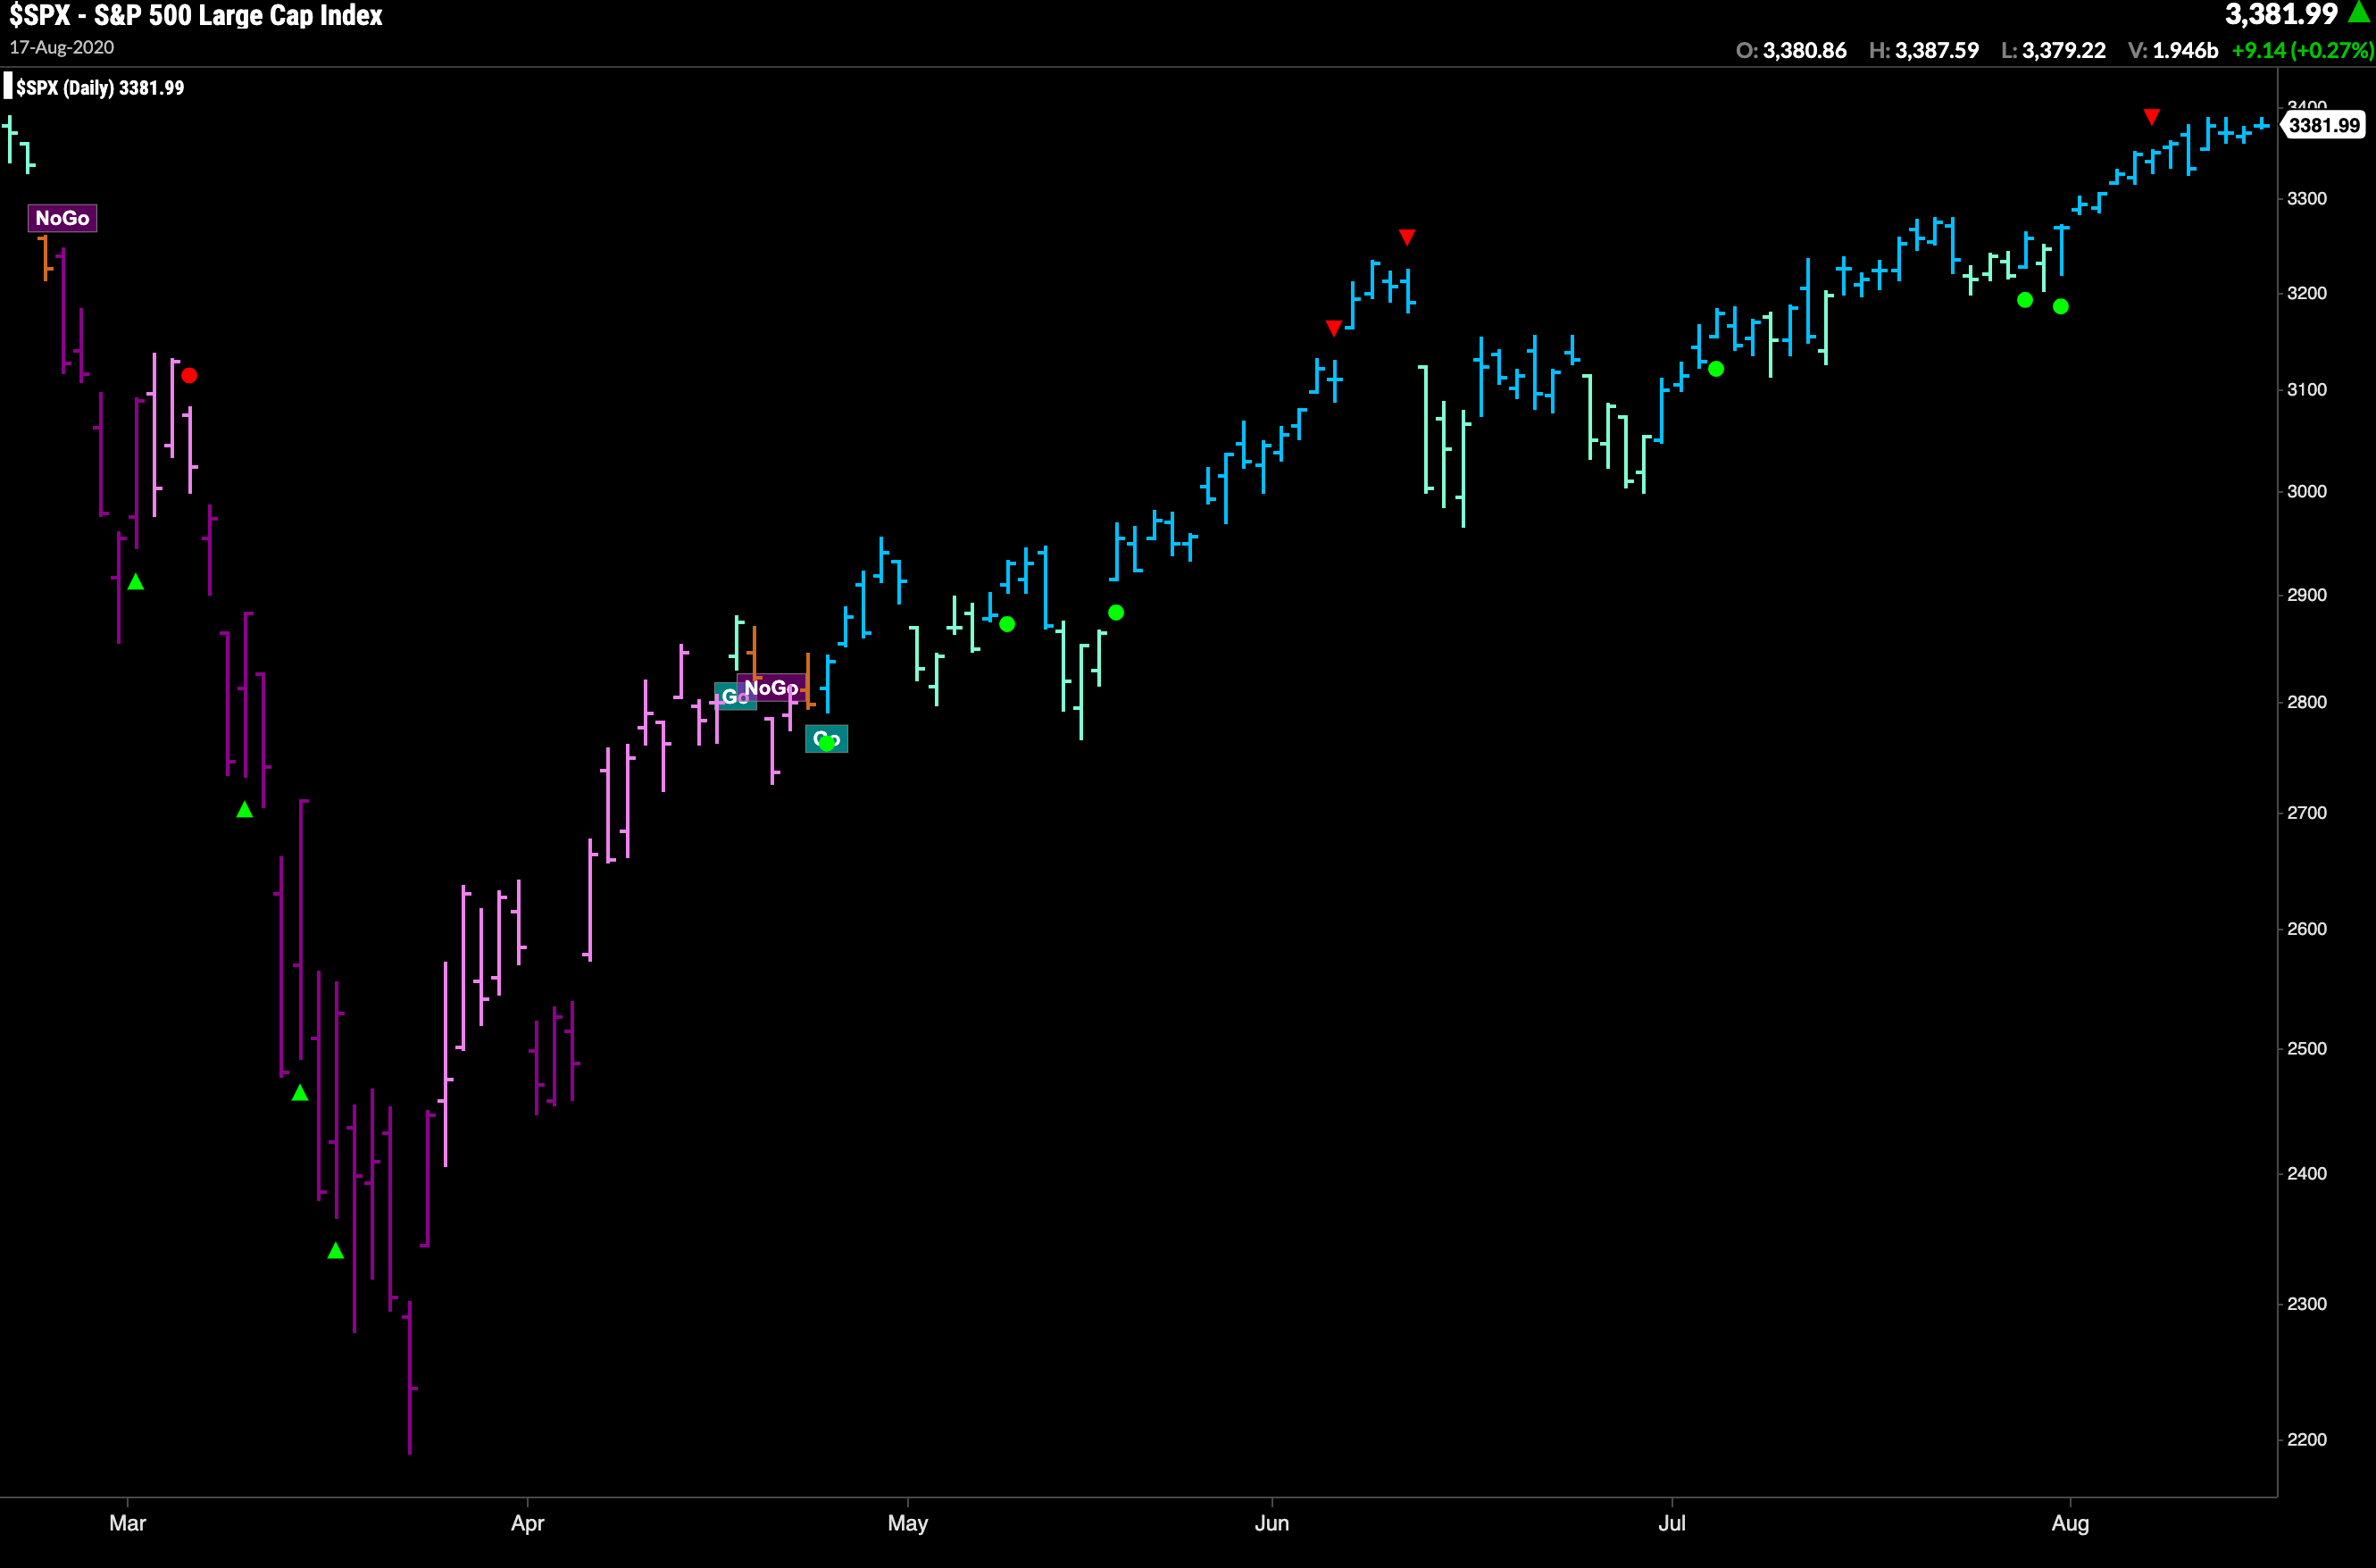
Trend identification is arguably the most important concept in technical analysis. By blending objective, widely proven statistical indicators together with the foundational principles of technical analysis, GoNoGo Trend® colors the price action of any security according to the strength of its trend. Free from the clutter of many technical charts, GoNoGo Trend is easy to interpret.
It paints the price bars bright blue when its unique mix of inputs signal the strongest bullish environment. When slightly less bullish, the color turns to aqua. This can happen at the start of a new trend, or after bright blue bars, indicating that the trend may be weakening.
The amber bars represent uncertainty, often appearing in the transition from bull trend to bear trend and vice versa. The lower intensity bearish color is pink, and the darker purple appears when the bearish trend intensifies.
Momentum goes hand in hand with trend identification. GoNoGo Oscillator® helps investors understand the velocity of price change, giving valuable information about the strength of a trend and the market’s conviction in it. Strong or increasing momentum provides confirmation of a trend while decelerating momentum gives the investor a leading indication of weakness and the potential for reversal.
OVERBOUGHT & OVERSOLD
GoNoGo Oscillator® blends several popular momentum ideas together to provide the user with meaningful momentum analysis. As an oscillator, the indicator’s values range above and below zero, from -6 to +6, with extreme positive values being considered overbought and extreme negative values, oversold. Within trend, a security’s momentum may reach overbought/oversold levels, then fall back toward the zero-line, and then rally again. A break above/below zero would indicate divergent momentum – unsustainable for a healthy trend.
VOLUME INCORPORATED
In addition, GoNoGo Oscillator’s color features a change from light blue to dark blue when volume is heavier than normal. Confirming or diverging volume readings give investors additional insight at pivotal decision points.
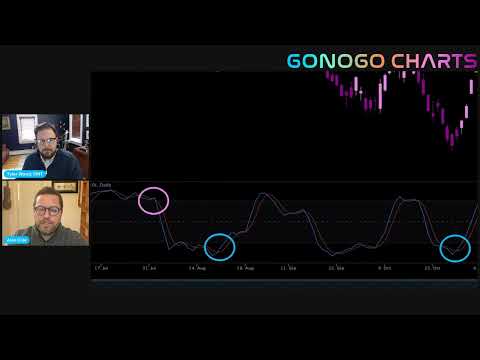
GoNoGo Charts highlight low-risk opportunities for trend participation and alert investors to short-term countertrend corrections with intuitive icons directly in the price action.
The resurgence of momentum in the direction of the trend is an excellent entry opportunity, or the chance to scale up positions. GoNoGo Icons illuminate these events on the chart with green or red solid circles. When GoNoGo Trend is painting blue bars, a green solid circle will appear above price each time GoNoGo Oscillator finds support at zero. When GoNoGo Trend is painting purple bars, a red solid circle will appear each time GoNoGo Oscillator hits resistance at the zero-line from below.
Contrarily, within a “Go” trend, a security’s momentum may reach overbought levels, then fall back toward the zero-line. While in a “NoGo” trend, a security’s momentum may fall to extreme oversold levels, and then cool. As the momentum calculations retreat from extreme overbought or oversold levels, GoNoGo Icons highlight the possible countertrend correction in price.
Studies have shown that momentum readings are not only useful for mean-reversion strategies but can also add insight within trend. GoNoGo Oscillator is calculated so that when inputs are in neutral territory, it rests at zero. Meaning, when enthusiasm wanes within a trending market, GoNoGo Oscillator® provides an objective point of support/resistance for momentum at the zero line.
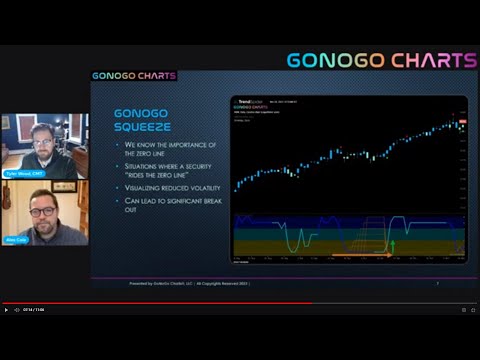
Where there is no excessive buying or selling, price action stagnates, volatility declines, markets move sideways, and GoNoGo Oscillator® rests at the zero line. This volatility compression is highlighted by GoNoGo Squeeze®. A visual grid in the oscillator panel climbs as momentum remains neutral reaching extremes with prolonged reduction in volatility. Like a coiled spring, researchers have shown that following these stalemates between buyers and sellers, a breakout can be expected.
![Trend [Re]Entry Part IV](https://img.youtube.com/vi/1REU0MMJmNM/hqdefault.jpg)