BETTER CHARTS. BETTER DECISIONS.
READY TO LAUNCH
The GoNoGo Charts Indicators were meticulously developed over years to equip the investor with simple to read measurements about whether the market environment is a “Go” for launch in terms of an idea, strategy or investment.
The “Go/No-Go” terminology is borrowed from a type of pass/fail testing system often used by NASA as a launch status check. In the early stages of developing these tools, that metaphor had striking similarities to the disciplined process of investing.
Uncertainty in the market is unavoidable, but for every trade decision where capital is at risk, making sure you have confirmation from multiple measurements that conditions are right gives you the highest probability of success.


RESEARCH
Launch Conditions
SIMPLIFY INVESTMENT DECISIONS

GONOGO TREND
Colors price action according to the strength of a trend
Blending robust statistical tools into a simple color-coded bar chart of an assets price according to the strength of its trend.
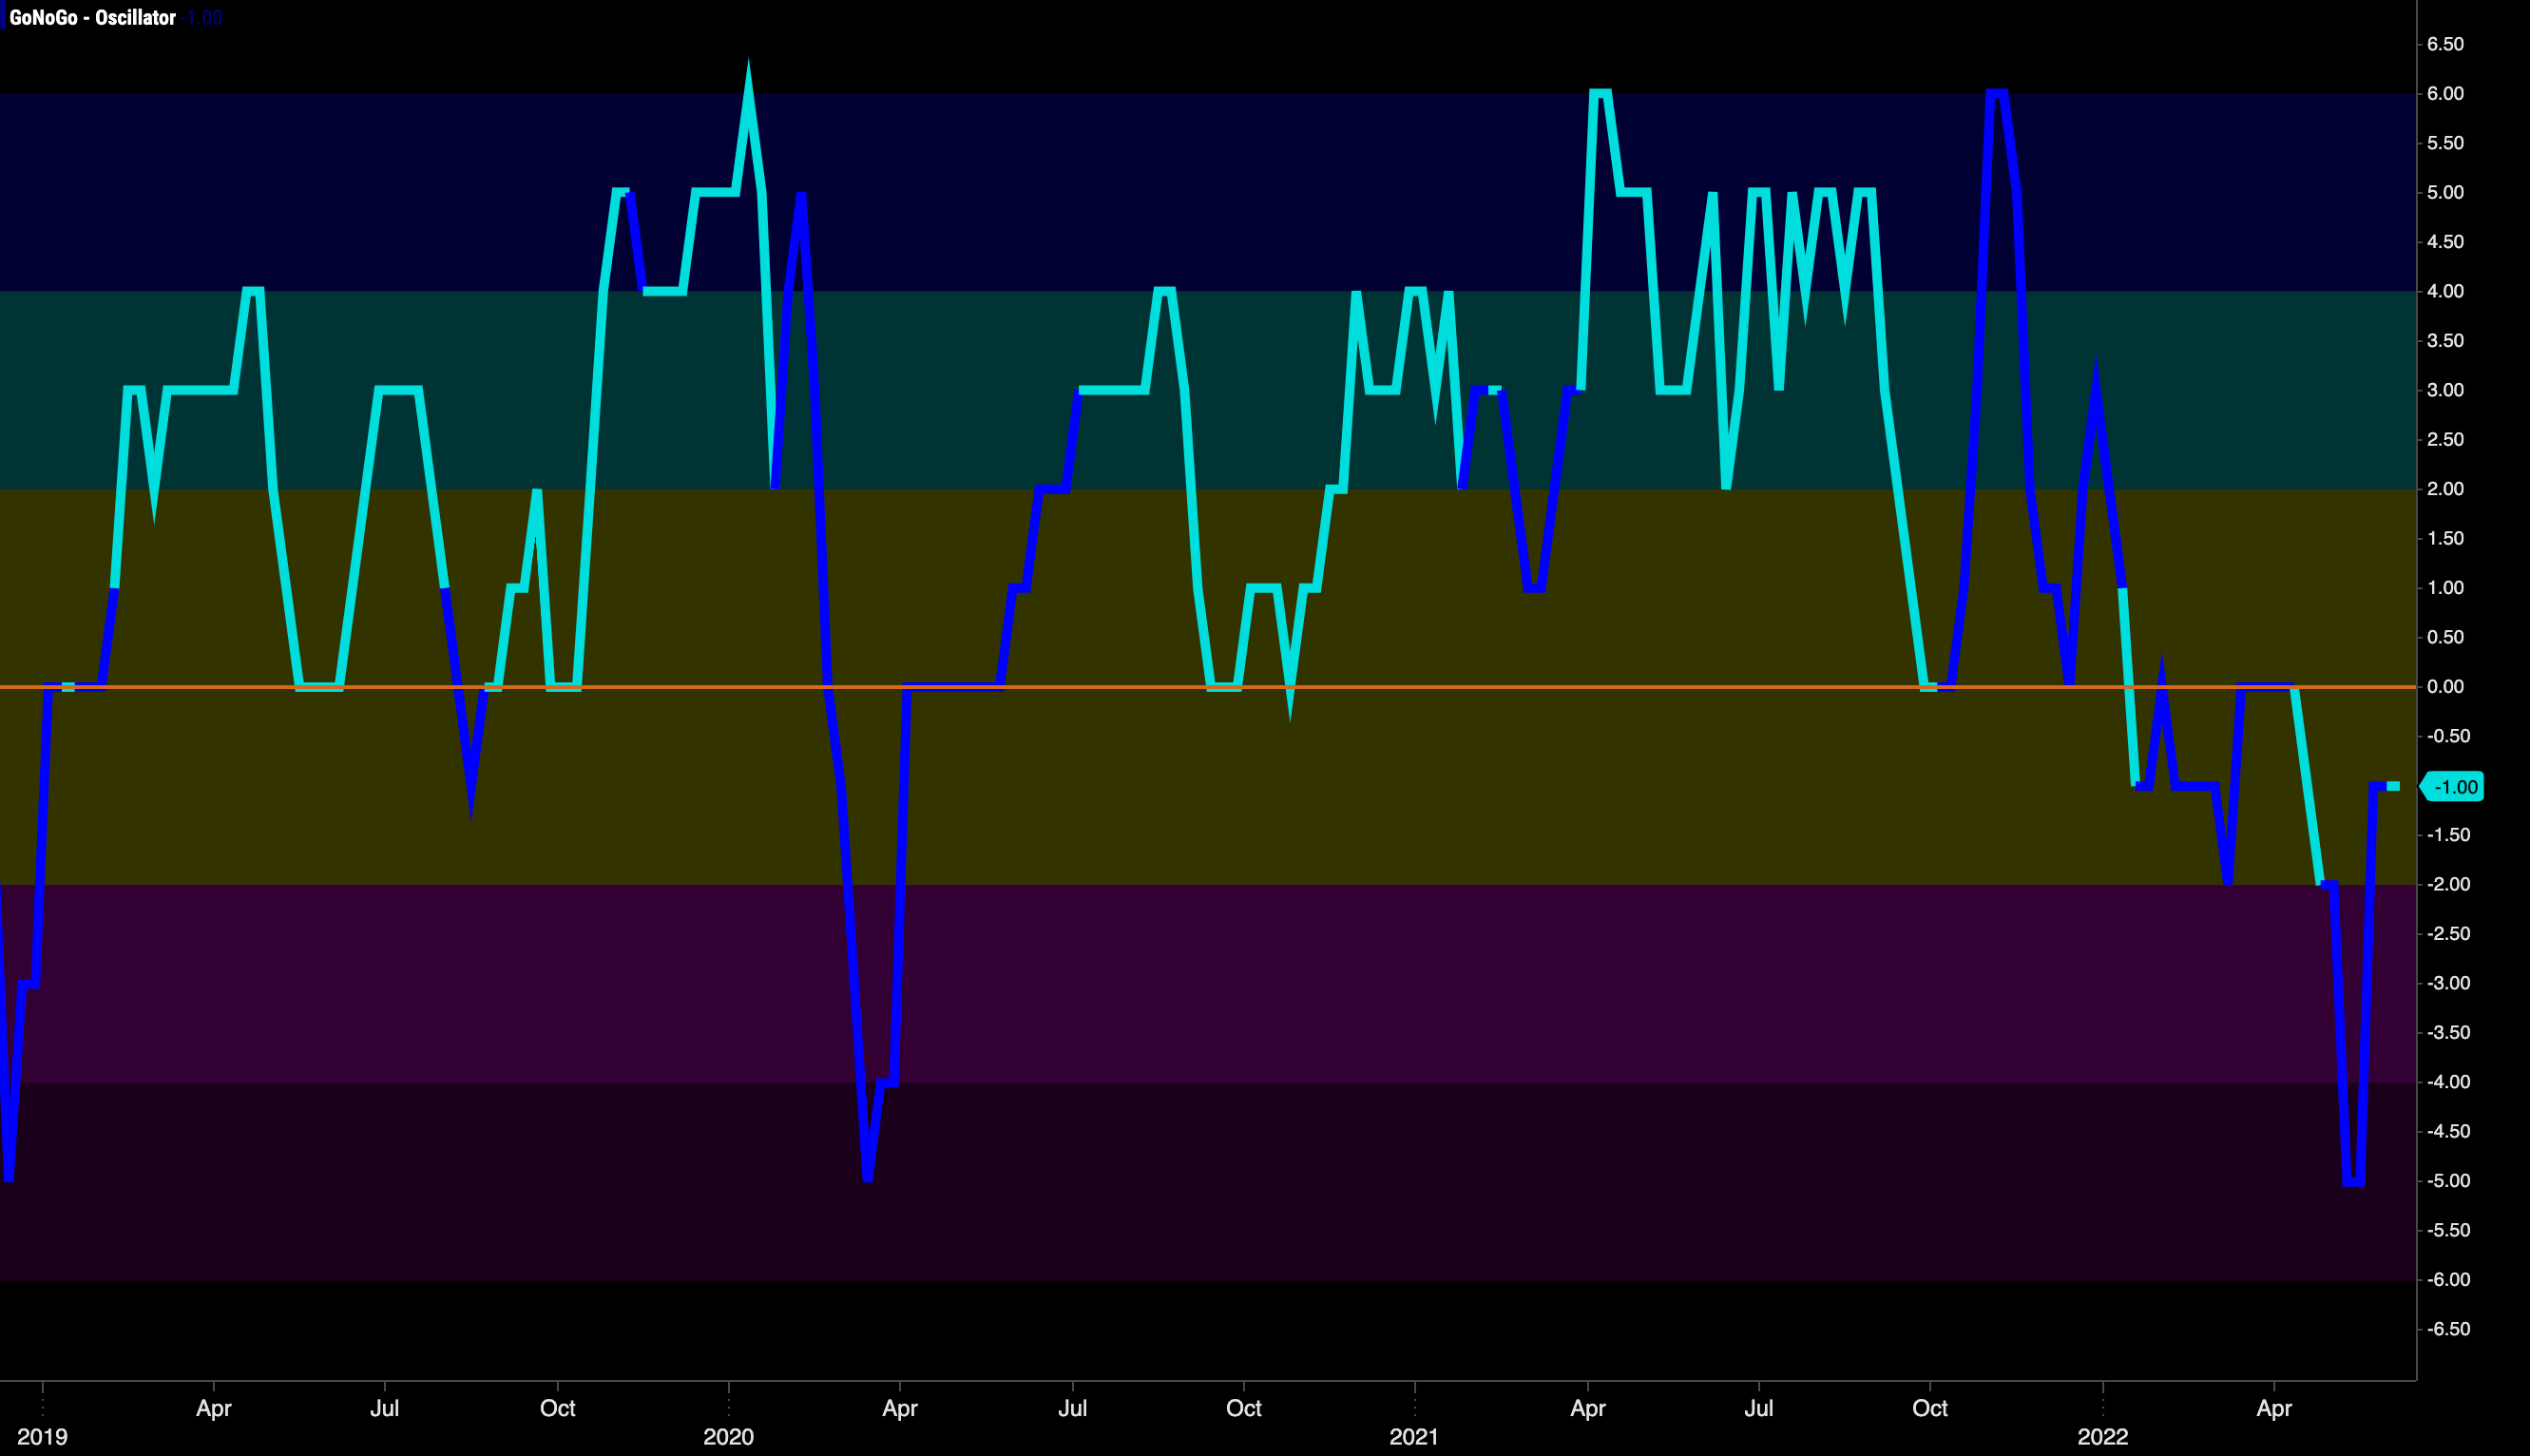
GONOGO OSCILLATOR
Monitors the velocity of price change
Combining several popular ideas about market behavior, supply/demand relationships, and the velocity of price changes together to promote clear momentum analysis.
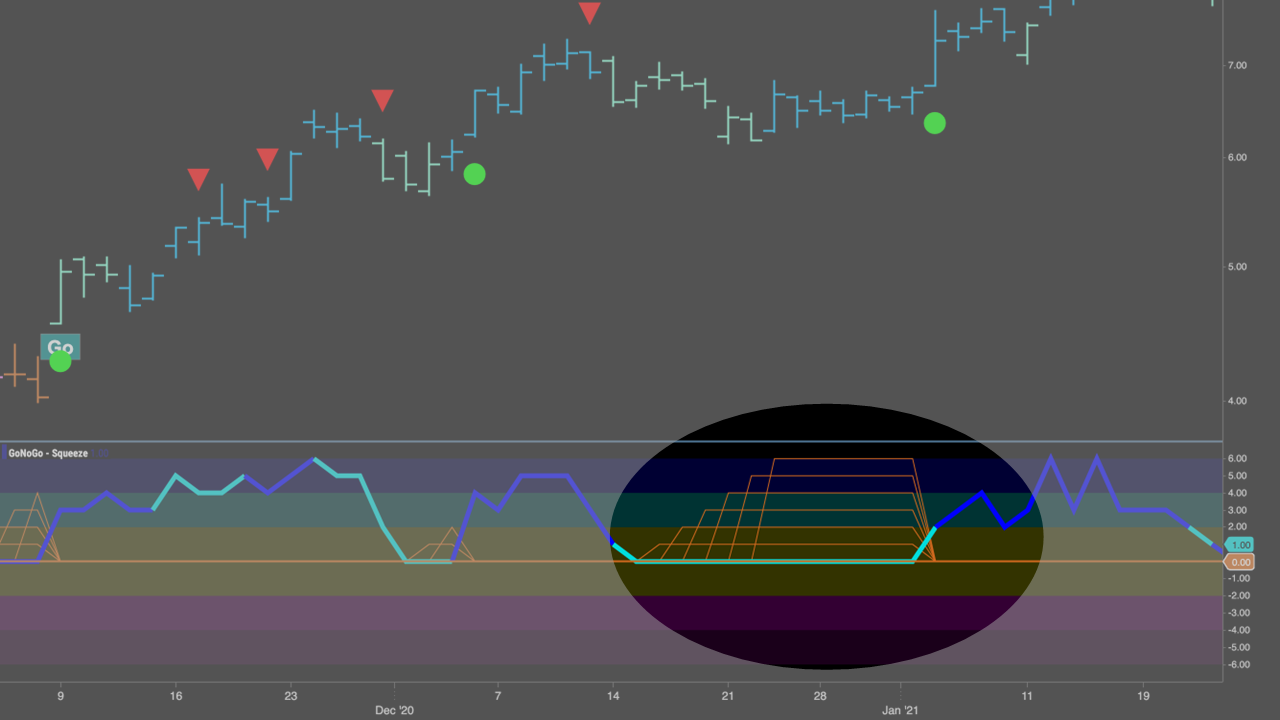
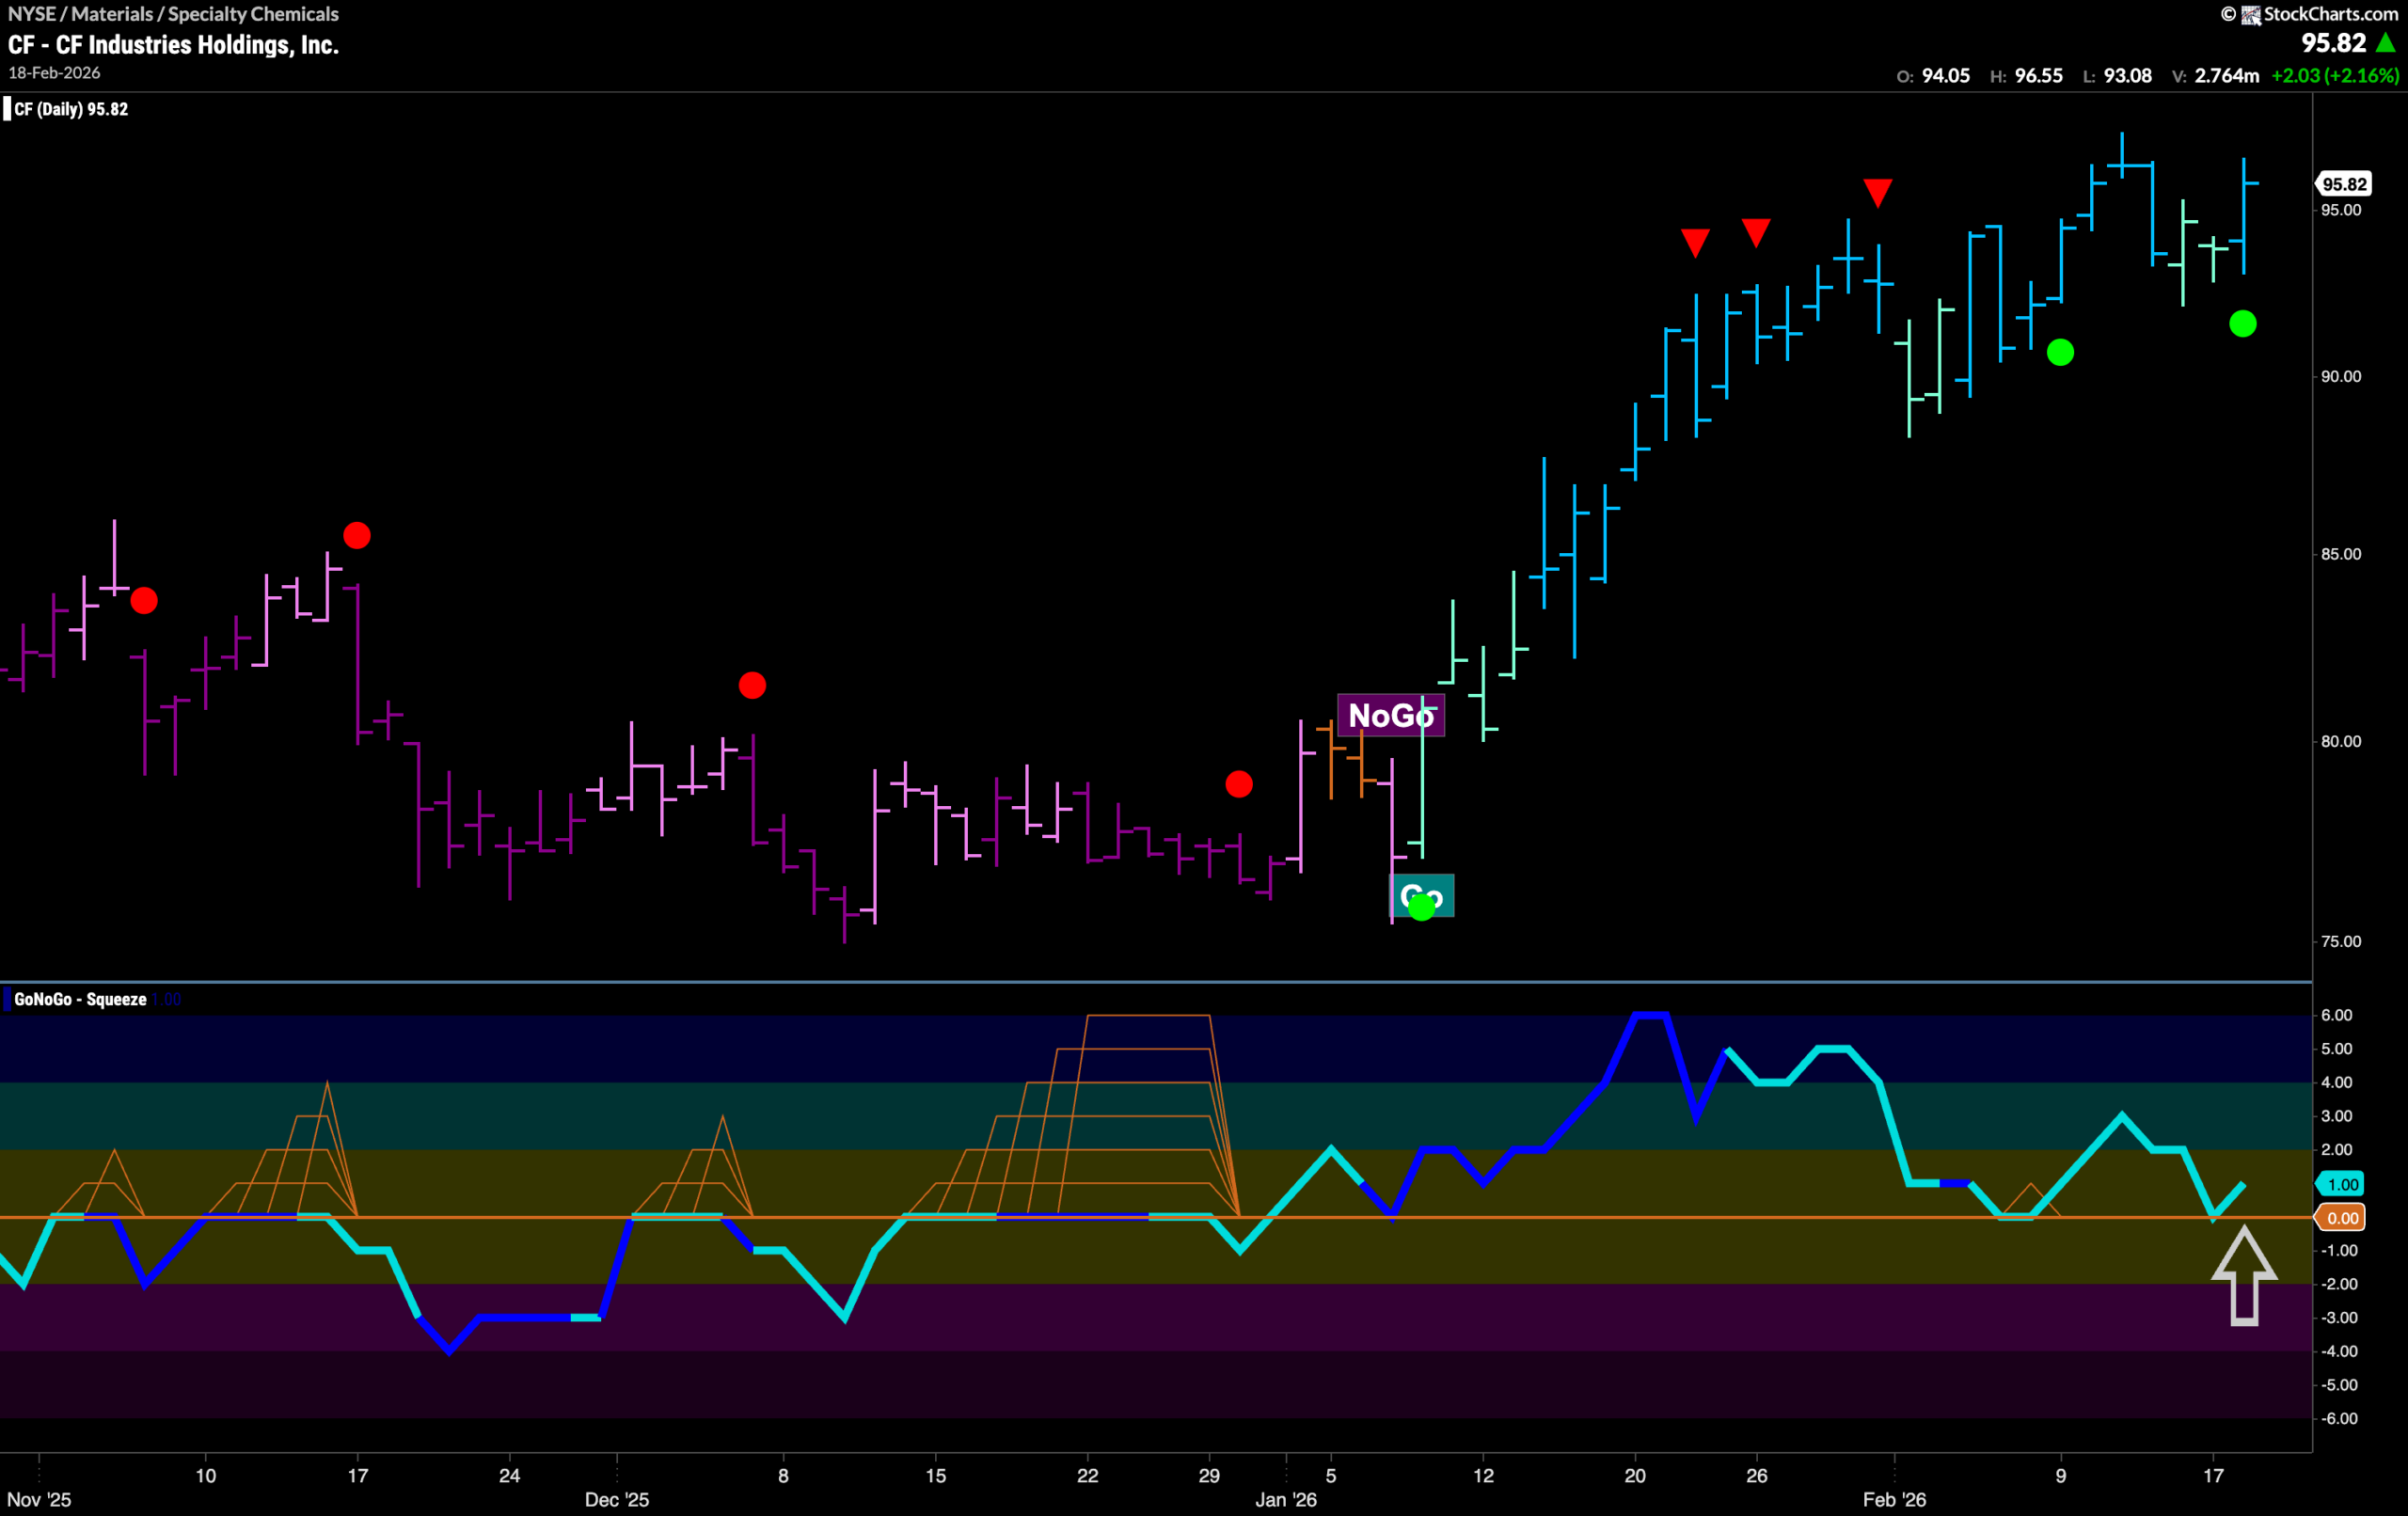
GONOGO SQUEEZE
Identifies periods of compressed volatility
Illustrating periods of reduced volatility as a climbing grid, depicting the intensity of stagnation and likelihood of a breakout.
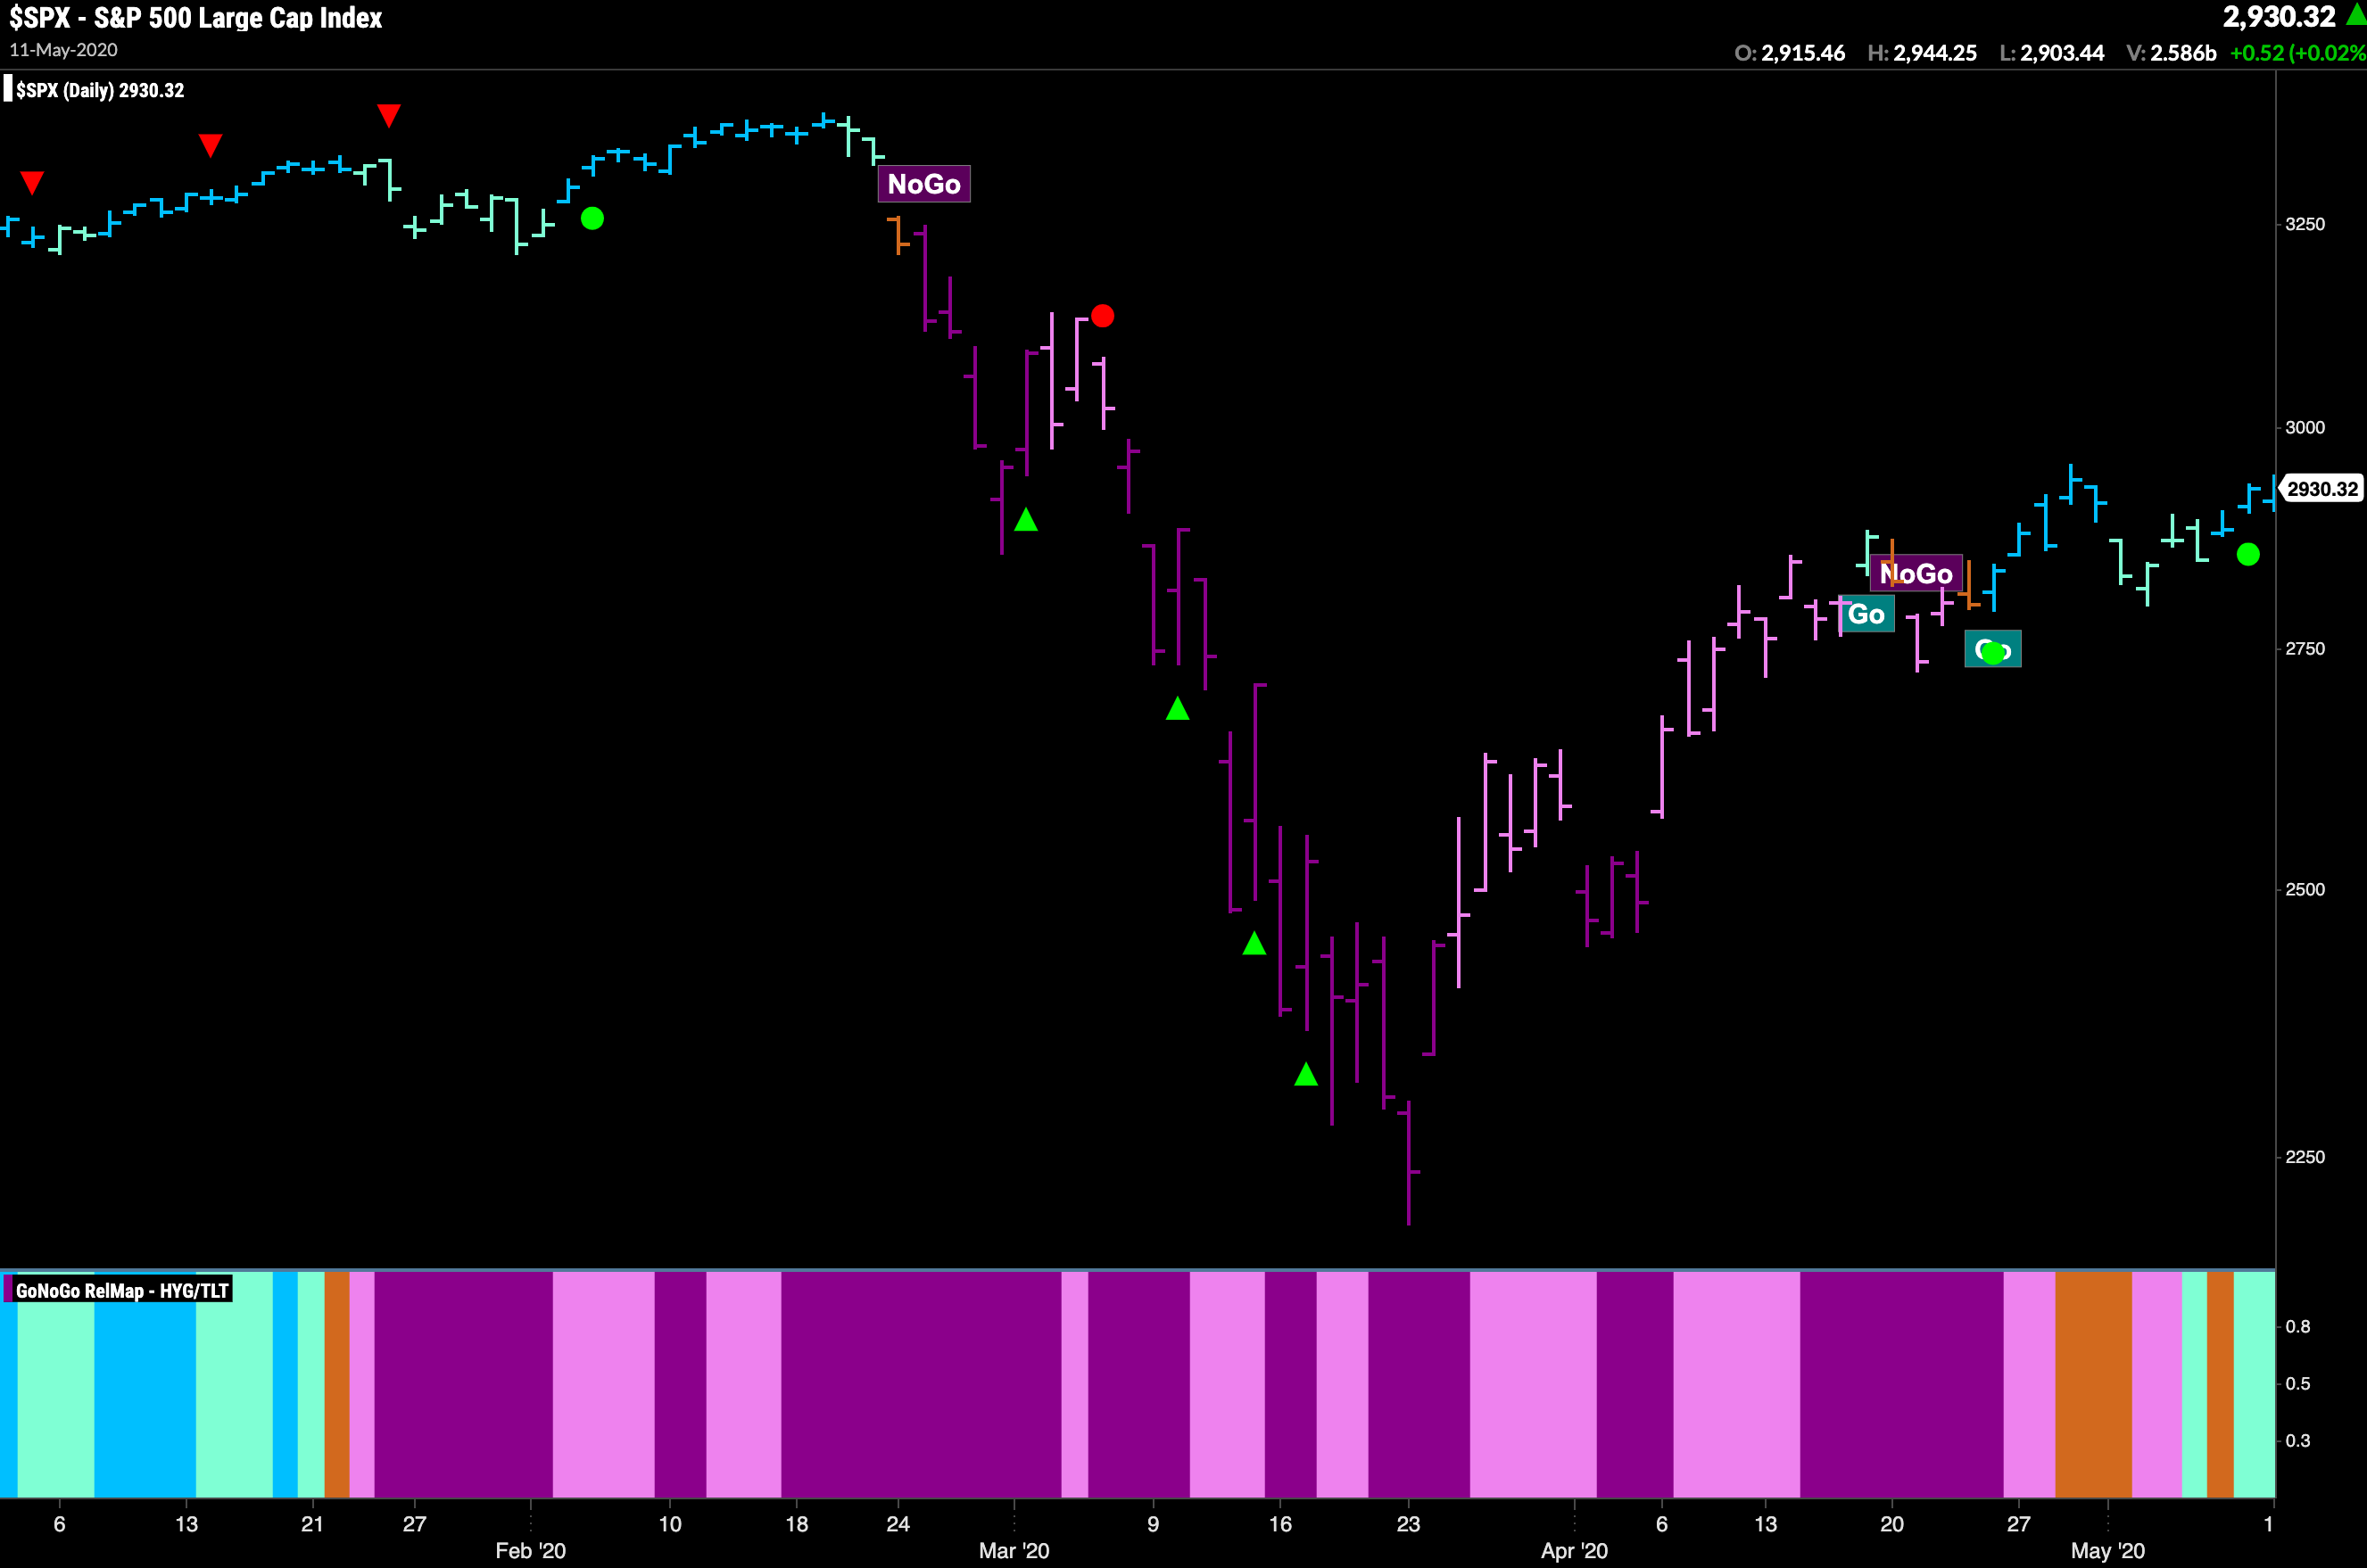
GONOGO RISK
Applies the GoNoGo Trend concept to a fixed ratio as a proxy for overall market risk
Helping investors evaluate the trend of risk exposure with more nuance than simply risk-on/risk-off.
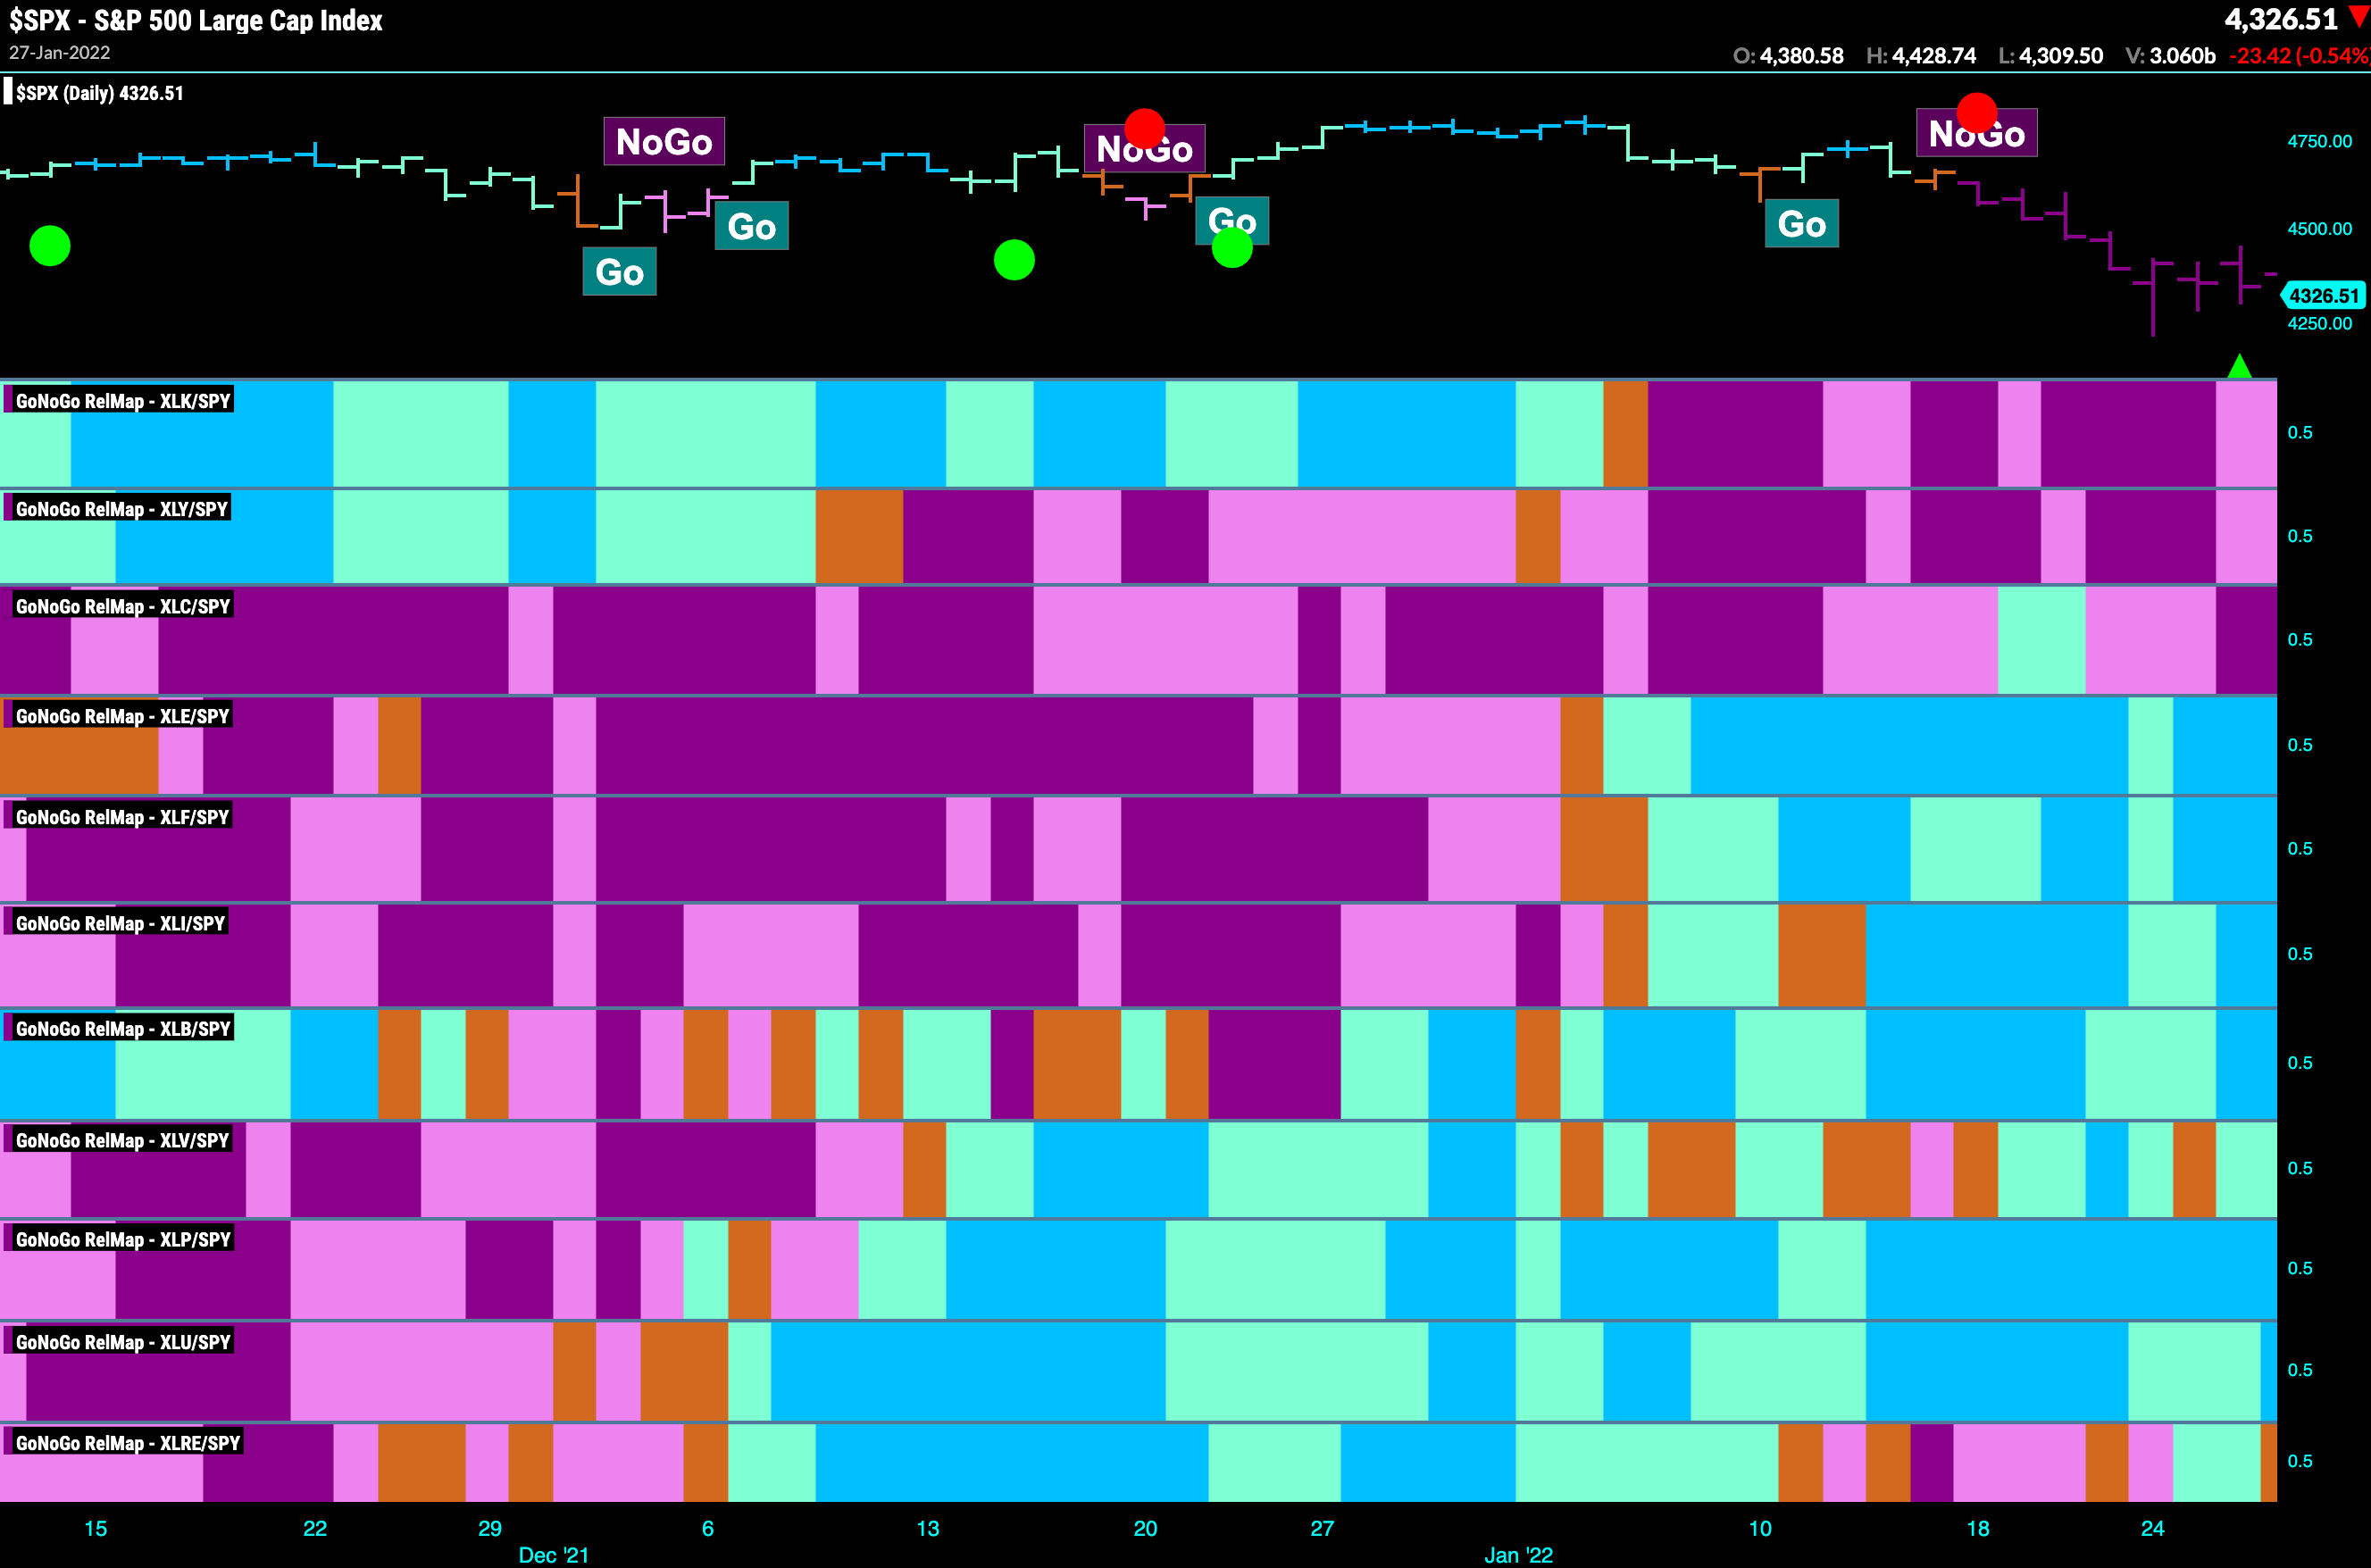
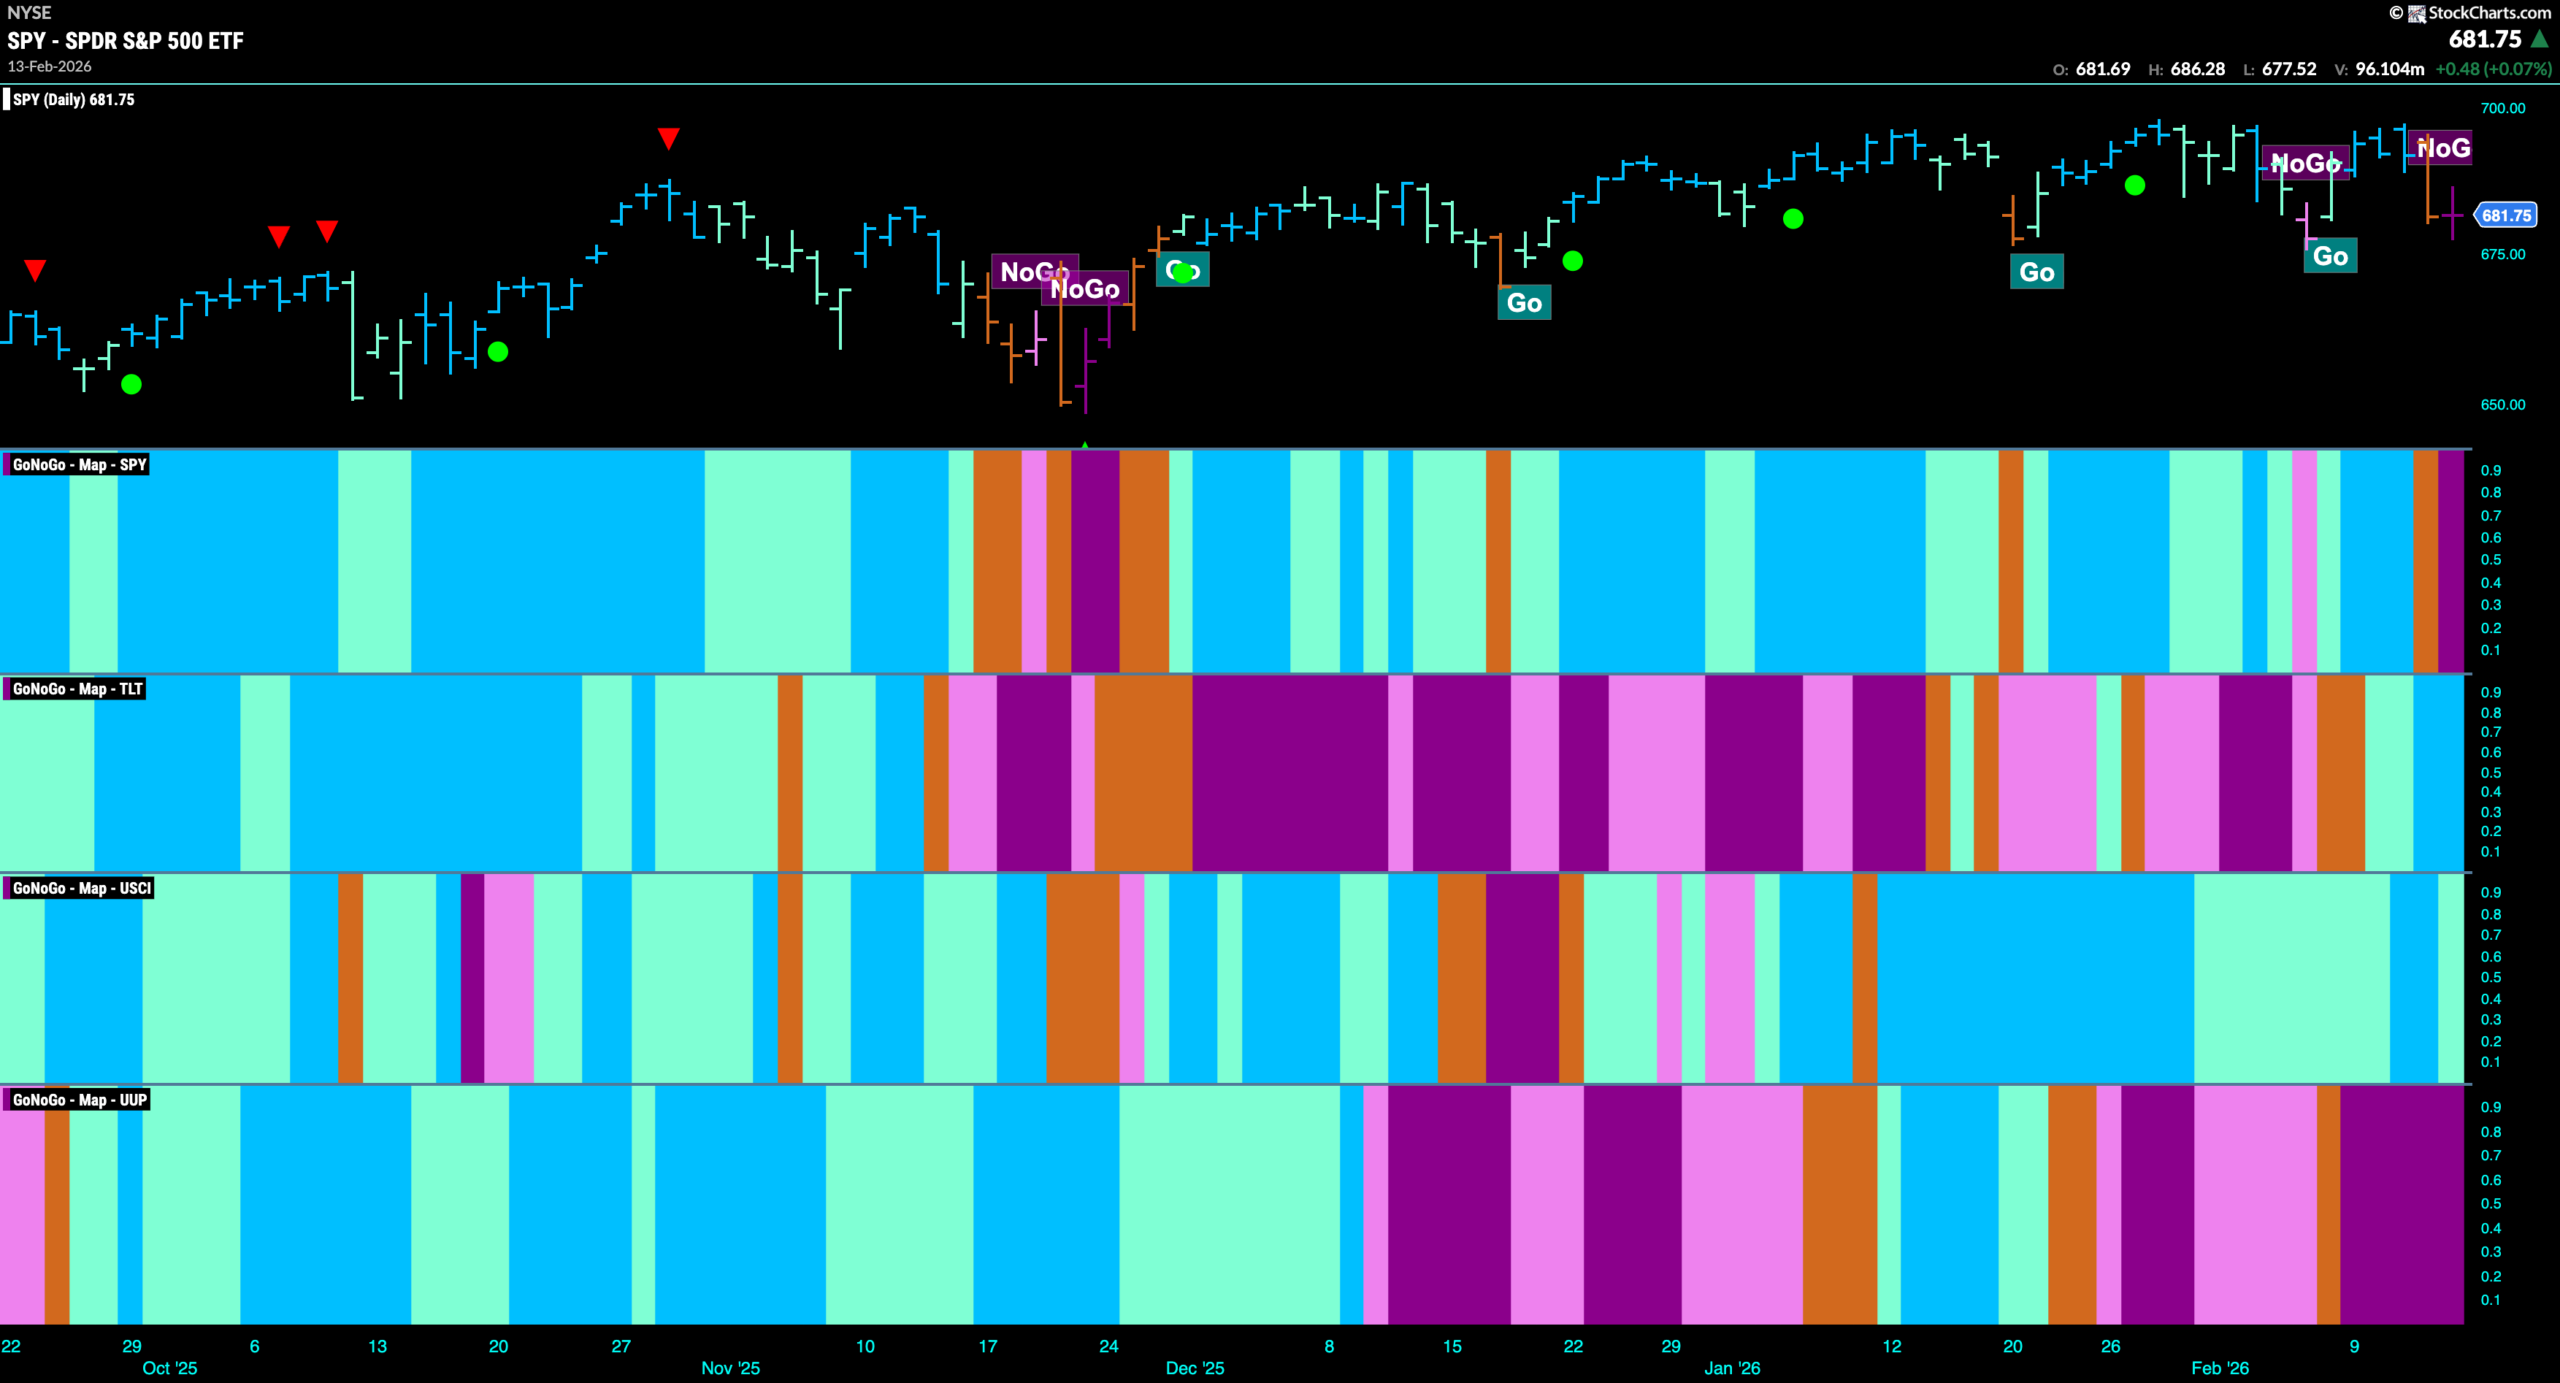
GONOGO HEAT MAP
Compares multiple securities on relative or absolute trends
Visualizing leaders and laggards in asset classes, sectors, or the securities in a given portfolio. Investors are able to make timely attribution decisions based on GoNoGo Trend identification relative to other assets.
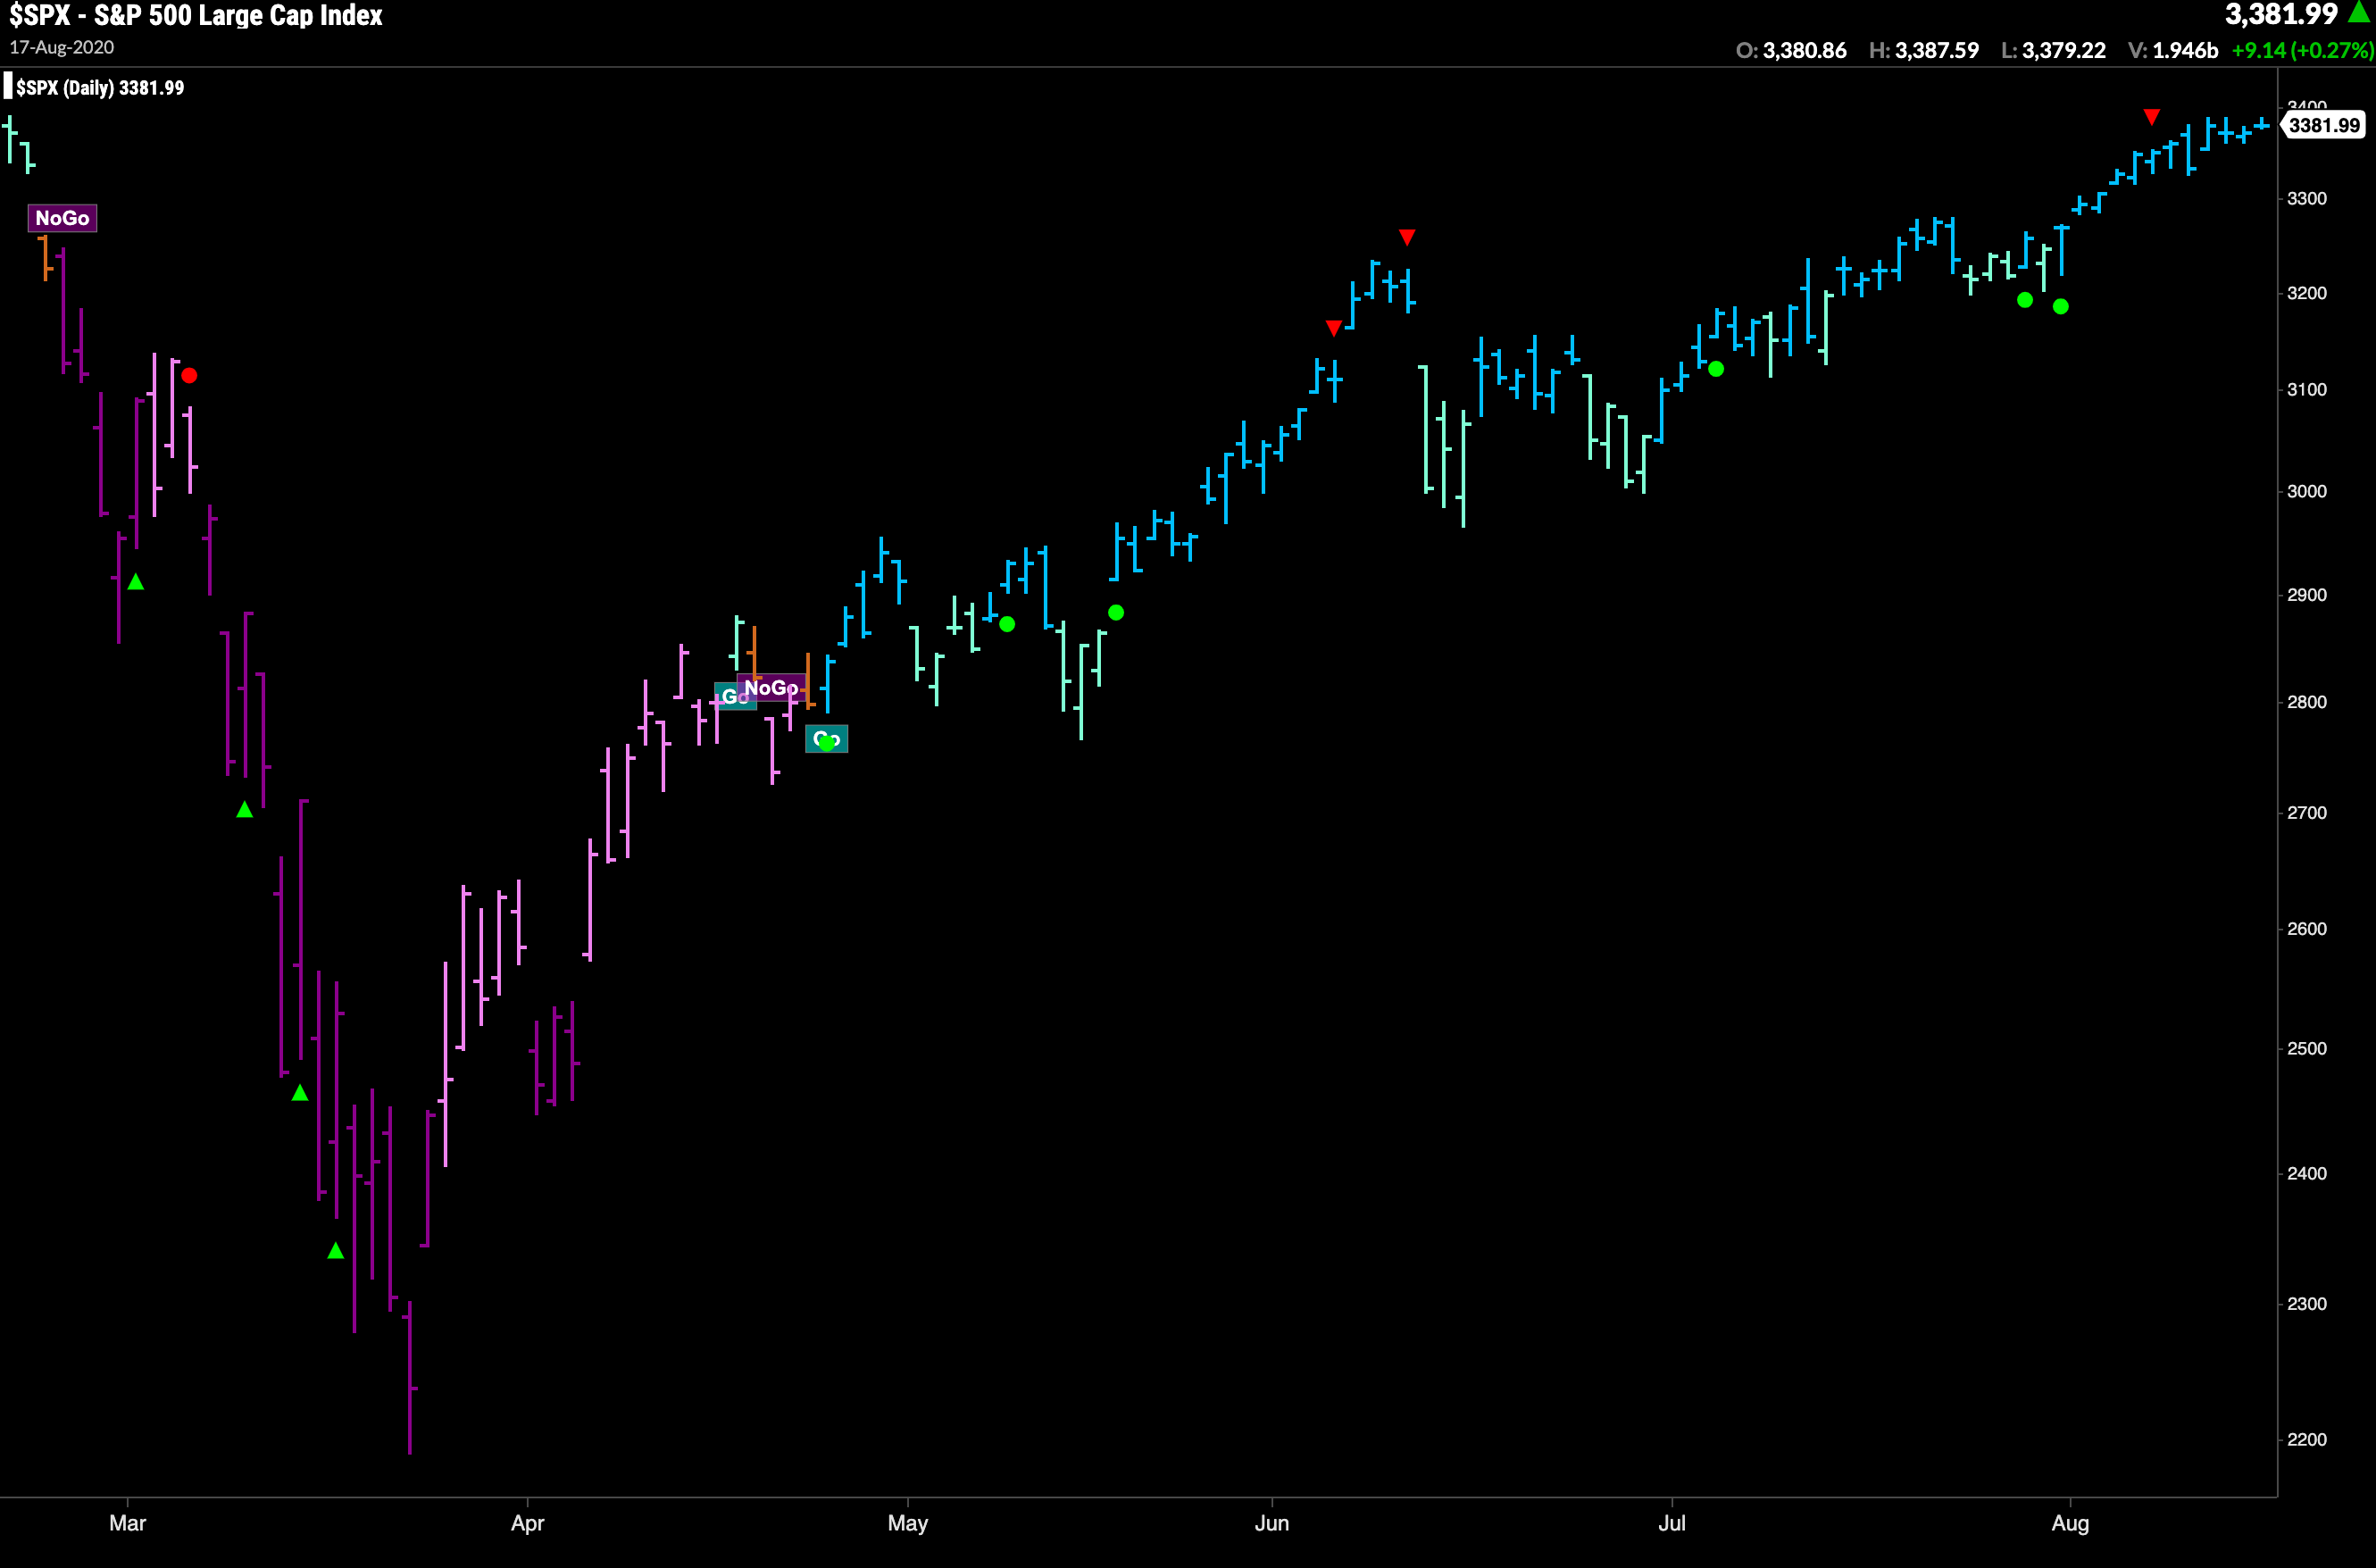
GONOGO ICONS
Signals resurging momentum for trend continuation, or countertrend exhaustion
GoNoGo Icons highlight low-risk opportunities for trend participation and alert investors to short-term countertrend corrections with intuitive icons directly in the price action.


