Momentum goes hand in hand with trend identification. GoNoGo Oscillator® helps investors understand the velocity of price change, giving valuable information about the strength of a trend and the market’s conviction in it. Strong or increasing momentum provides confirmation of a trend while decelerating momentum gives the investor a leading indication of weakness and the potential for reversal.
OVERBOUGHT & Oversold
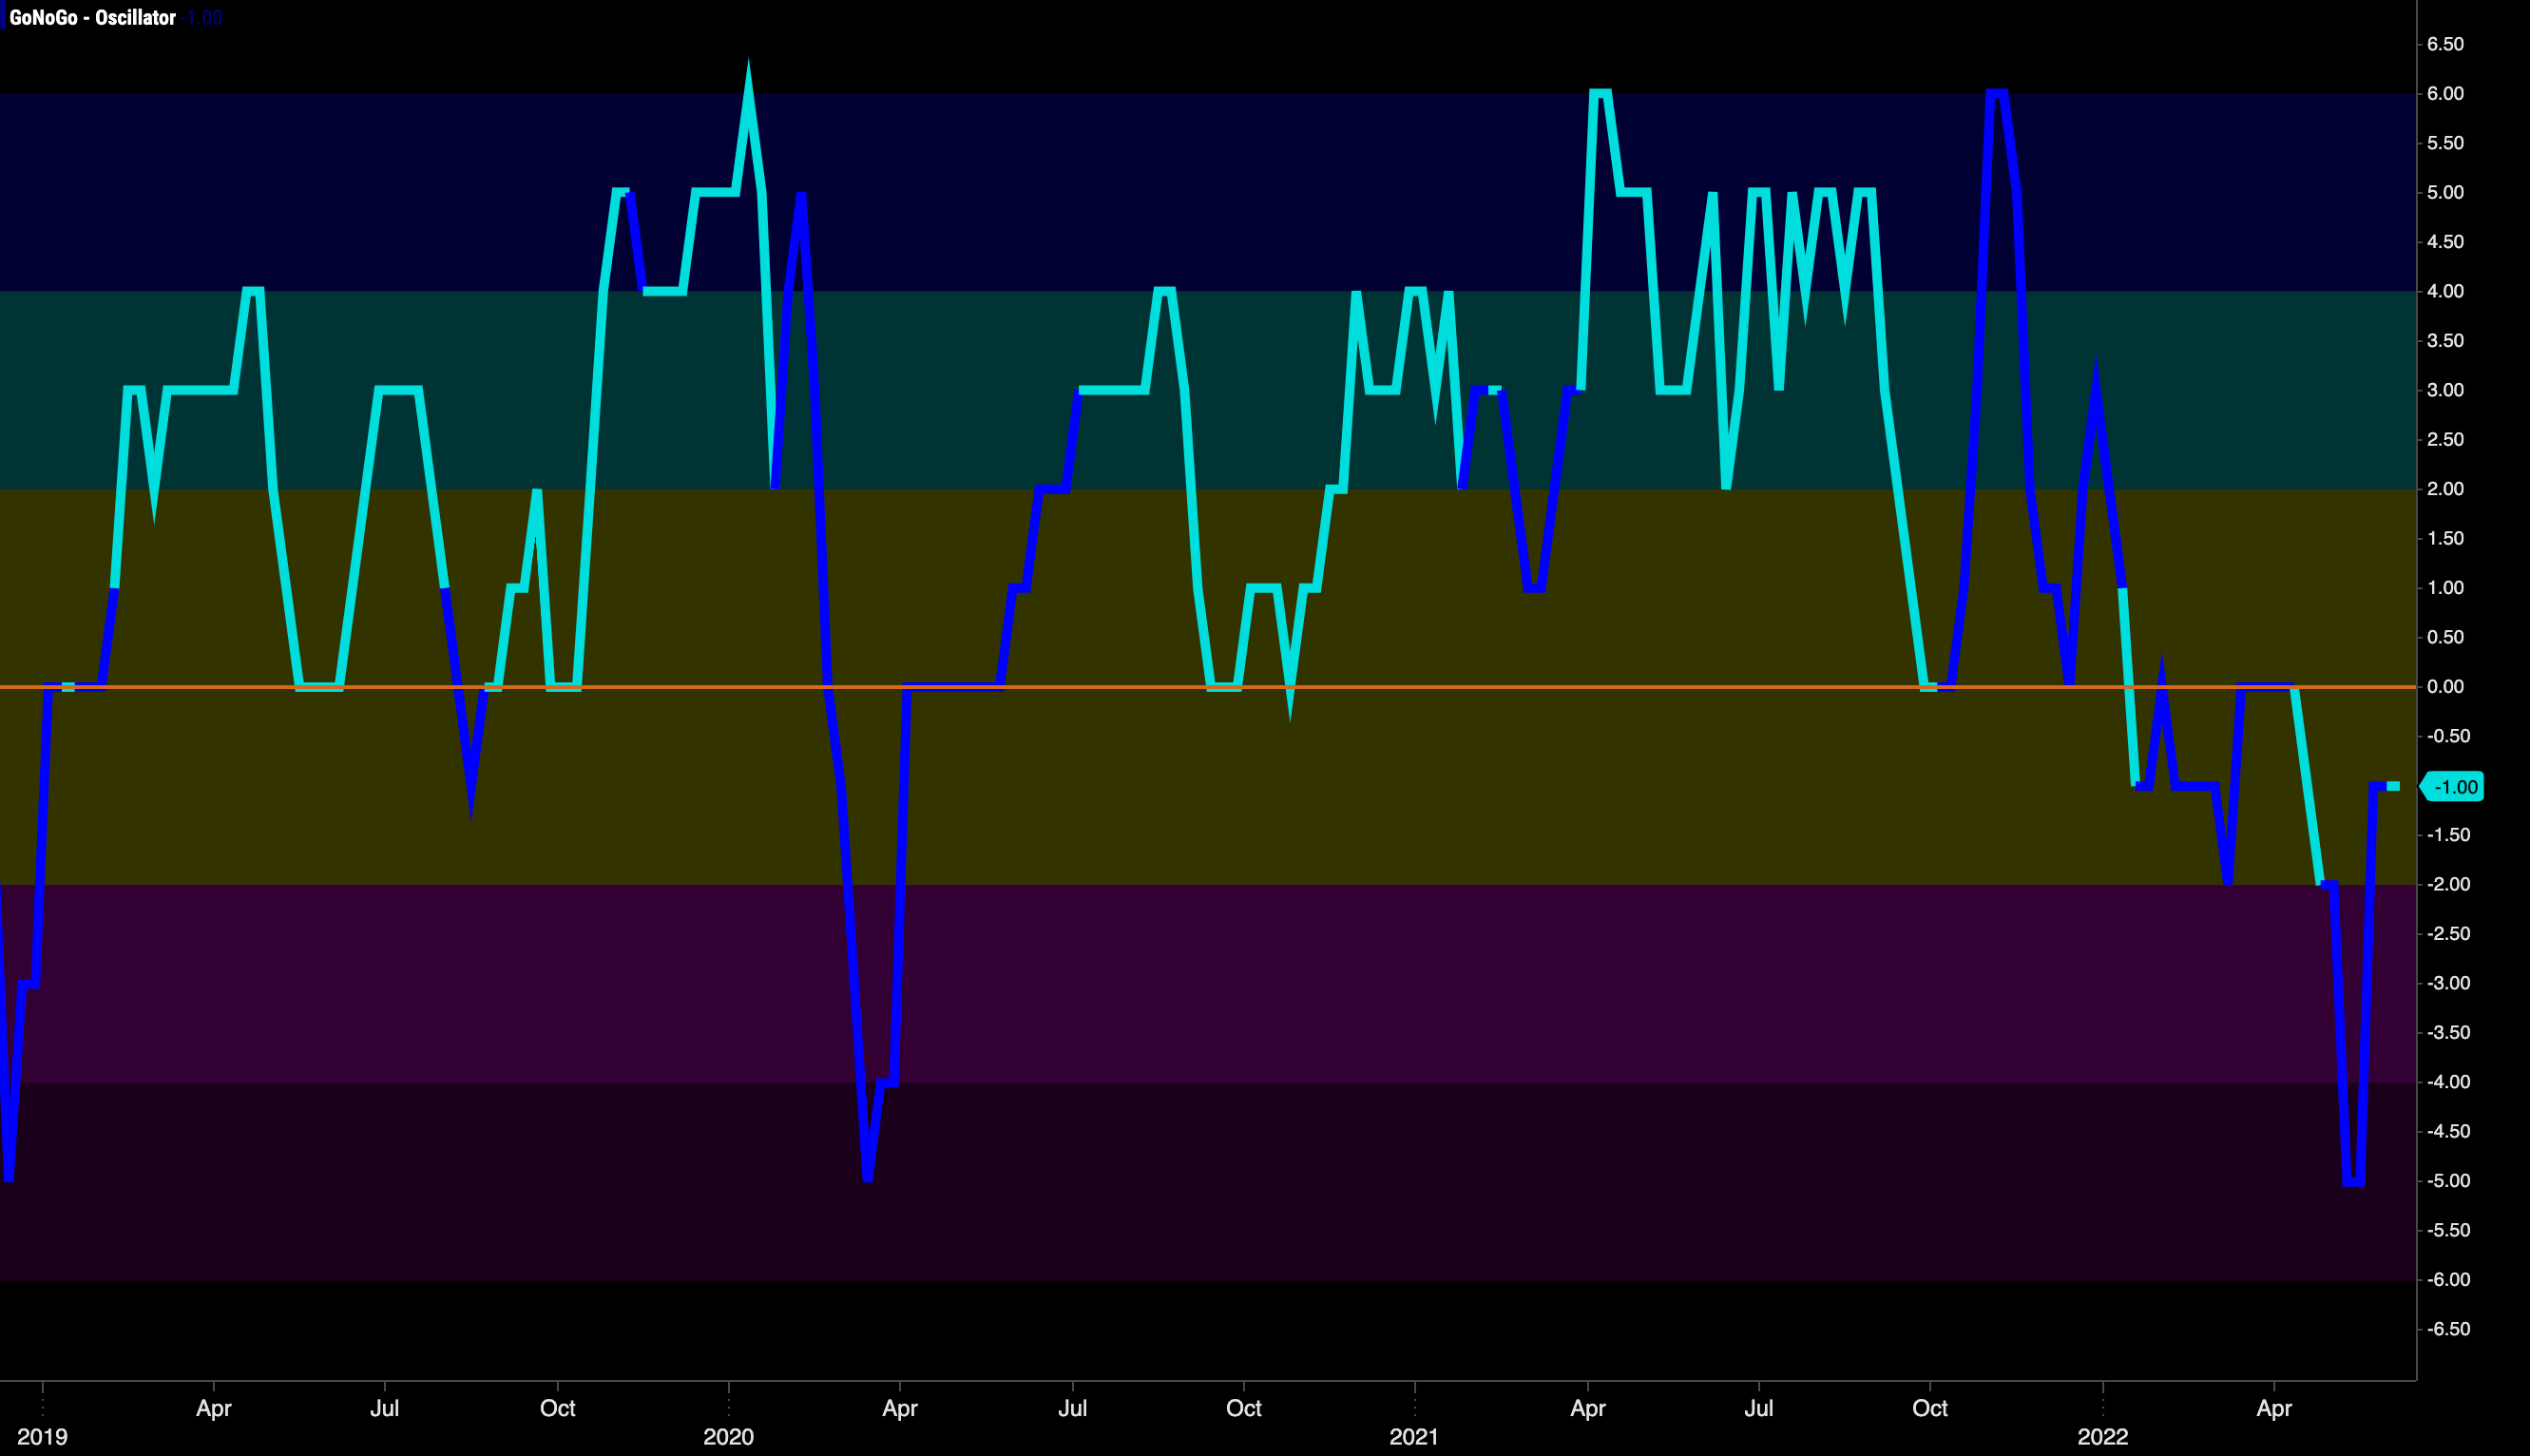
GoNoGo Oscillator® blends several popular momentum ideas together to provide the user with meaningful momentum analysis. As an oscillator, the indicator’s values range above and below zero, from -6 to +6, with extreme positive values being considered overbought and extreme negative values, oversold. Within trend, a security’s momentum may reach overbought/oversold levels, then fall back toward the zero-line, and then rally again. A break above/below zero would indicate divergent momentum – unsustainable for a healthy trend.
VOLUME INCORPORATED
In addition, GoNoGo Oscillator’s color features a change from light blue to dark blue when volume is heavier than normal. Confirming or diverging volume readings give investors additional insight at pivotal decision points.


