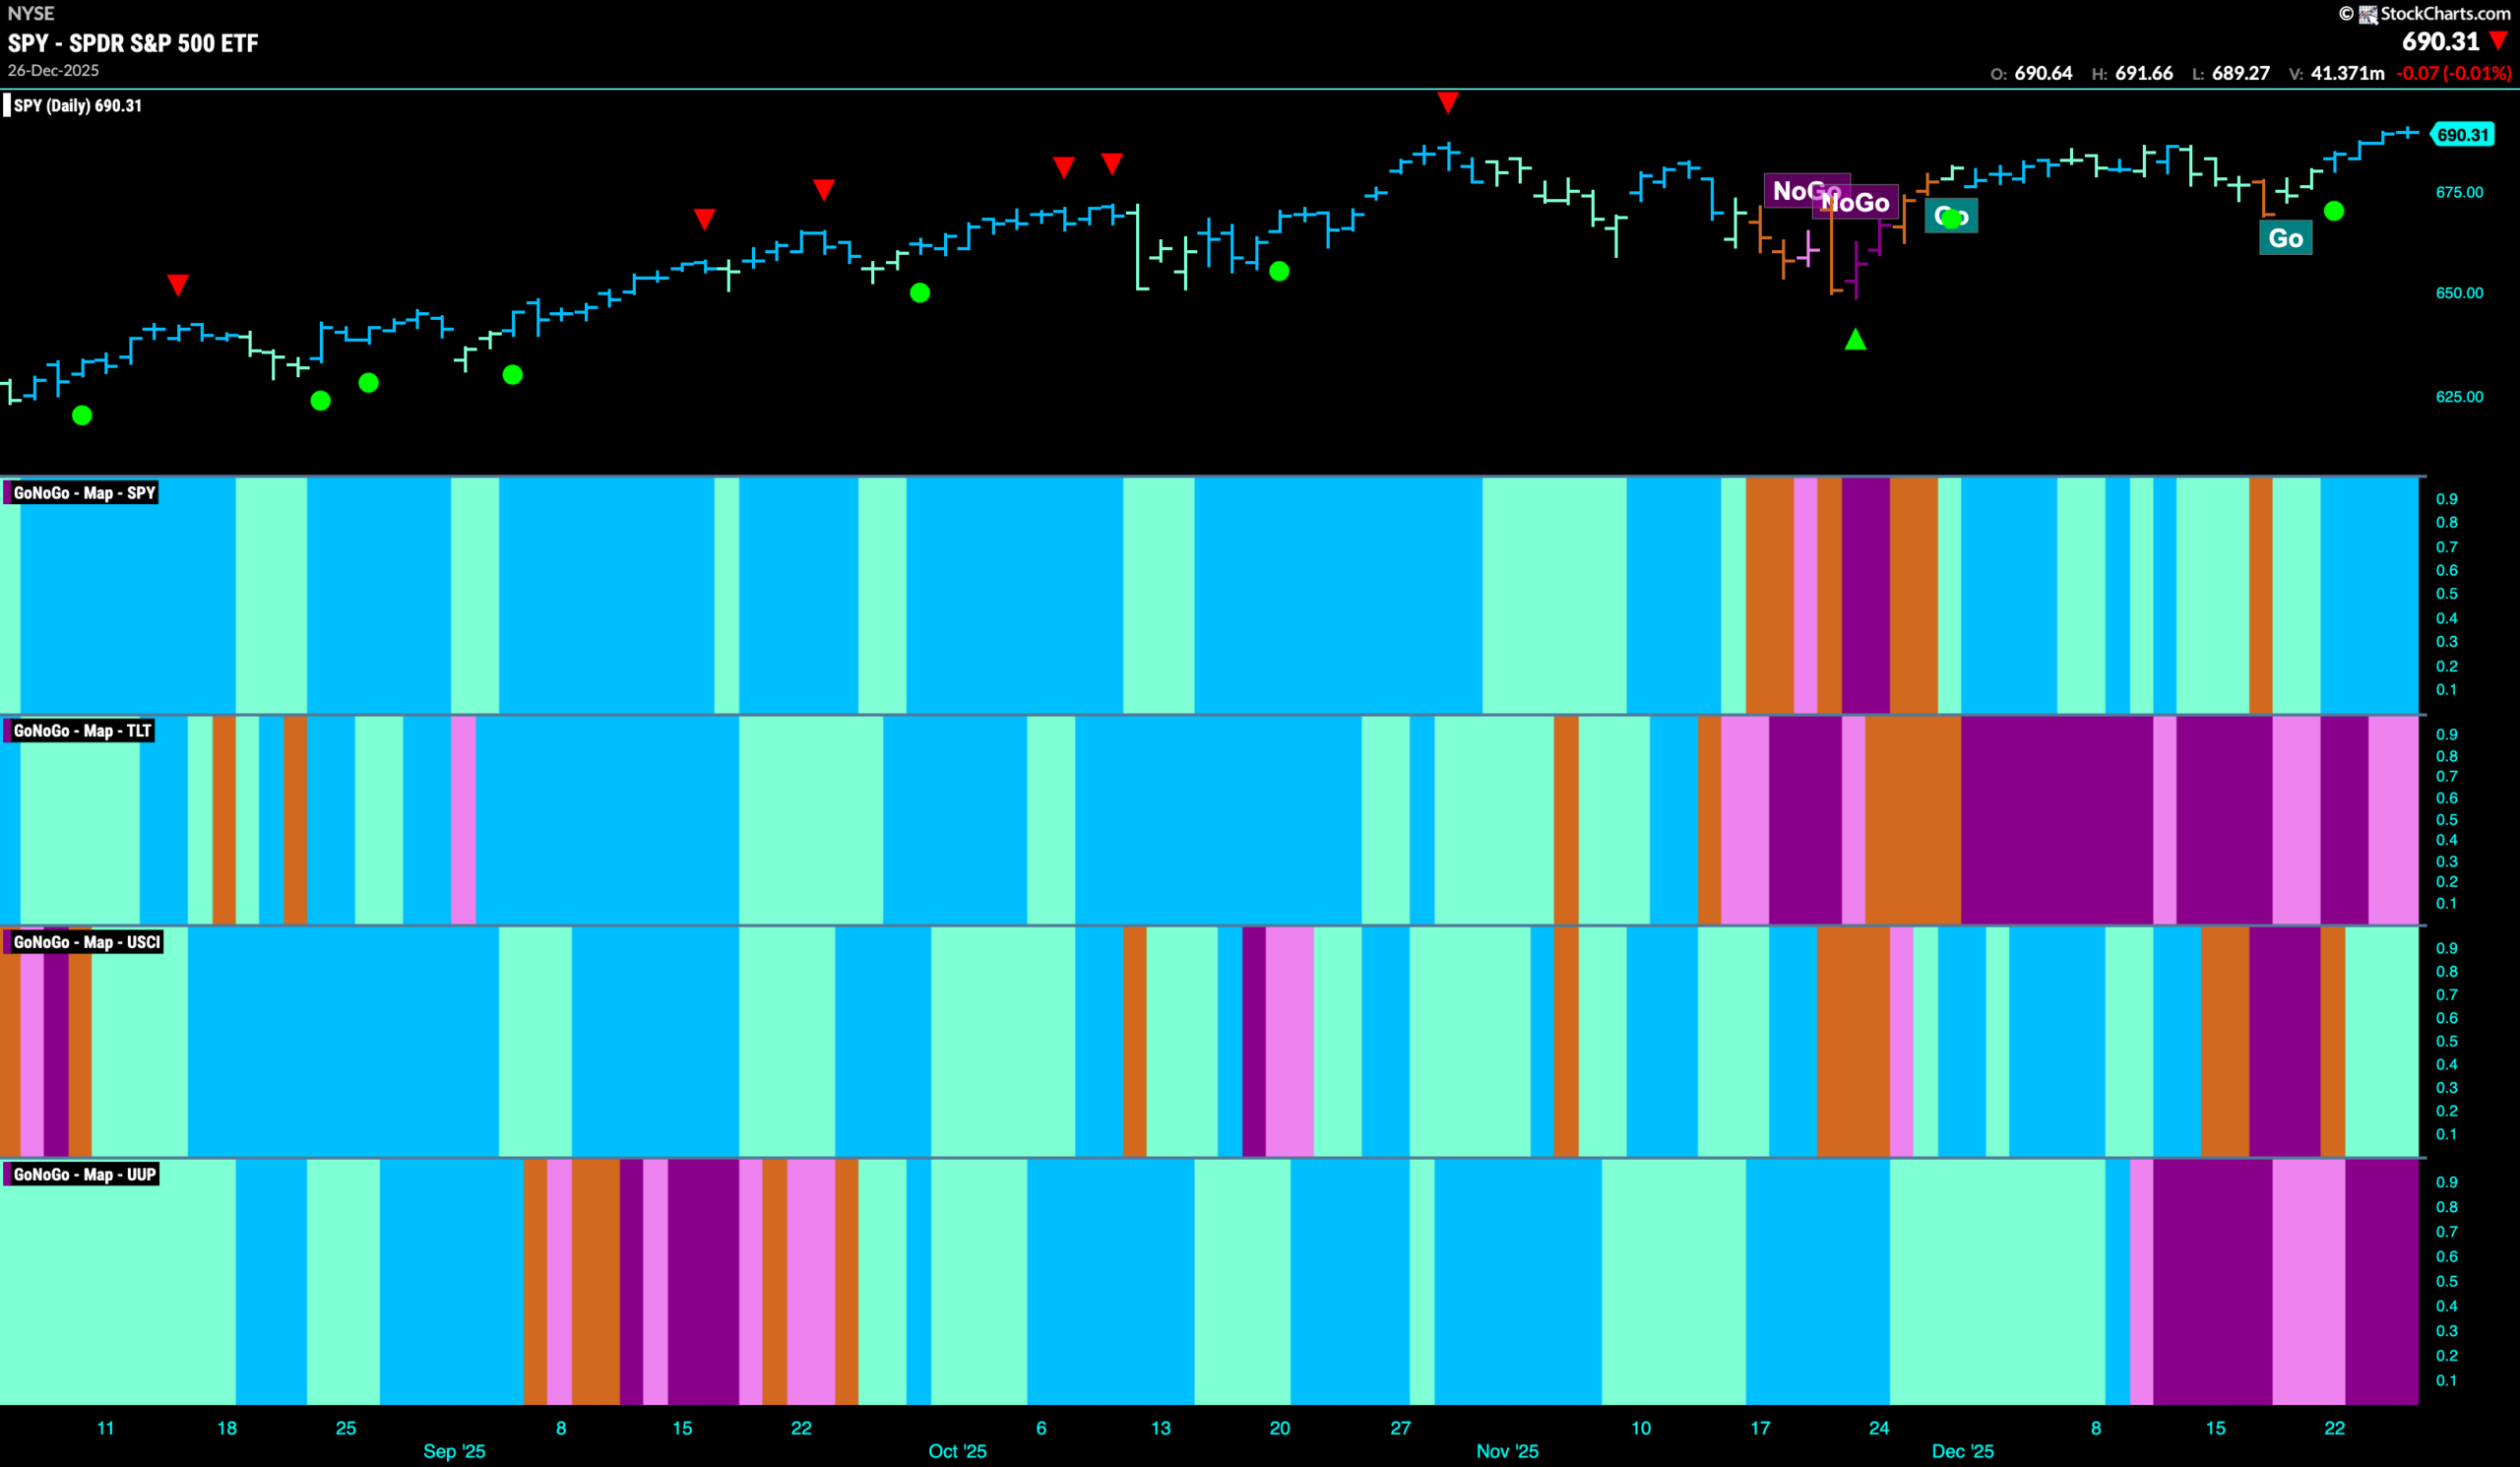
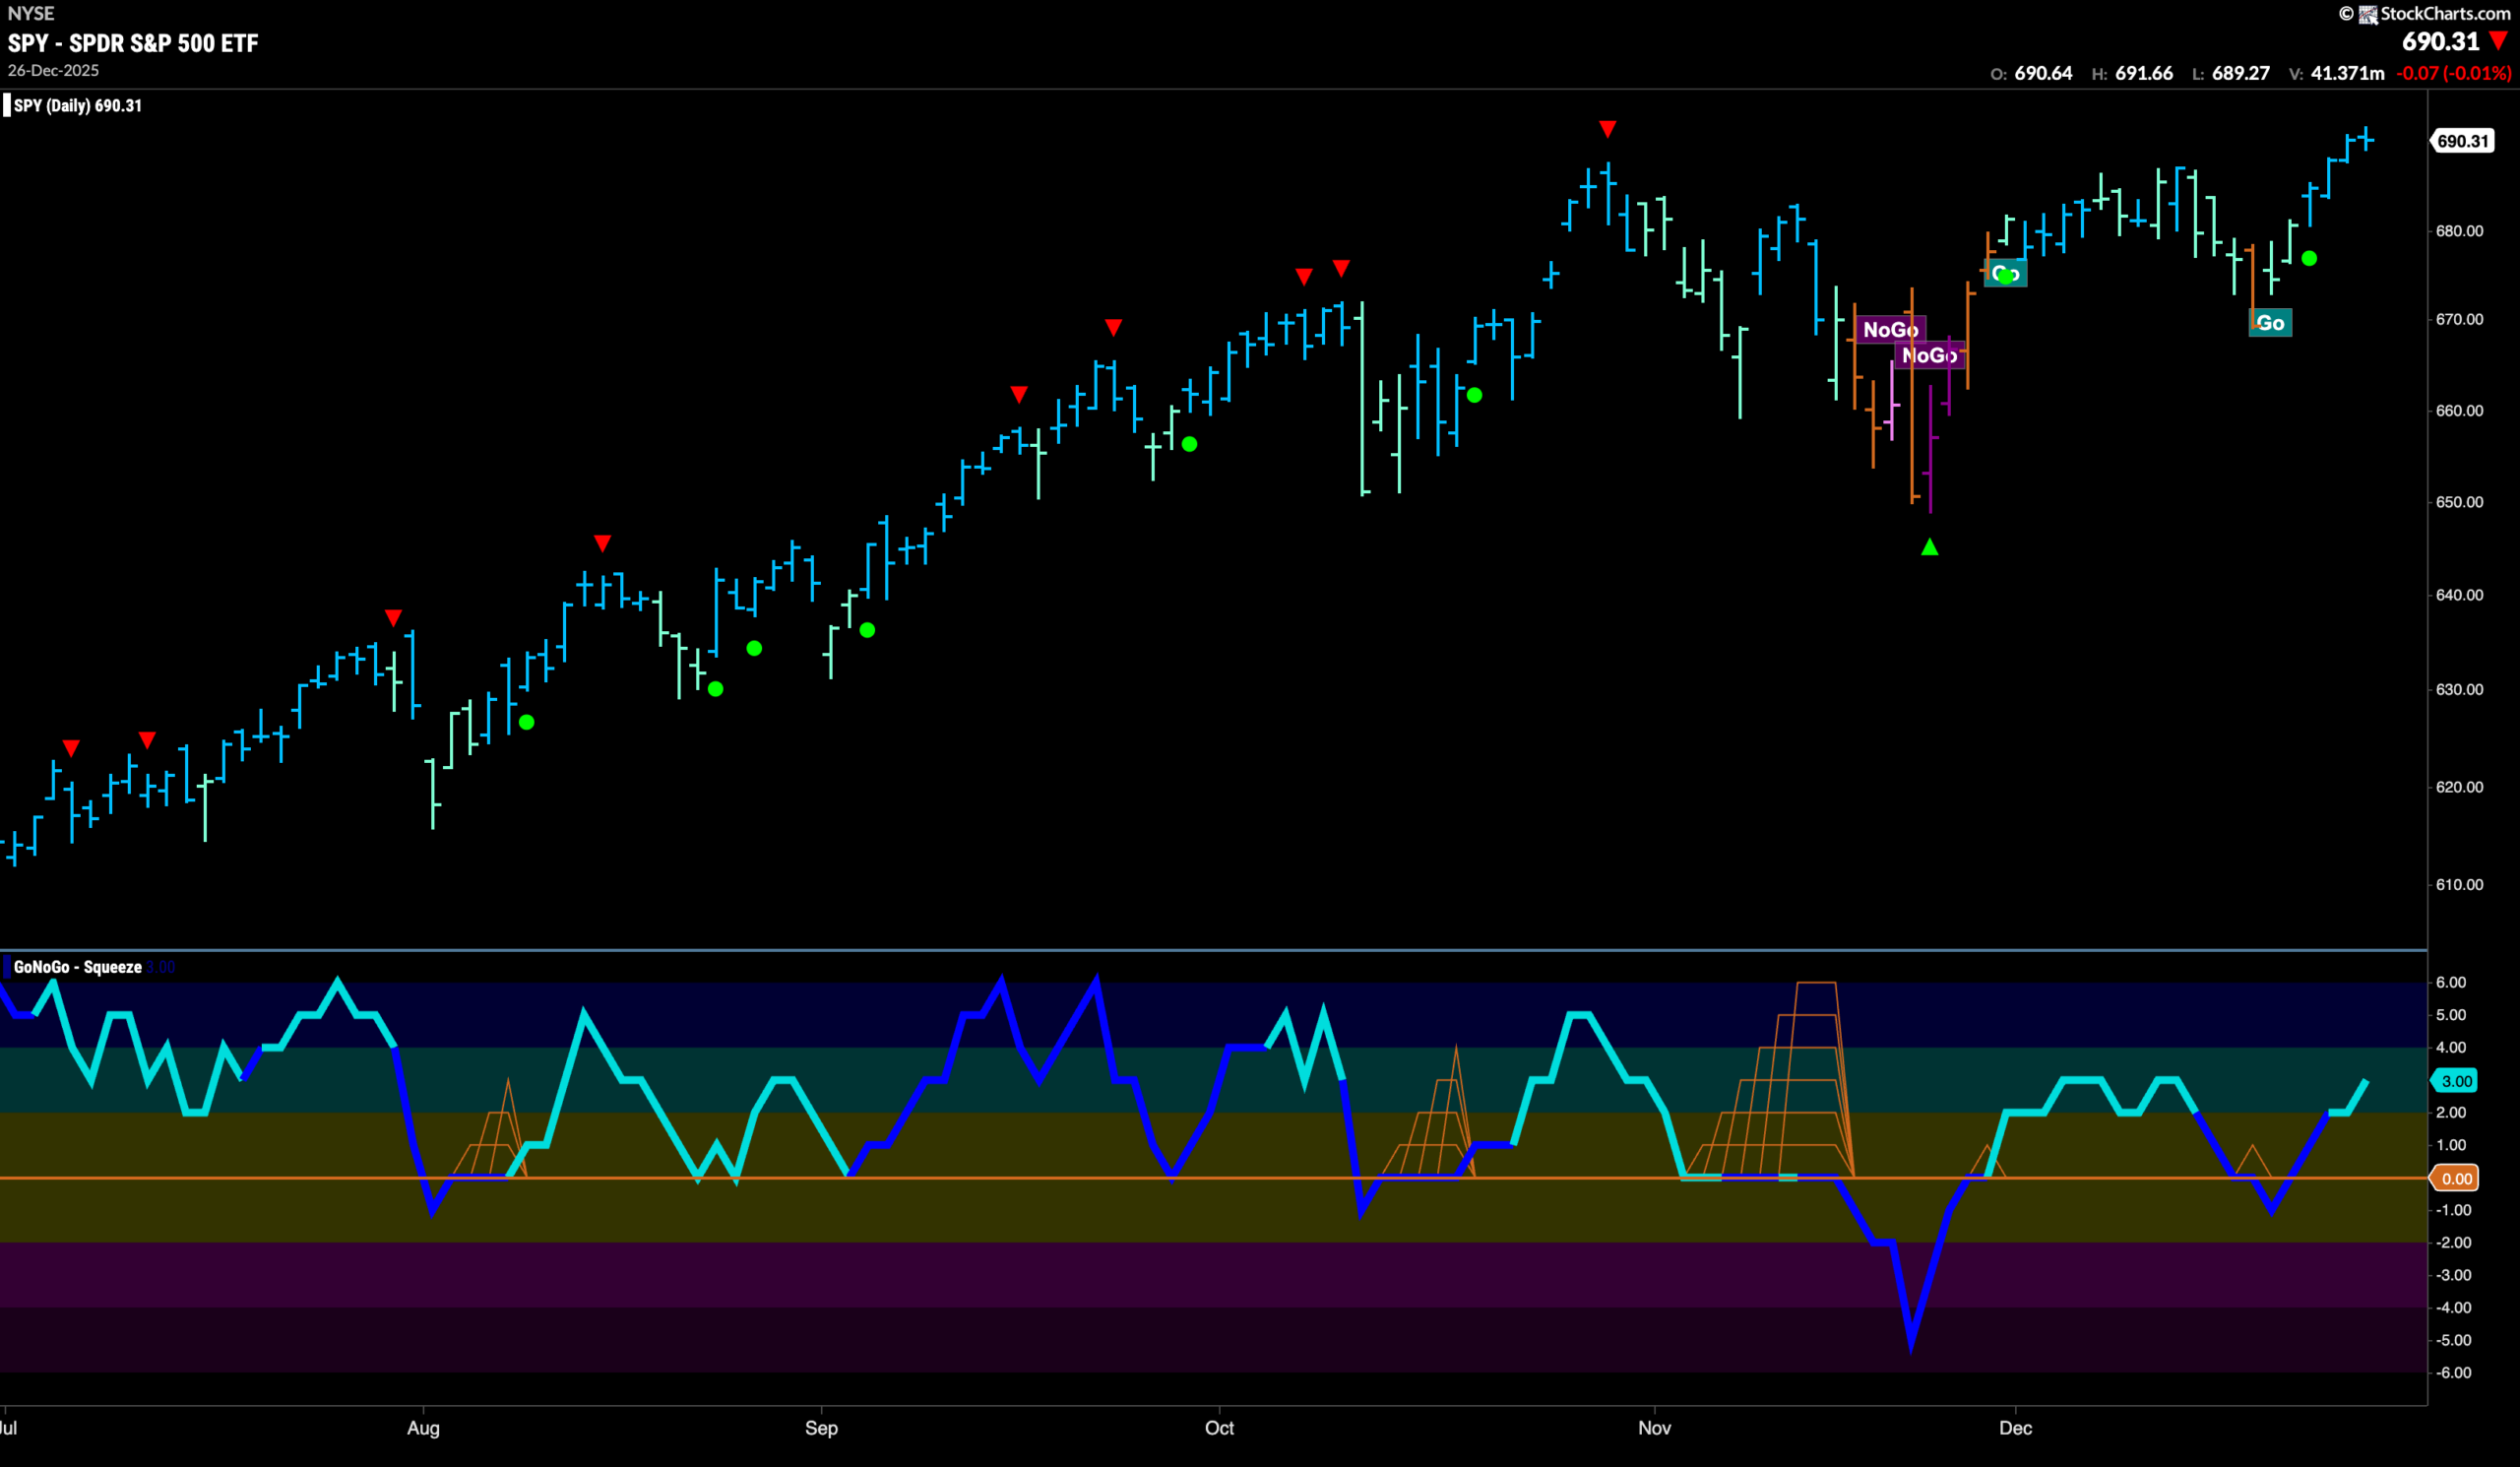
Good morning and welcome to this week’s Flight Path. Equities have found strength once again as this “Go” trend hits new highs on strong blue “Go” bars. Treasury bond prices have stayed in a “NoGo” although we do see weaker pink bars as this week comes to a close. U.S. commodity prices have managed to enter a new “Go” trend but this week we saw only weak aqua bars as the trend tries to establish itself. The dollar remained in a “NoGo” trend and we saw strength return as GoNoGo Trend painted a string of purple bars as the week progressed.
$SPY Sees Strength Return
The GoNoGo chart below shows that the “Go” trend thrived this week as last week’s lone amber “Go Fish” bar of uncertainty provided a new higher low and strength returned this week as the indicator painted a string of bright blue bars and price hit new higher highs. GoNoGo Oscillator was able to quickly recover positive territory and is now rising into positive territory at a value of 3. With momentum in line with the the “Go” trend but not yet overbought perhaps there is room to run.
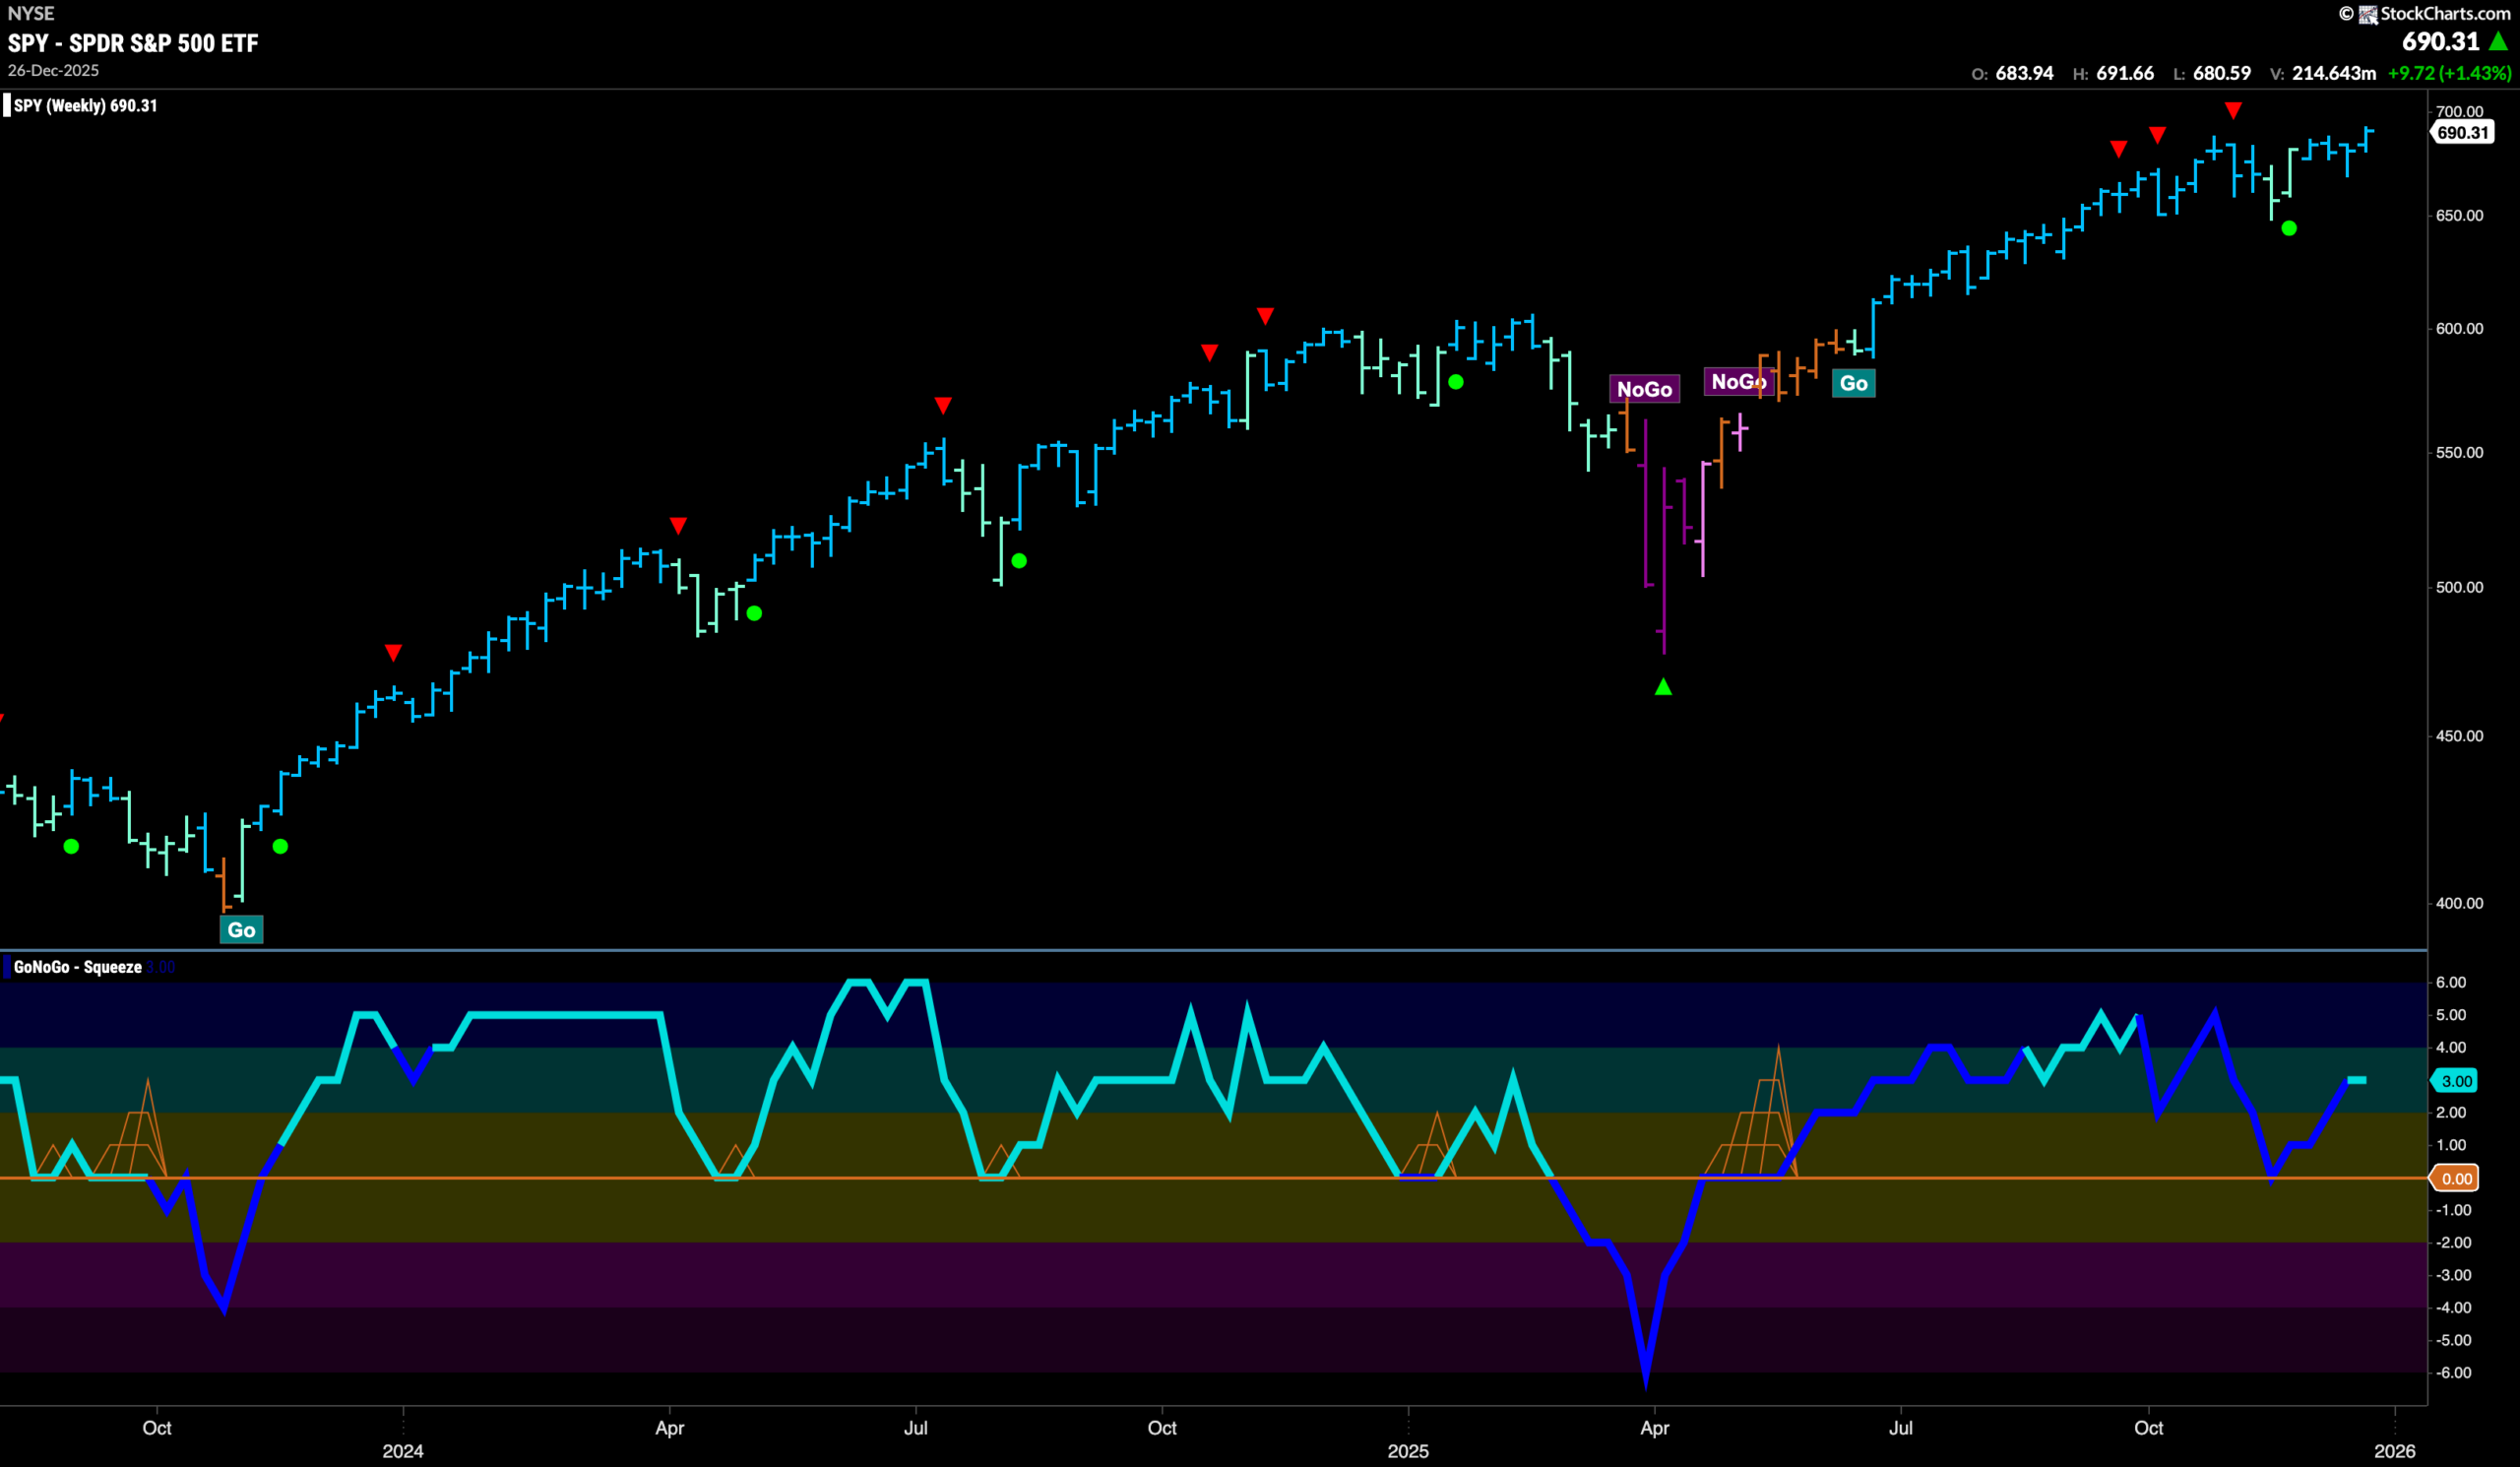
The weekly chart shows that on the longer time frame the trend has remained strong for another week. We saw a higher weekly close sending price to a new higher high. This makes for the 4th consecutive strong blue bar after the couple of bars of weakness we saw a month ago. GoNoGo Oscillator has rallied off the zero line on heavy volume and we see momentum now at a value of 3. This tells us that momentum is confirming the “Go” trend but is not yet overbought.
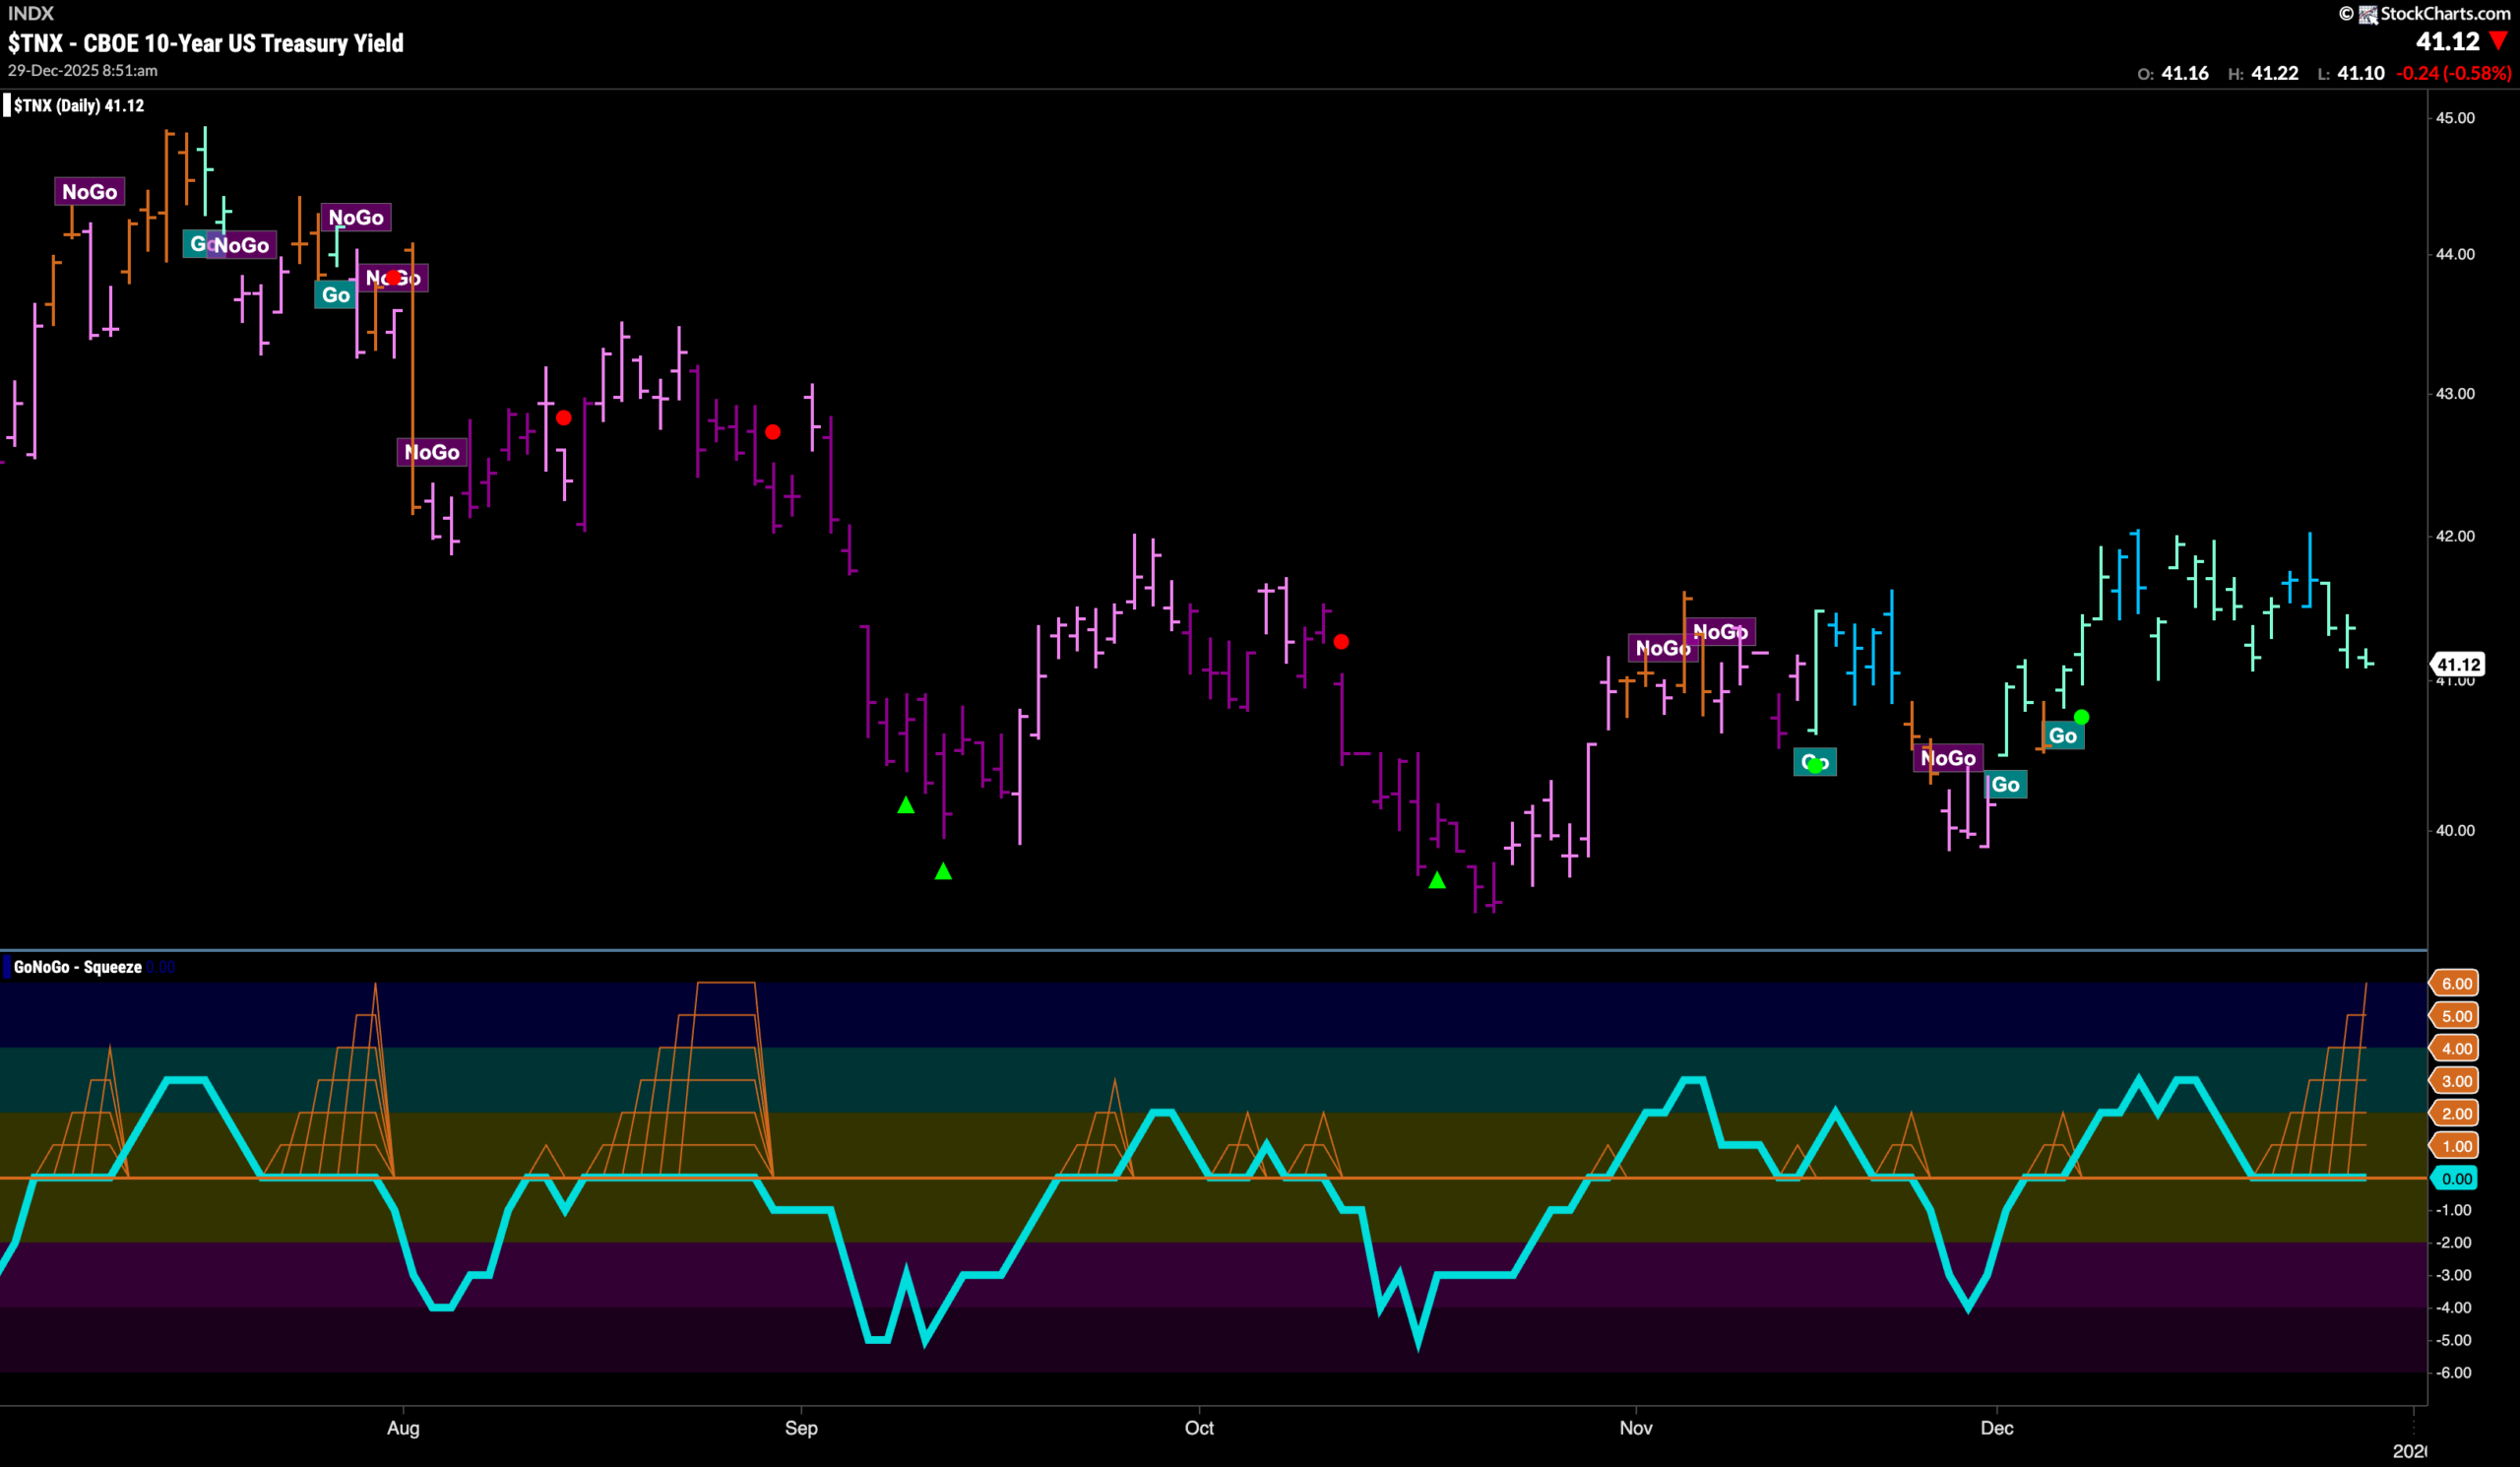
Treasury Rates Fail to Make New High
GoNoGo Trend shows the trend continues this week but we saw that rates failed to make new highs last week and indeed fell back after failing to break to new highs. After failing at those levels, we saw GoNoGo Trend paint weaker aqua bars as rates struggles to hang on to the trend. When we turn our eyes to the lower panel, we see that GoNoGo Oscillator fell to test the zero line a week ago and has been riding that level since. This has caused a Max GoNoGo Squeeze and it will be important to note the direction of the next break.
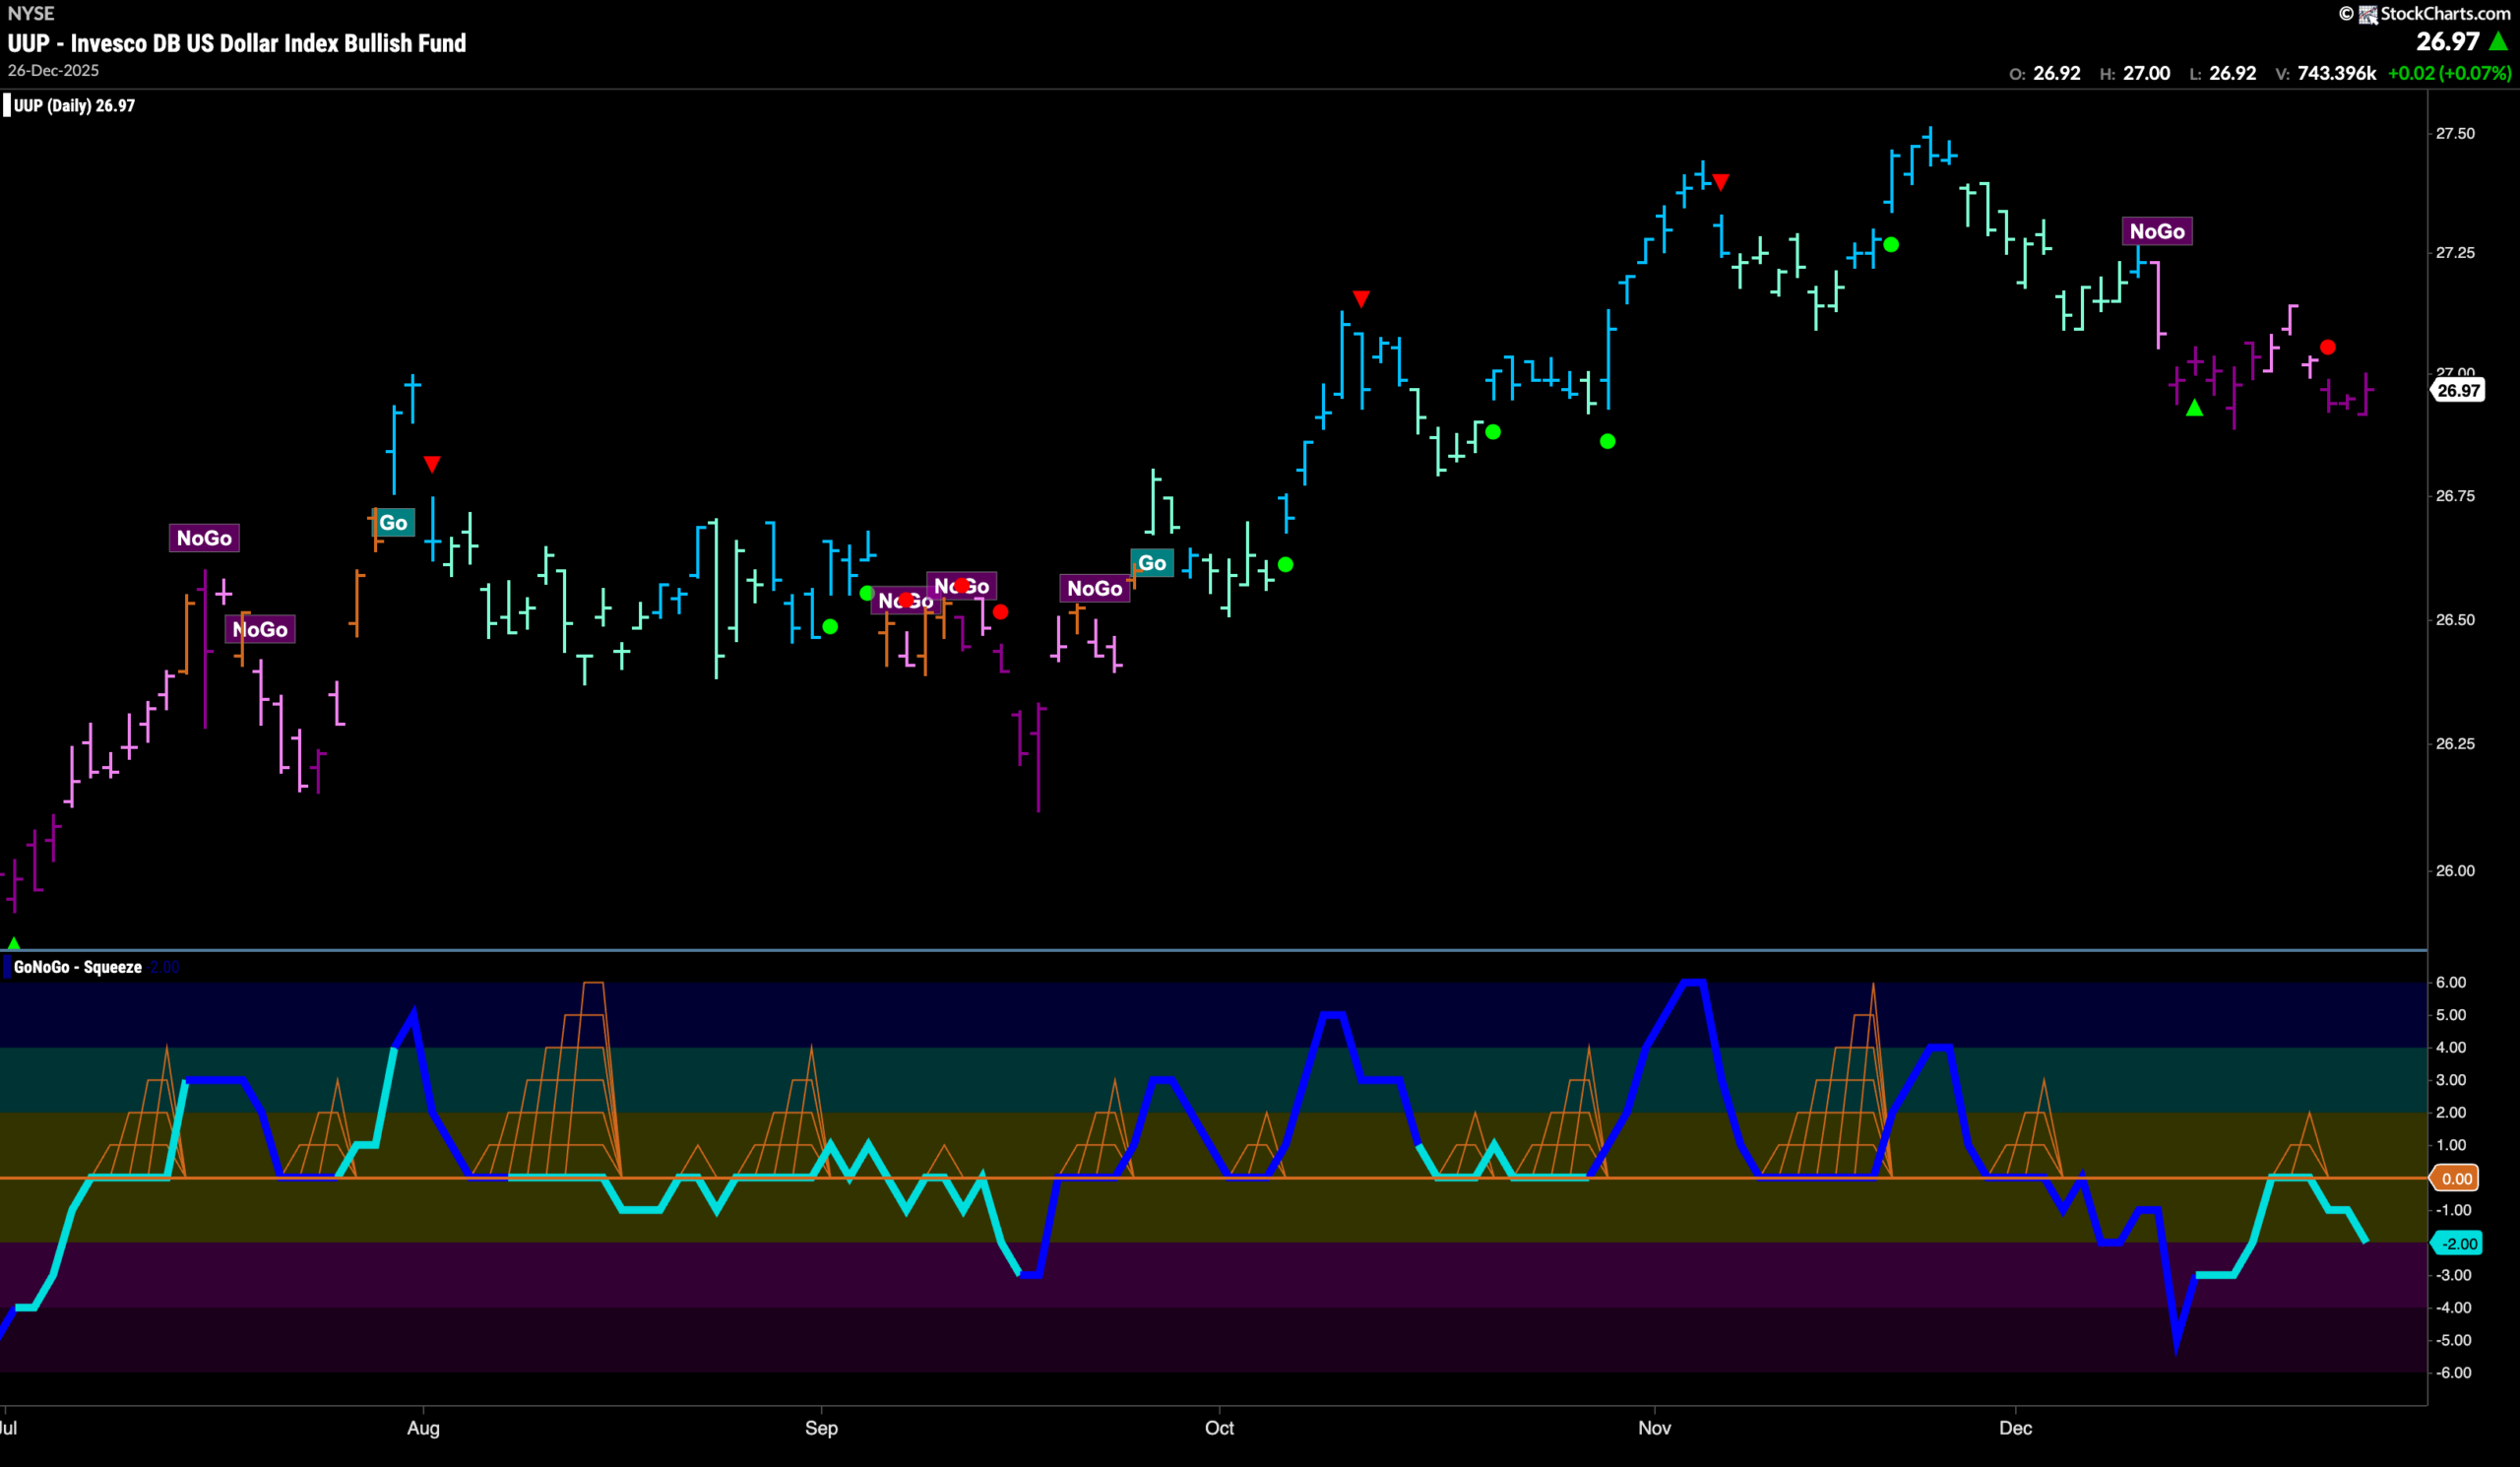
Dollar In Strong “NoGo” After Lower High
The chart below shows that the dollar continues to paint “NoGo” bars and last week the indicator painted strong purple bars as the week progressed and price fell to test prior lows. GoNoGo Oscillator rose to test the zero line but was turned away last week and is falling back into negative territory. With GoNoGo Trend painting strong purple “NoGo” bars and GoNoGo Oscillator in line with the trend at a value of -3 we will watch to see if the dollar falls to a new low in the coming days.
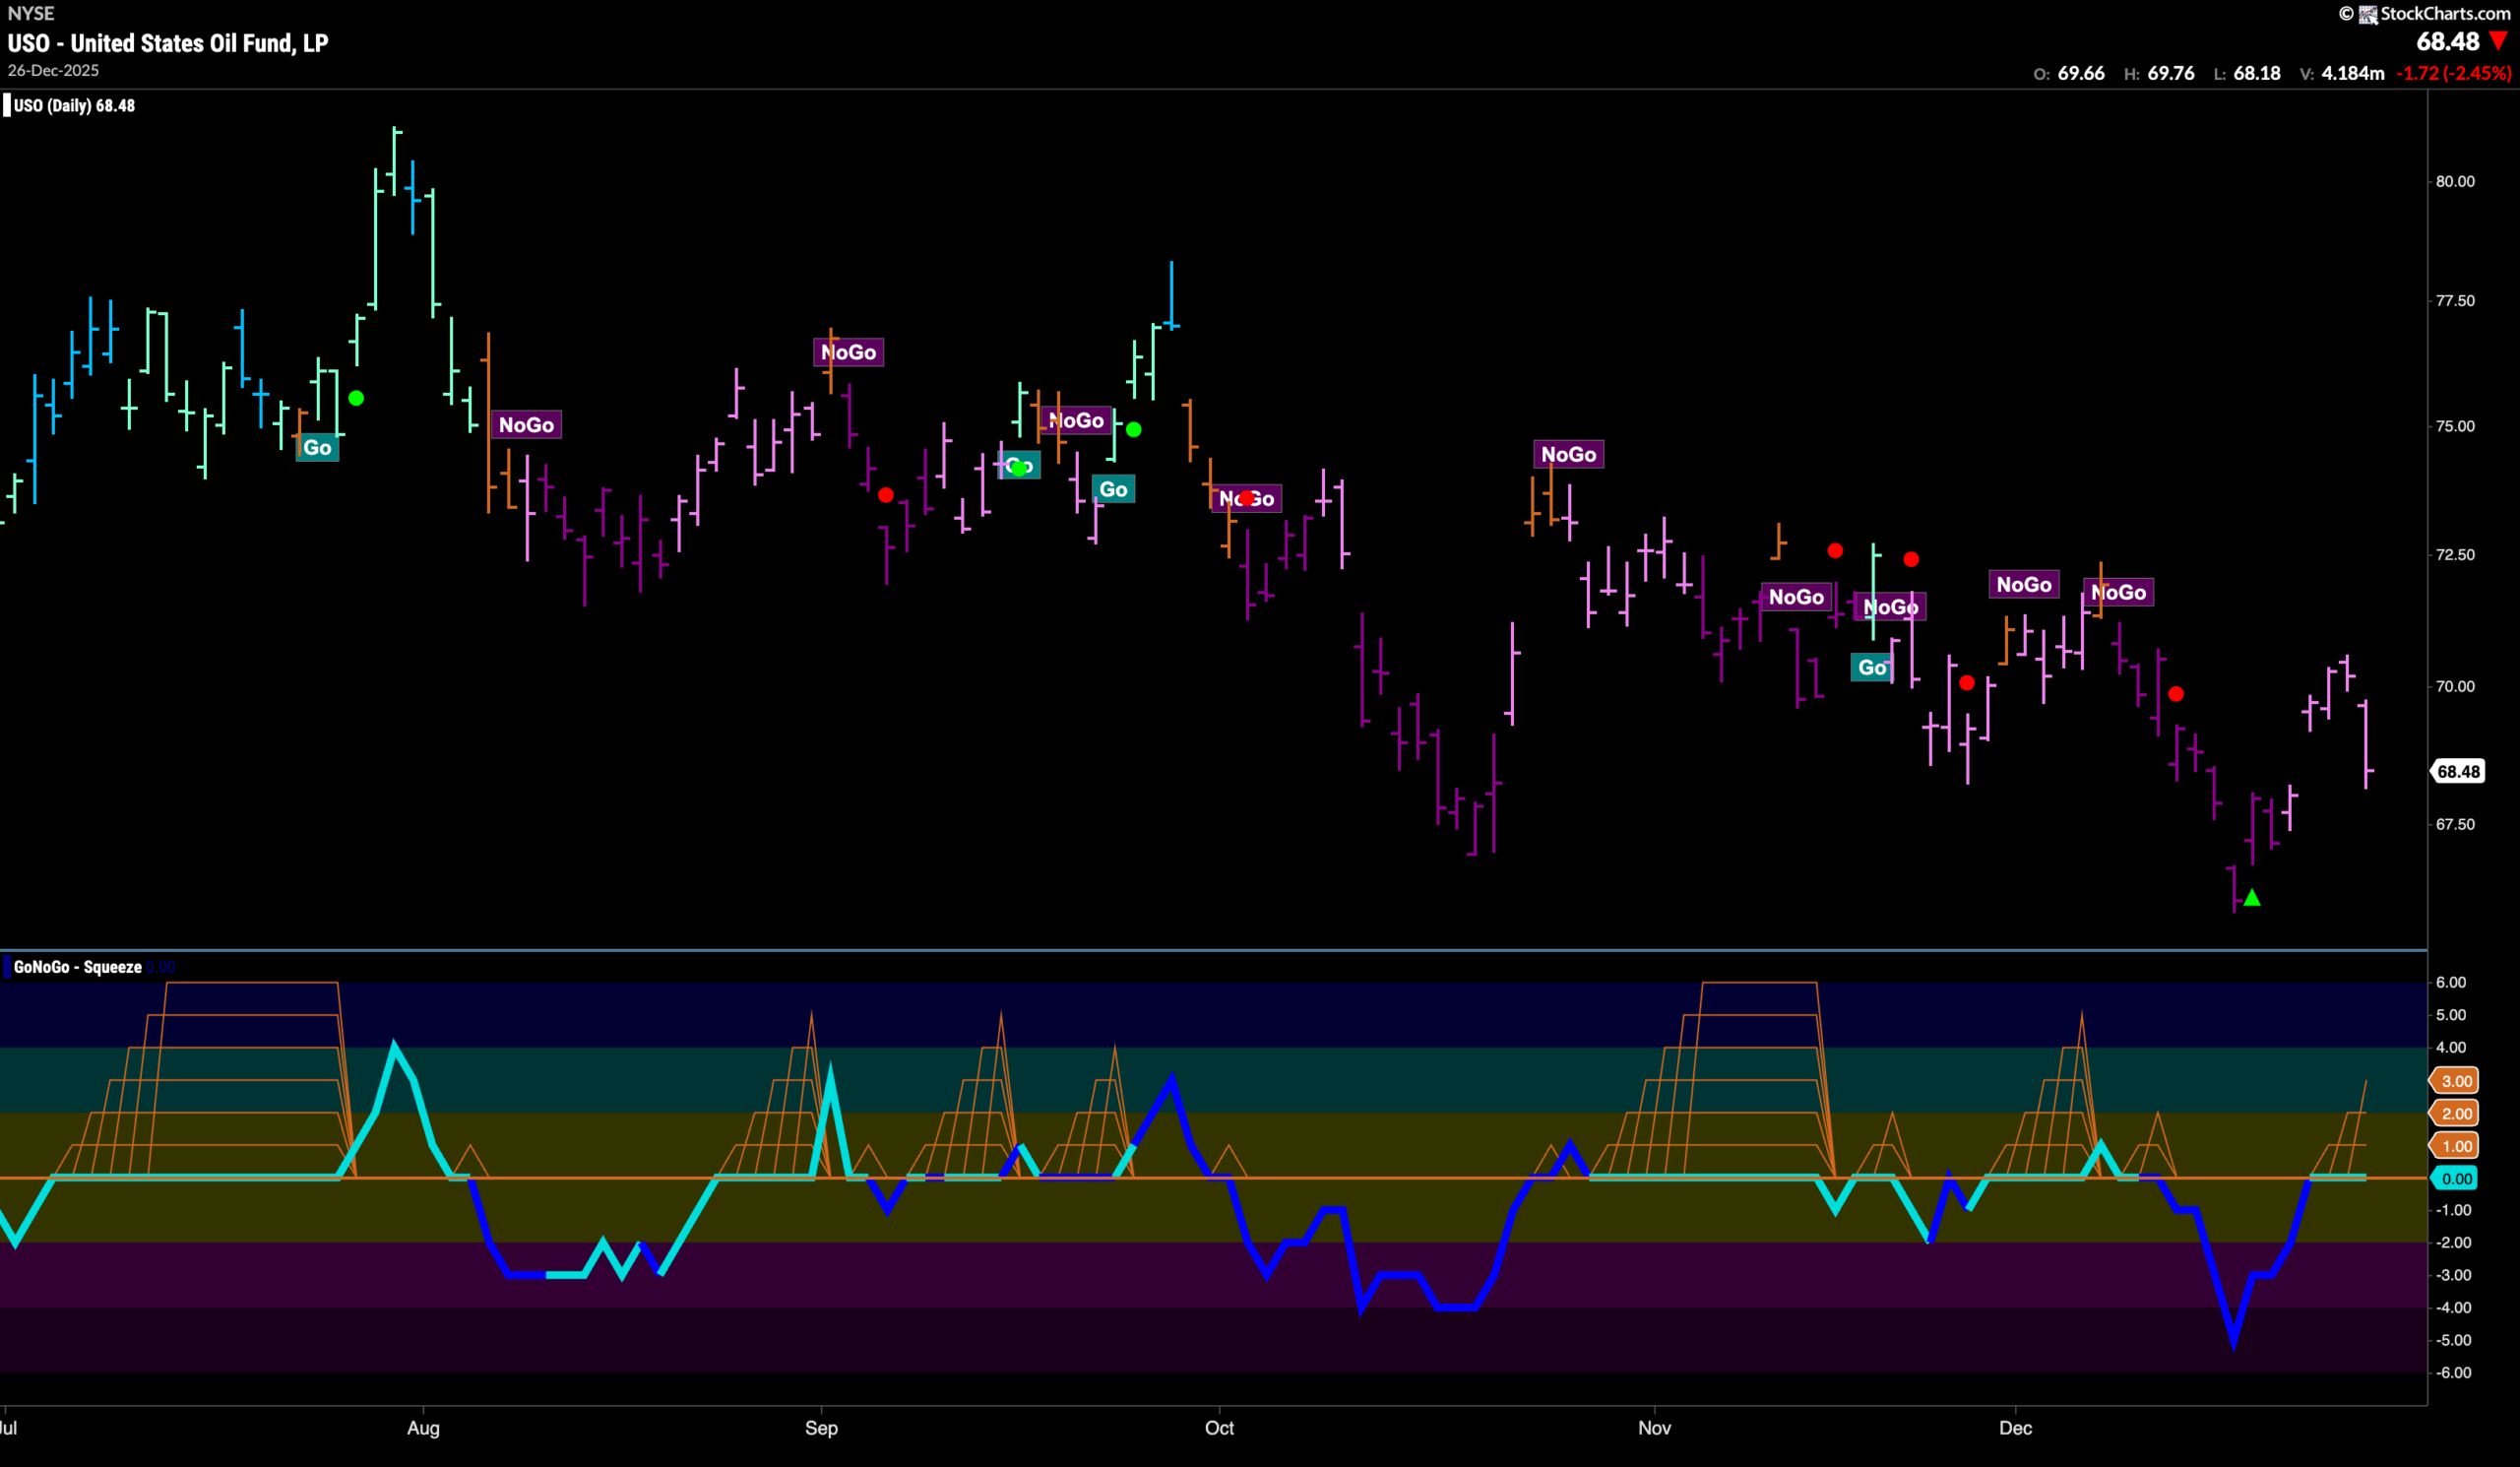
Oil Remains in “NoGo” but Paints Weakness
GoNoGo Trend shows that the trend continues and price made a lower high this week on pink “NoGo” bars. GoNoGo Oscillator is currently testing the zero line from below and we see the beginnings of a GoNoGo Squeeze forming. We will watch closely this week to see if the oscillator gets rejected by the zero line and if it does we will expect more downside pressure on price. Falling momentum inline with the “NoGo” trend could push price to challenge for new lower lows.
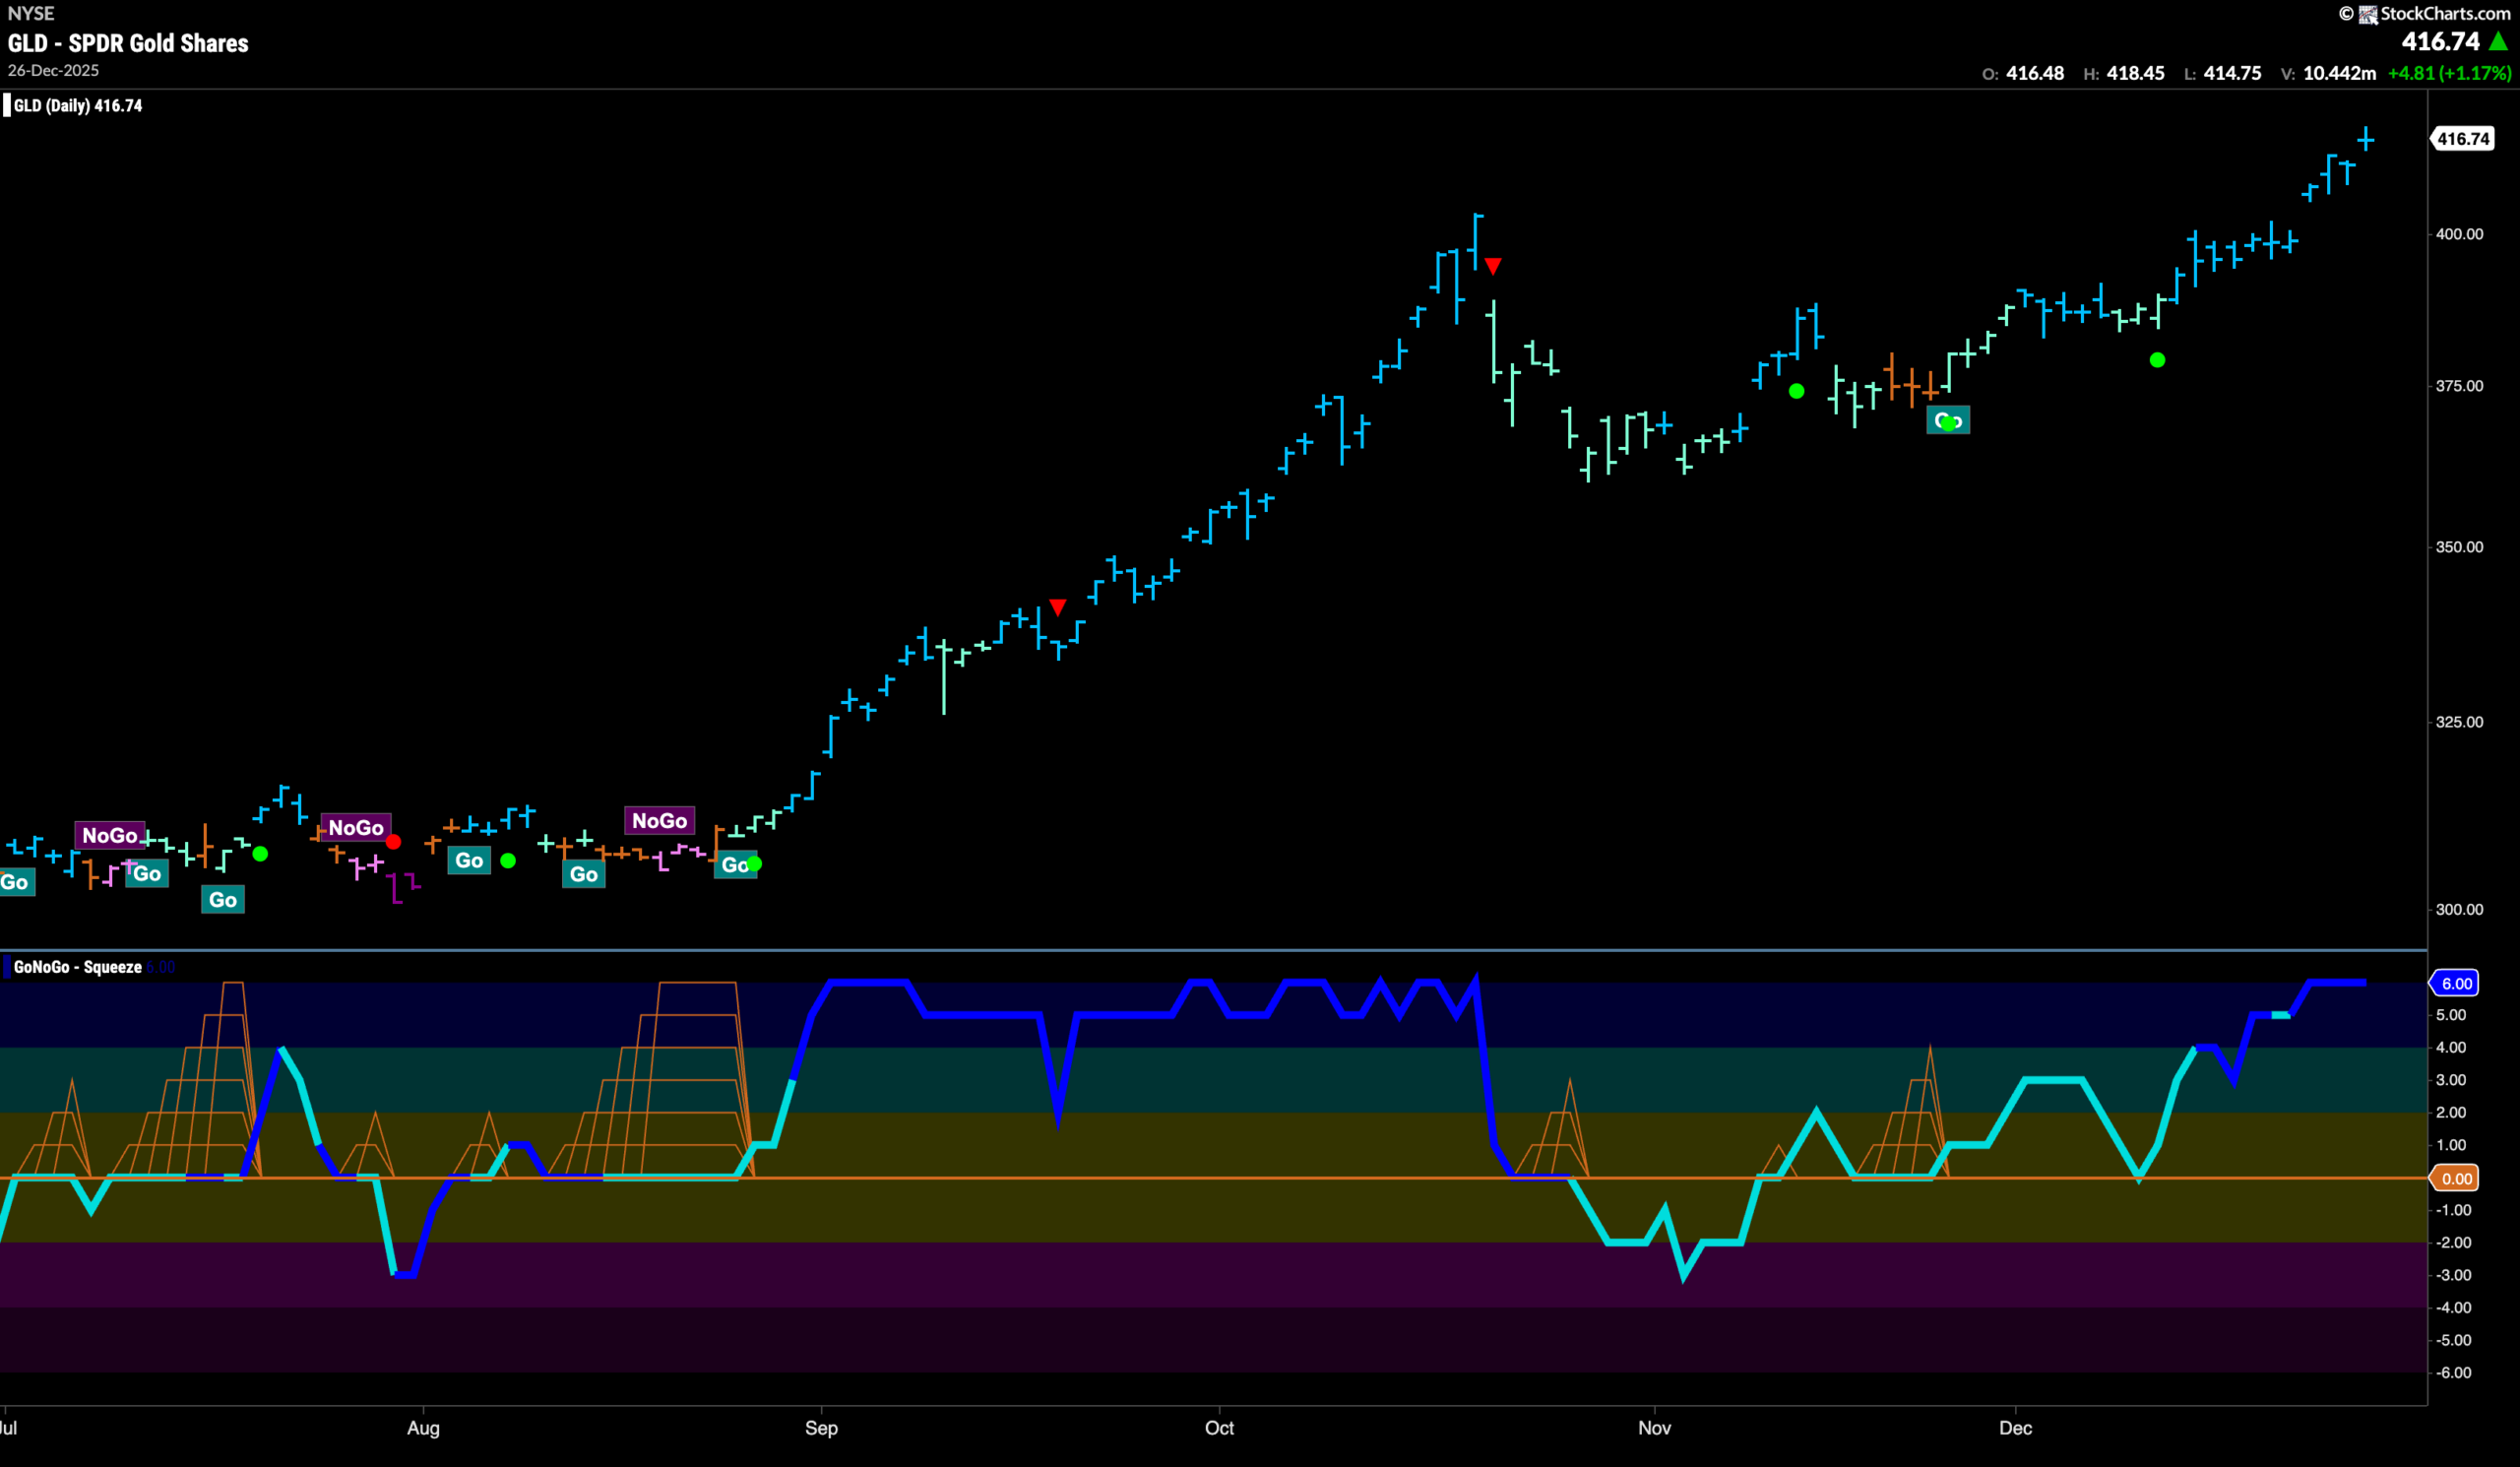
Gold “Go” Trend Soars to New Higher Highs On Strong “Go” Bars
The trend in Gold continued last wek and we saw that price raced higher after bursting to new highs on a gap at the beginning of the week. We have seen nothing but consecutive strong “Go” bars now for several weeks and we have the market get behind the trend with strong momentum as GoNoGo Oscillator has risen through positive territory and is now overbought at a value of 6. We will watch to see if price can consolidate at these elevated levels this week.
Sector RelMap
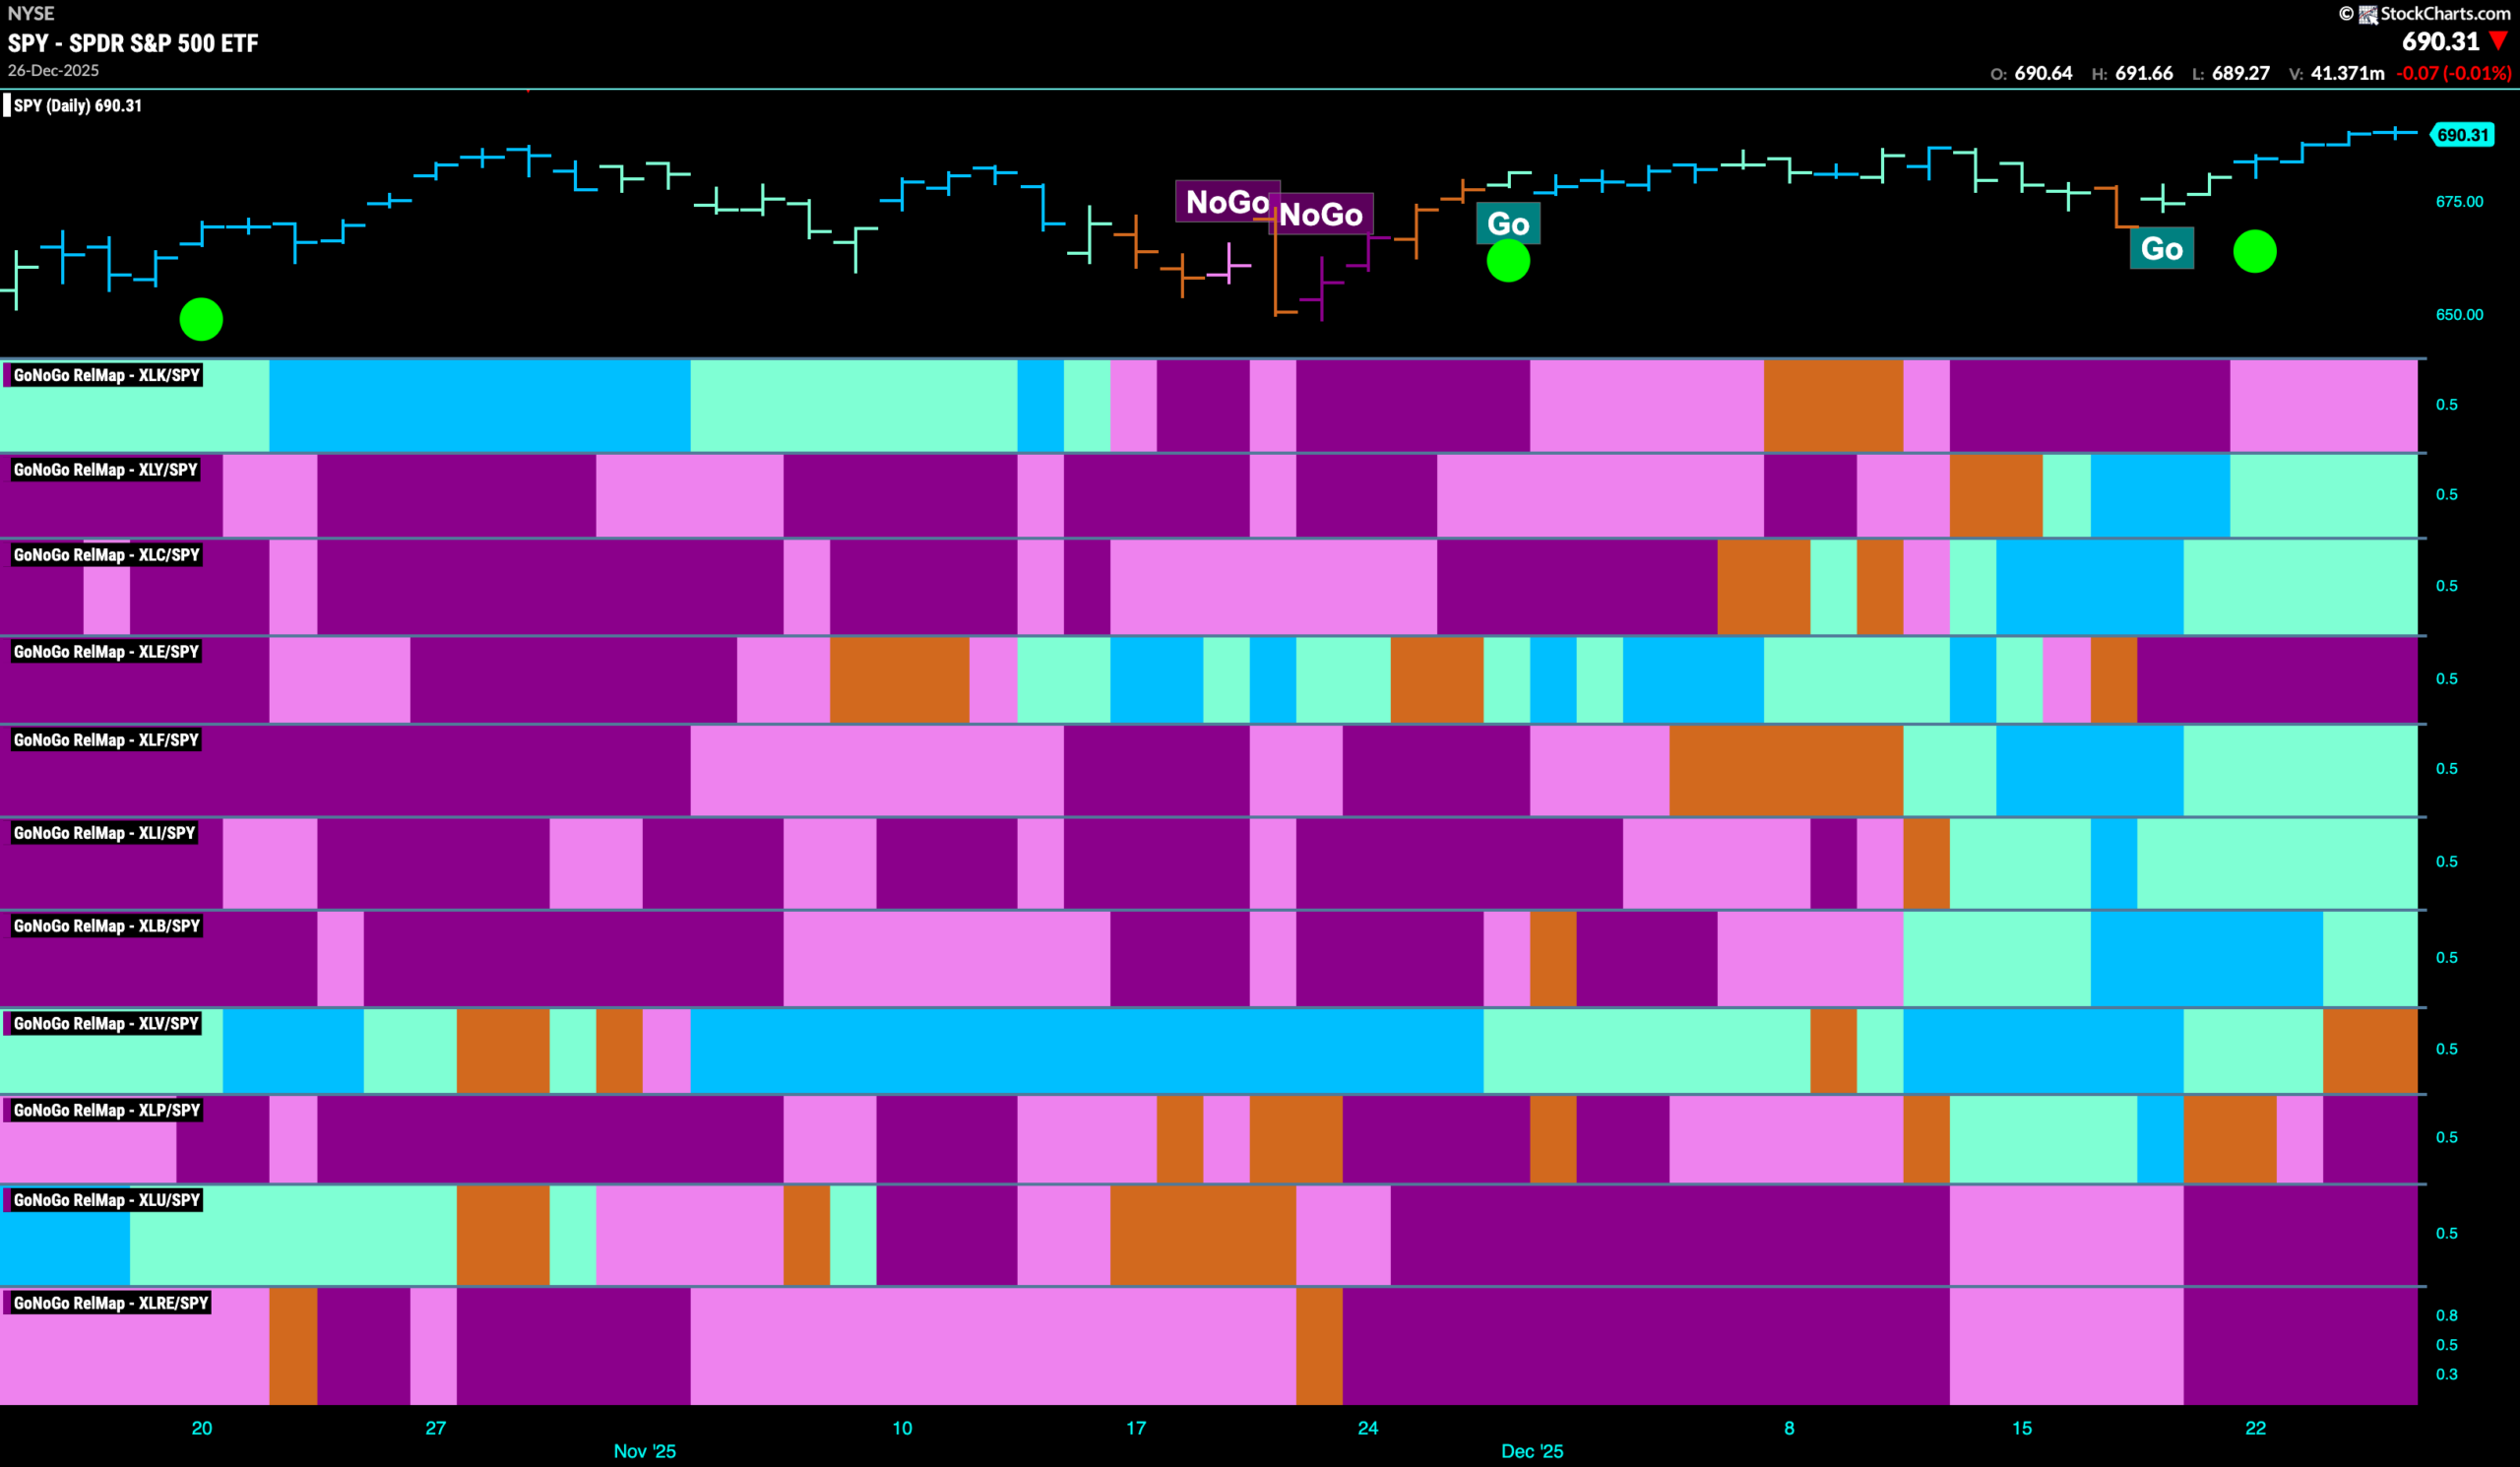
Below is the GoNoGo Sector RelMap. This GoNoGo RelMap applies the GoNoGo Trend to the relative strength ratios of the sectors to the base index. With this view we can get a sense of the relative out performance and relative underperformance of the sectors. 5 sectors are in relative “Go” trends. $XLY, $XLC, $XLF, $XLI, and $XLB are painting relative “Go” bars.
Communications Sub-Group RelMap
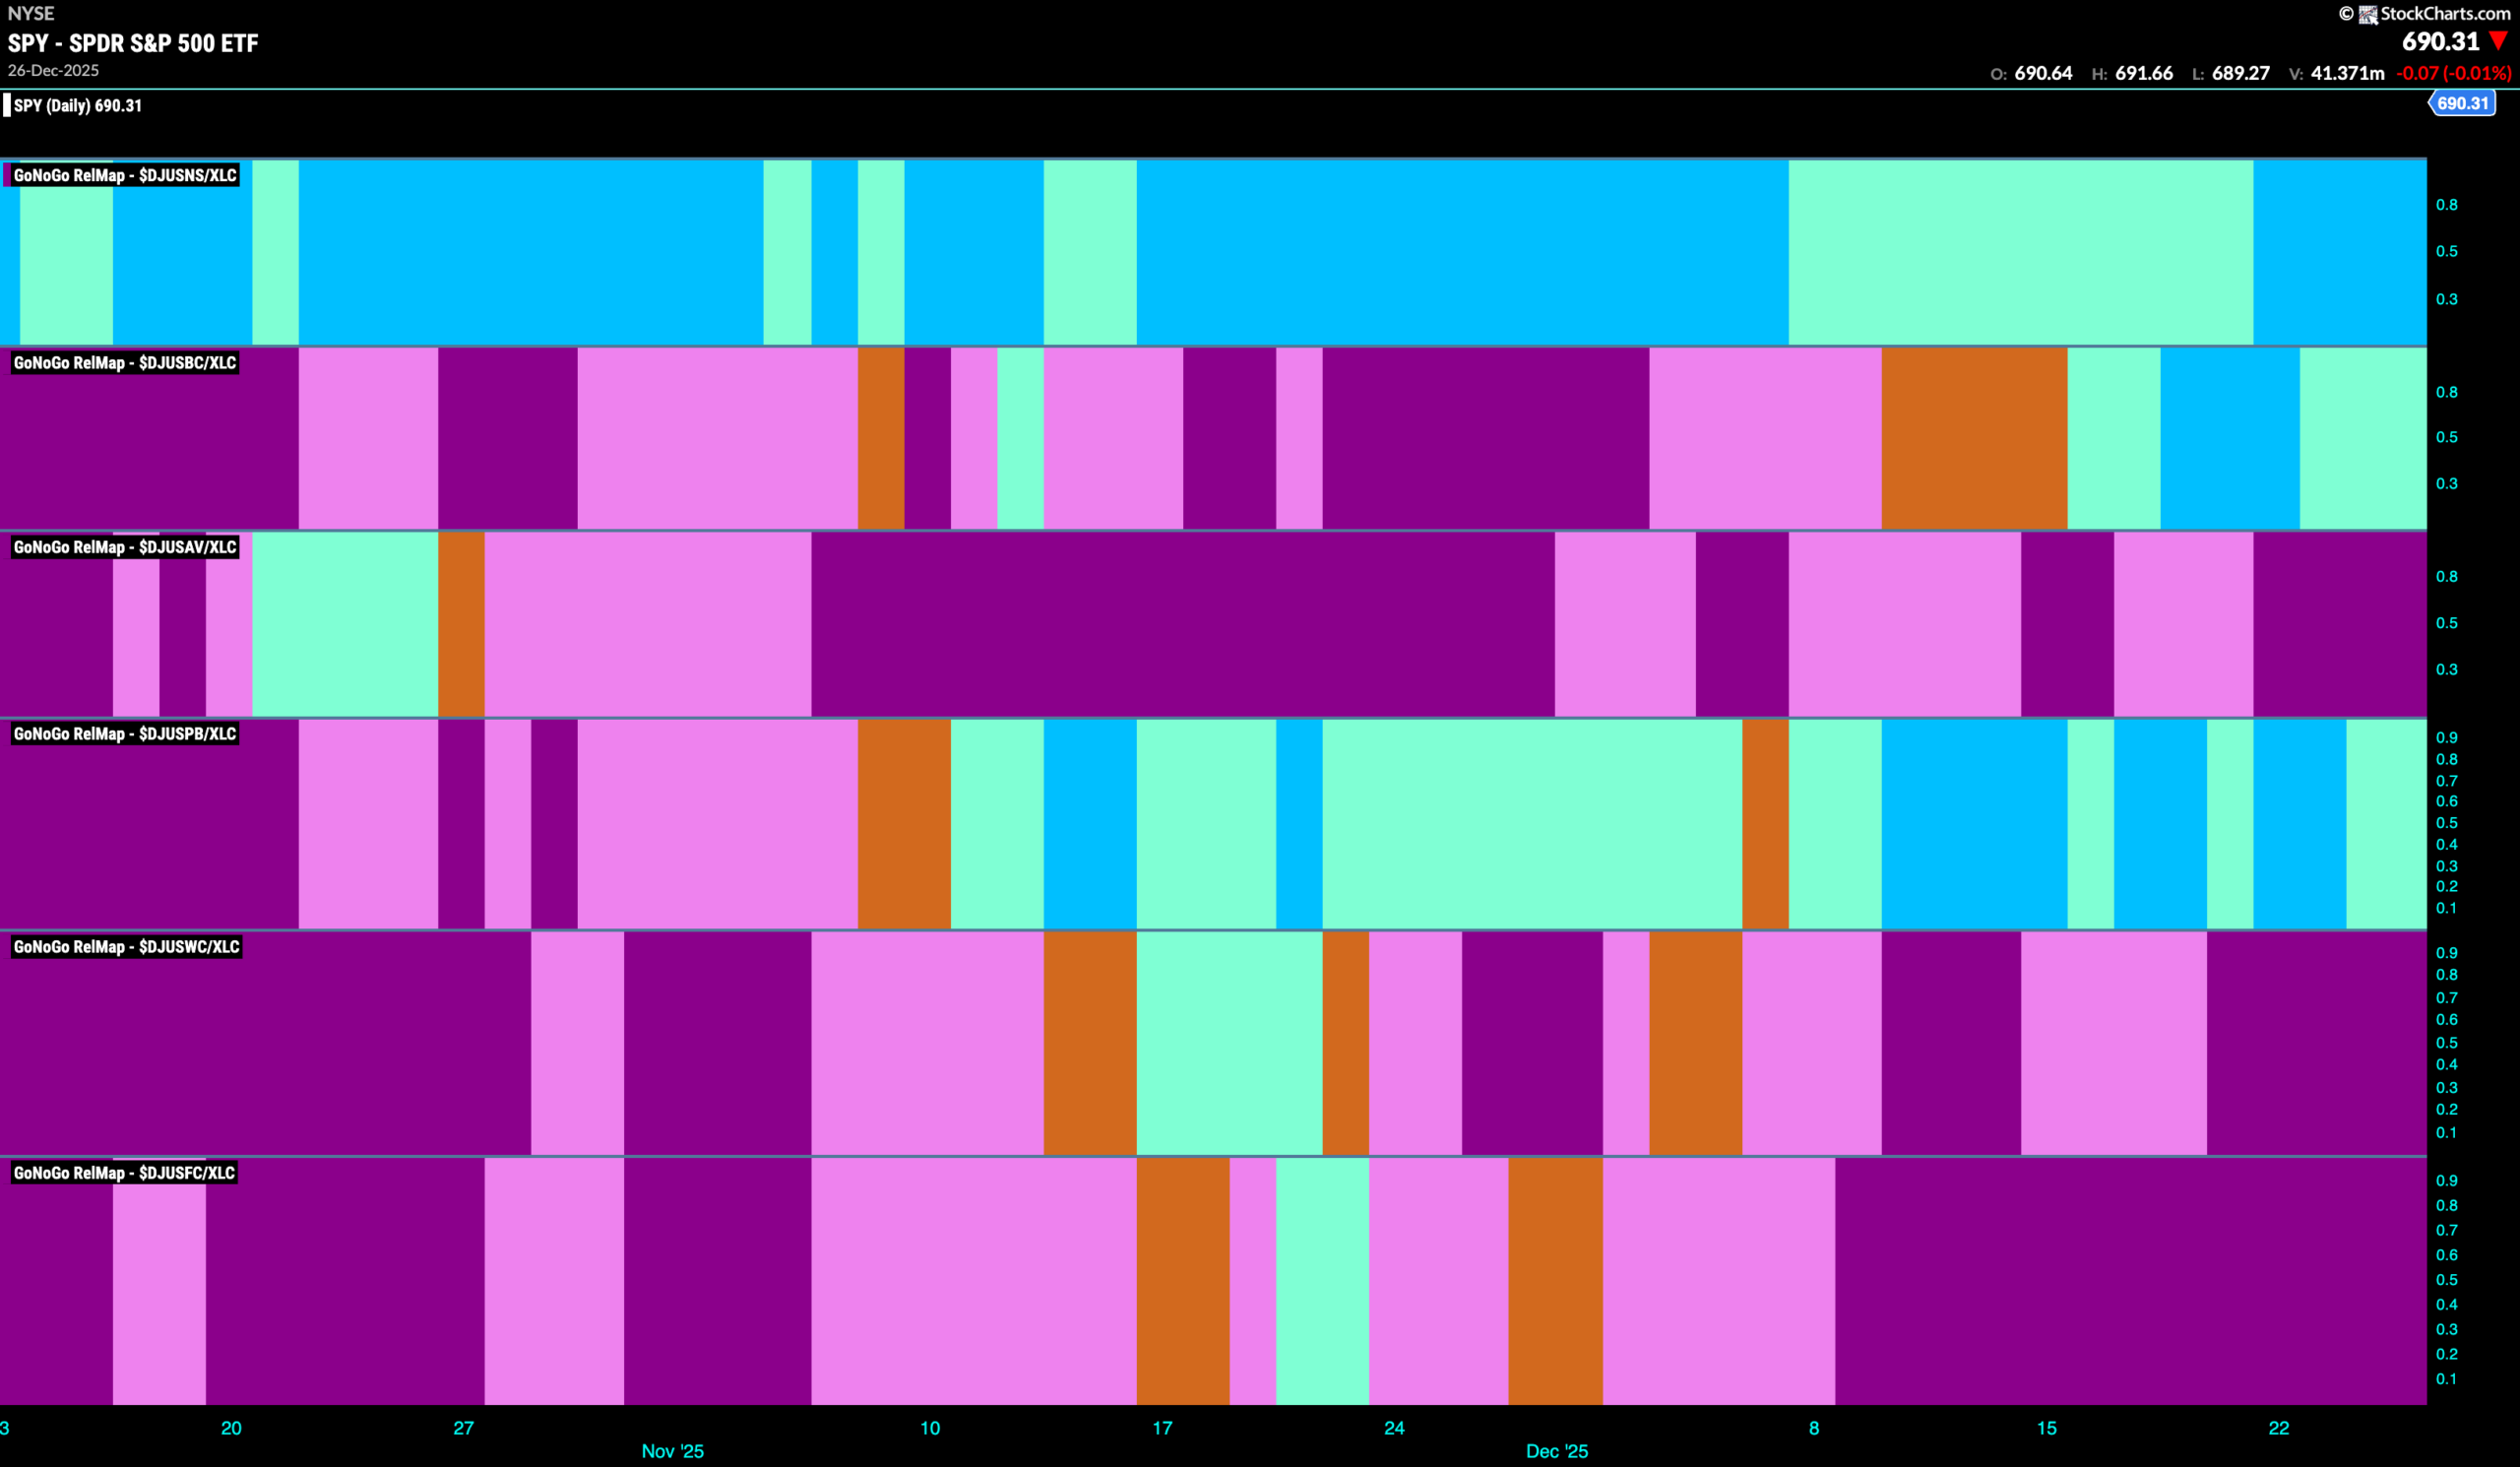
The chart below shows a relative trend breakdown of the sub groups within the communications sector this week. The Sub-Group RelMap plots the GoNoGo Trend of each sub index to the $XLC. We saw in the above GoNoGo Sector RelMap that $XLC is an out-performing sector and paints aqua relative “Go” bars. When we look at the below RelMap we can see that the internet index in the top panel is painting strong blue “Go” bars on a relative basis.
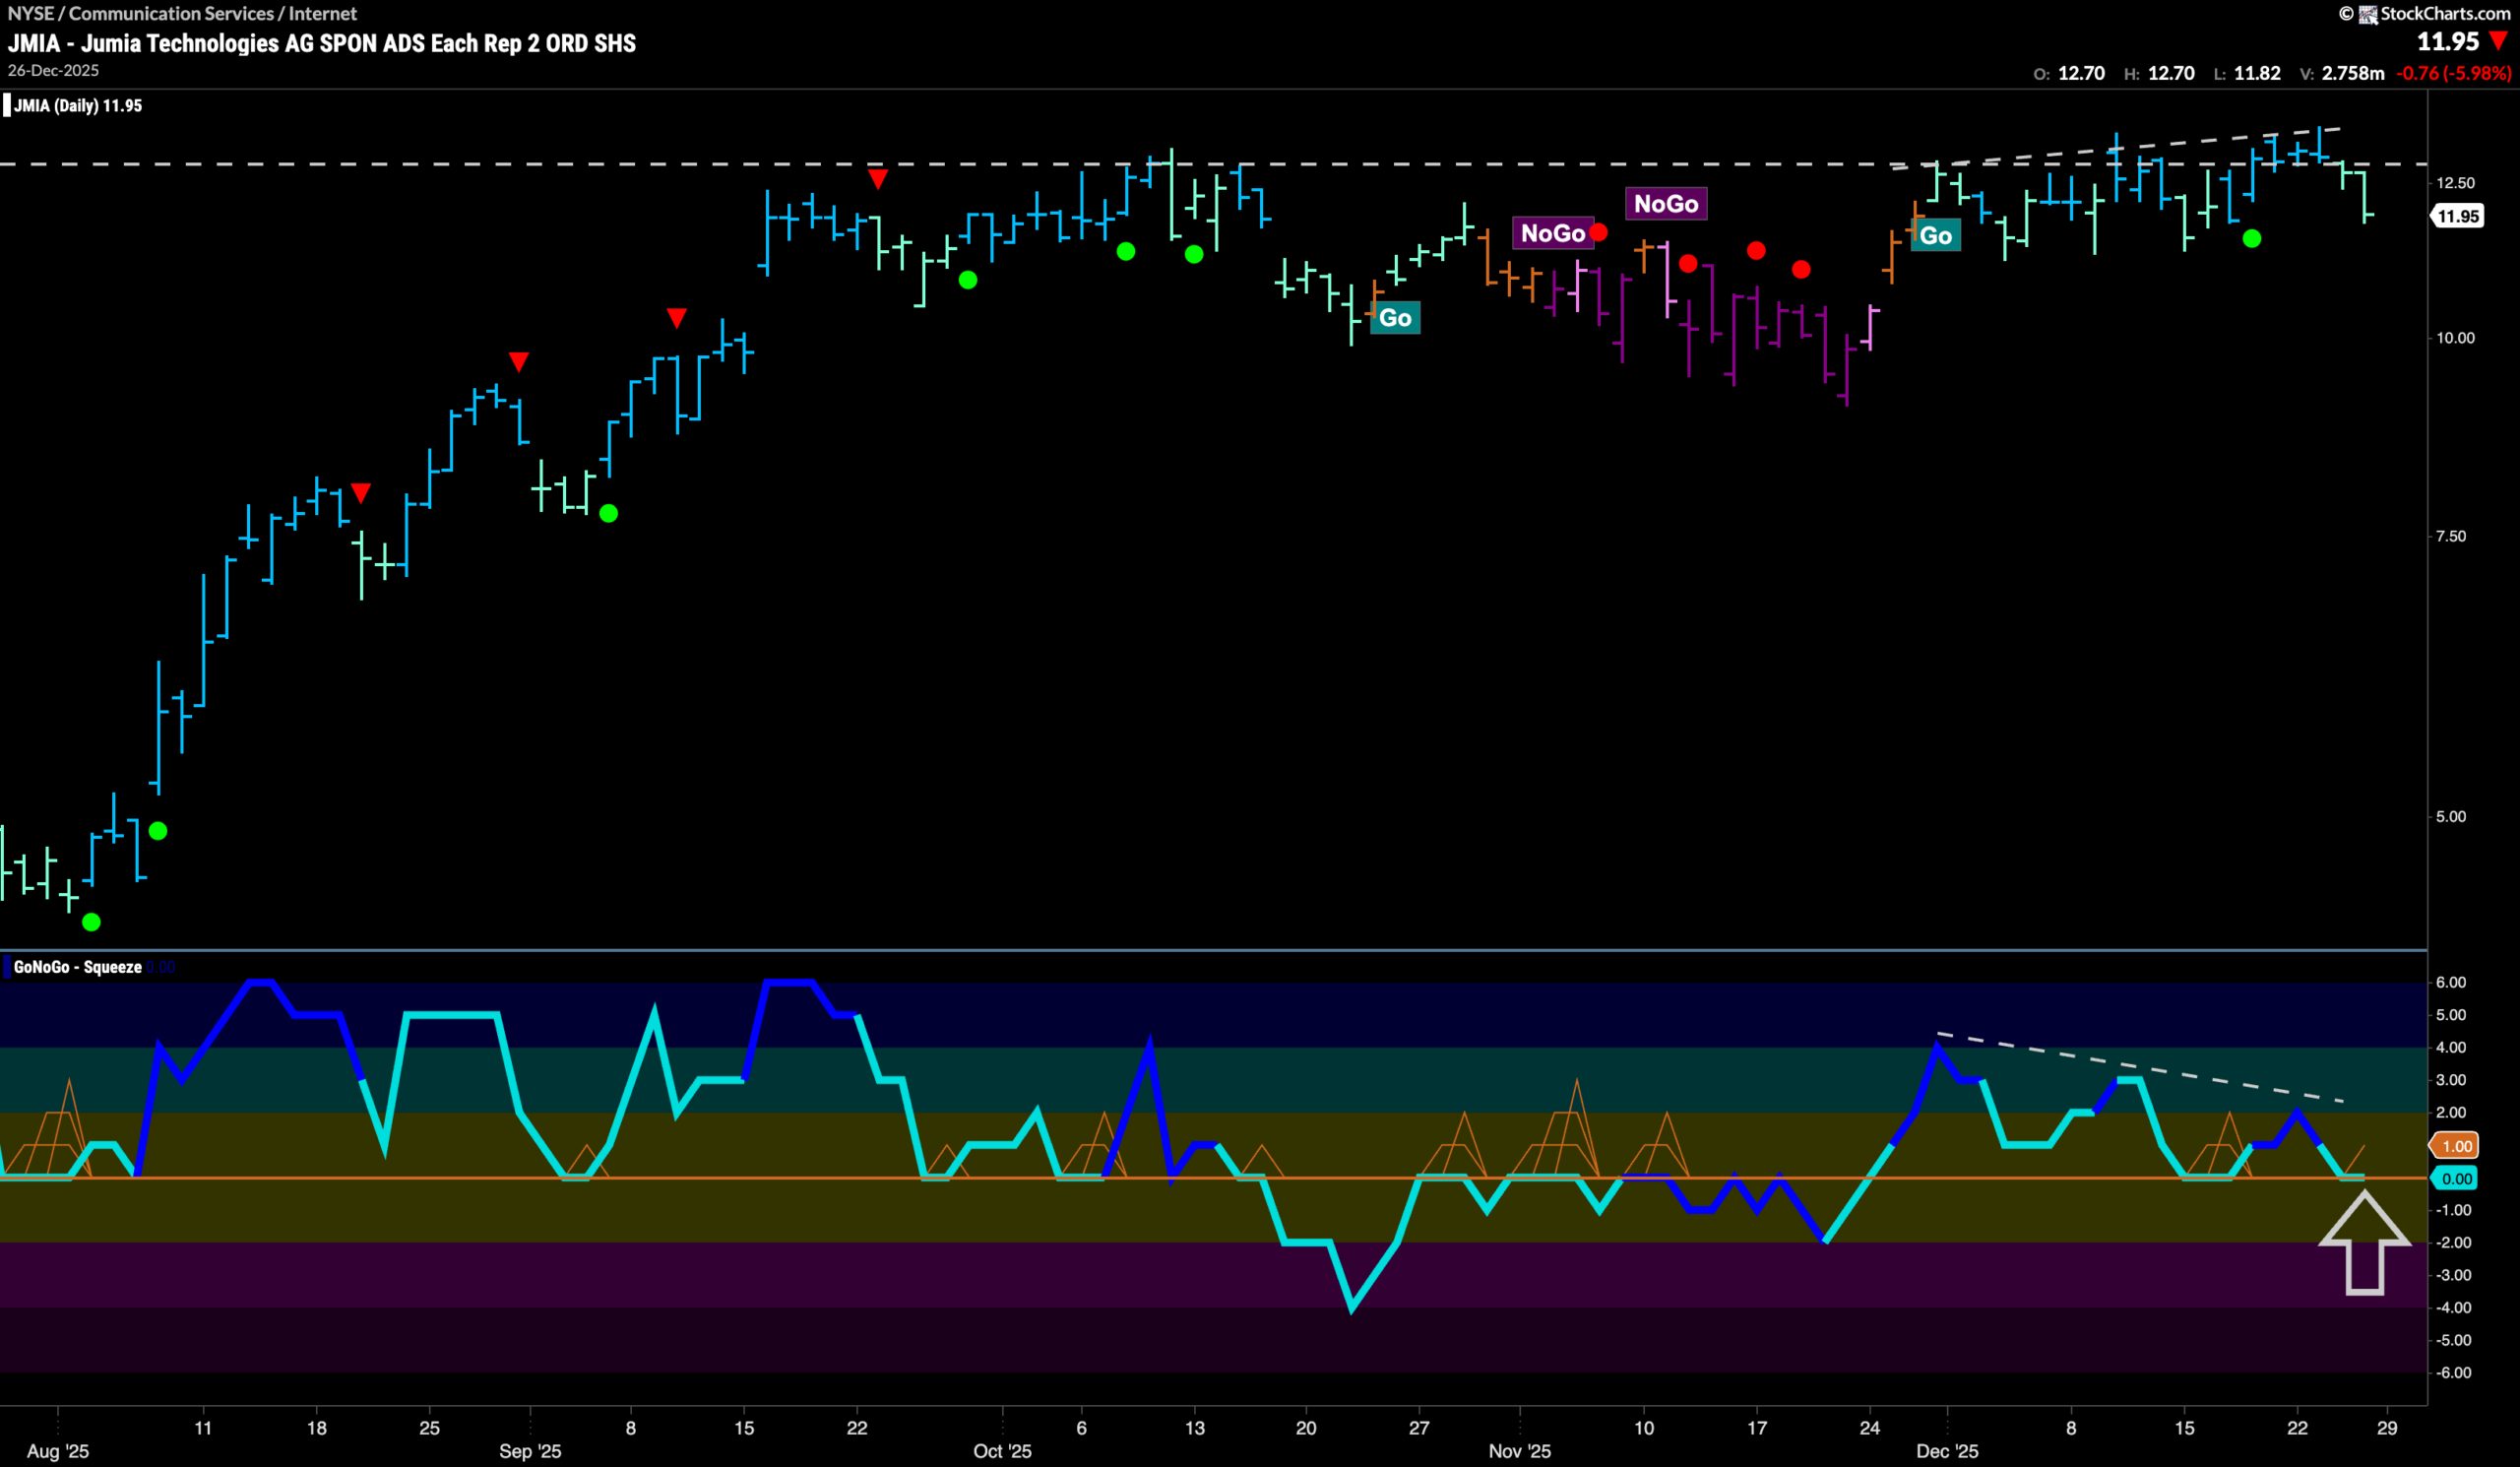
$JMIA Struggles with Overhead Resistance
GoNoGo Trend shows that $JMIA is in a “Go” trend but it has a lot of overhead resistance to navigate if it wants to break higher. We have seen price try to creep to new highs over the last several weeks and while it has managed to edge higher we see that it is now trading below the horizontal resistance we see from prior highs on the chart. When we look at the oscillator panel we see momentum divergence as GoNoGo Oscillator has made a series of lower highs as price has edged higher. Now, GoNoGo Oscillator is testing the zero line from above again. It has so far found support at this level and it will be very important that it holds this level again if the “Go” trend is going to continue. If it can regain positive territory, this might give price the push it needs to tackle resistance and clearly set a new higher high.
$UPWK Looks for Support in “Go” Trend
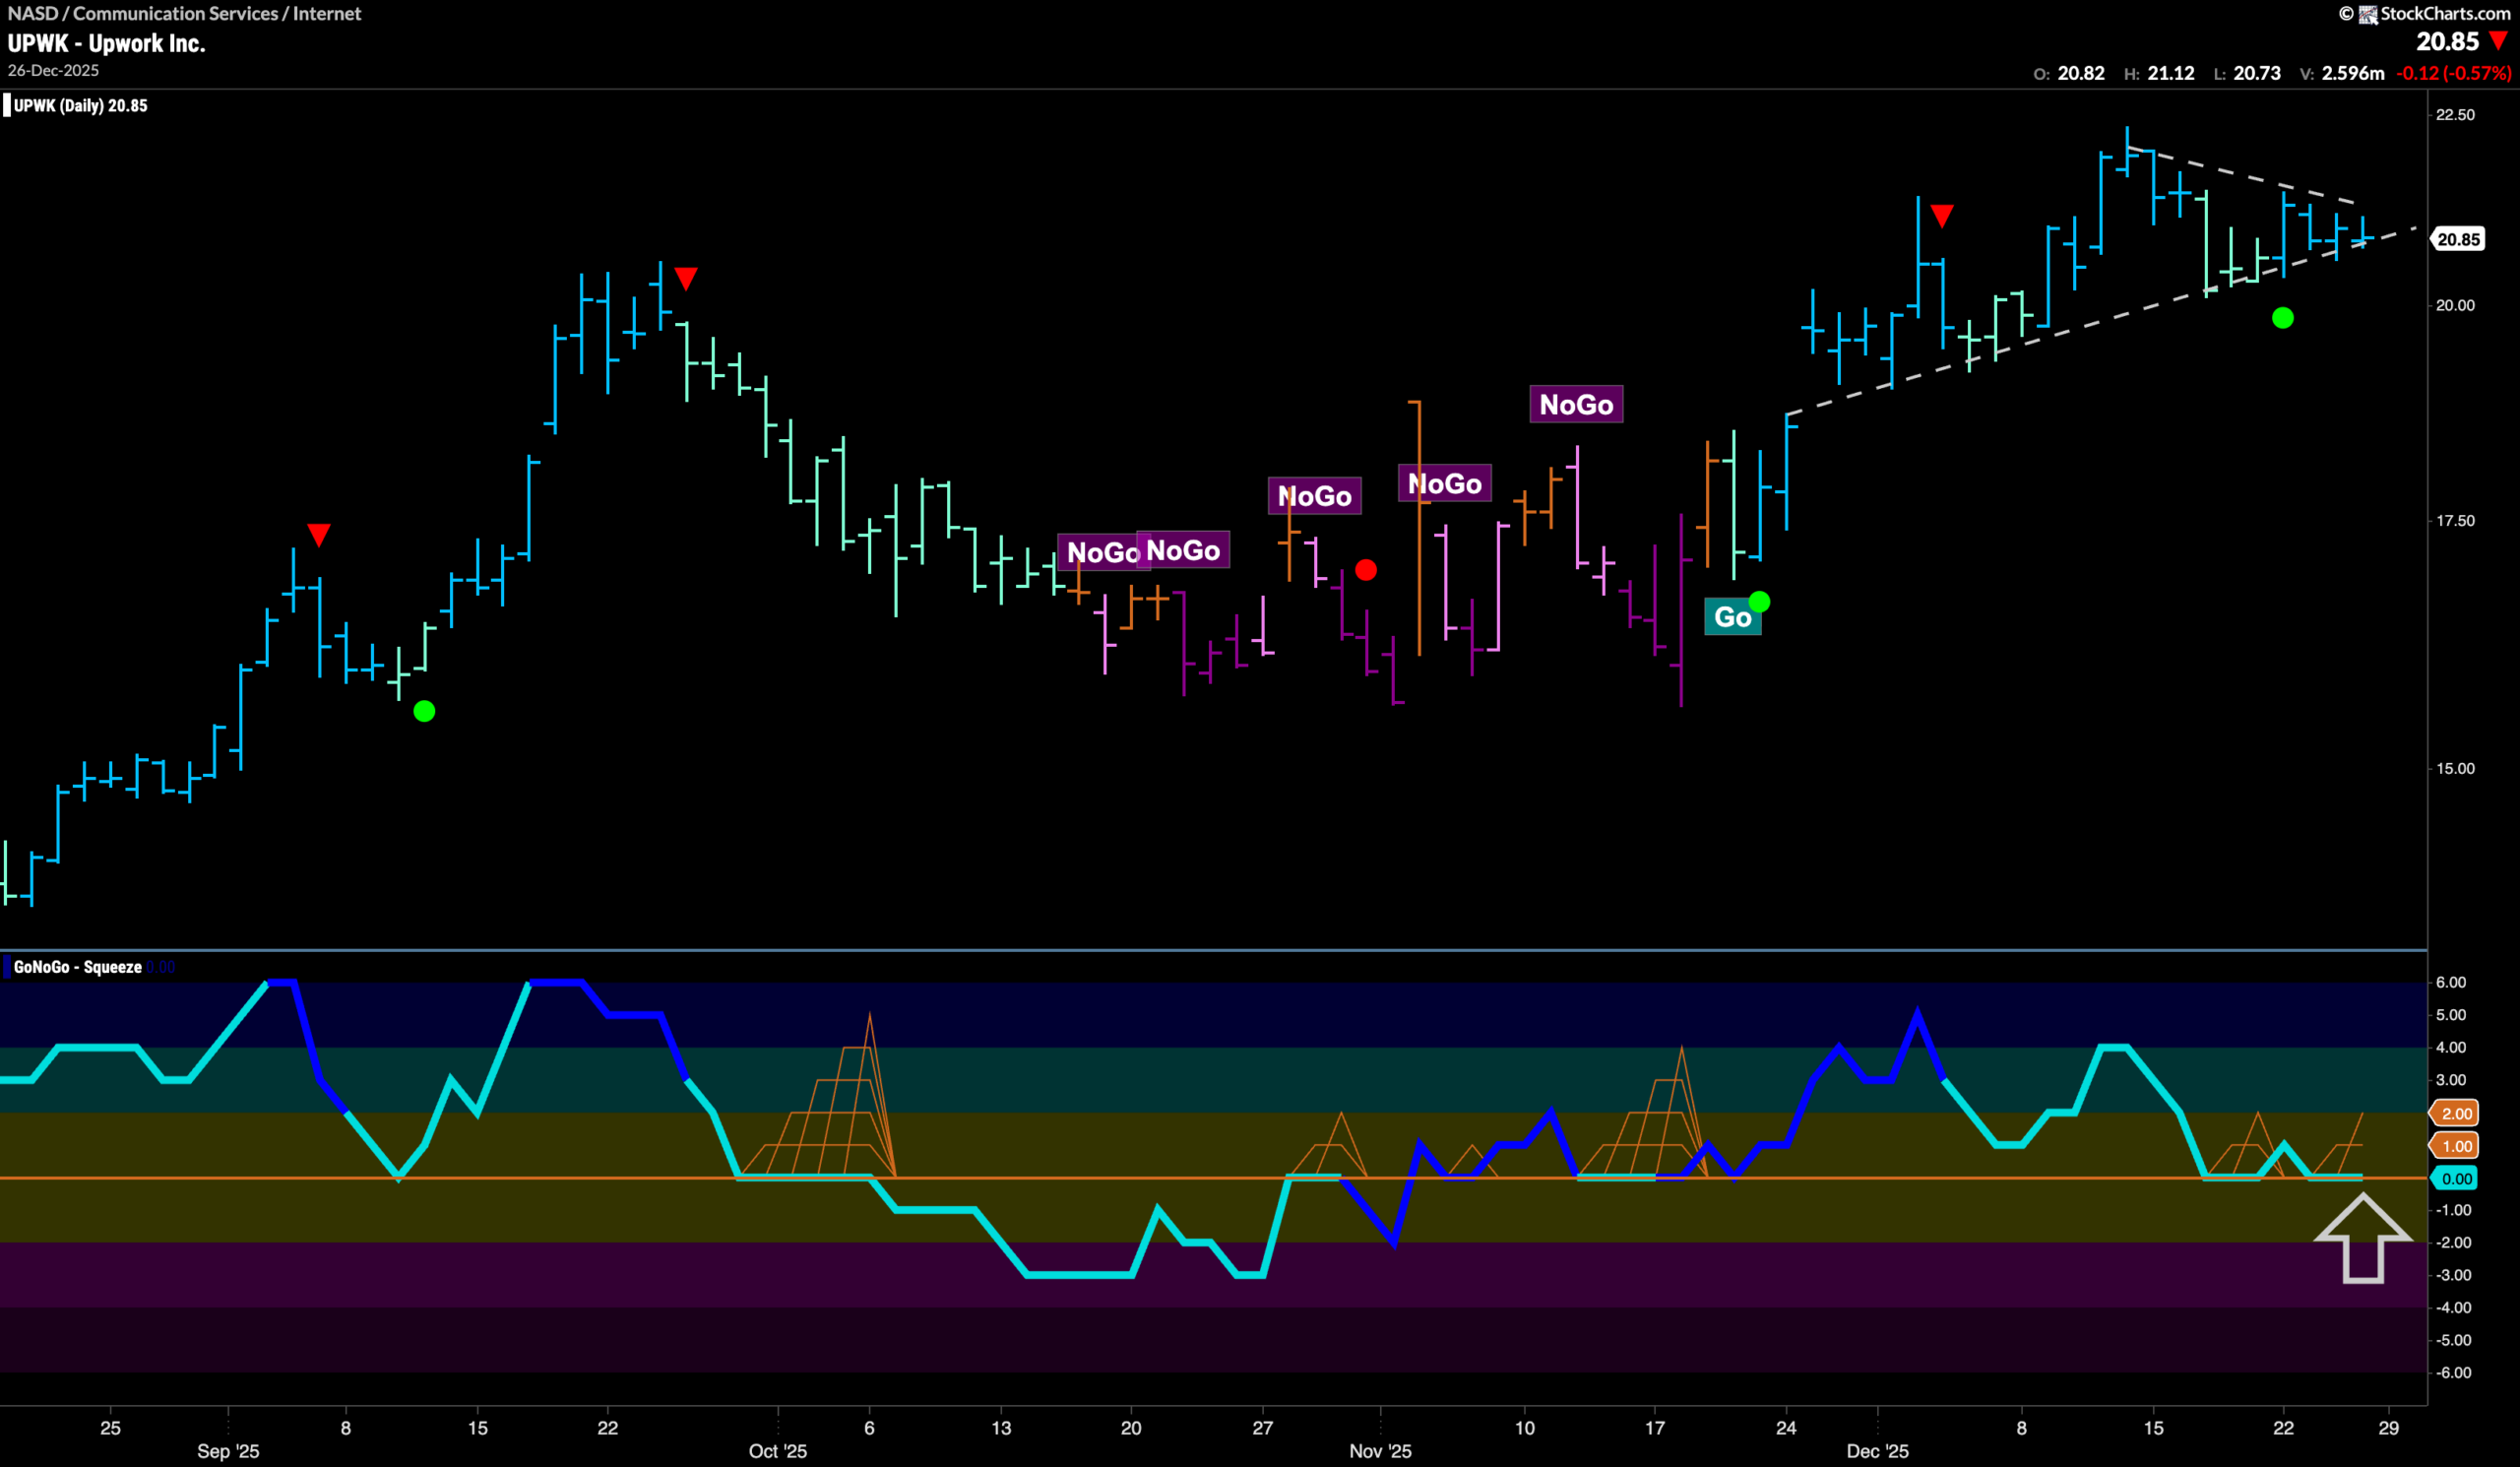
$UPWK has been in a “Go” trend since rallying out of the “NoGo” correction a month ago. Having hit higher highs this month, we see price has fallen and narrowing in range as GoNoGo Oscillator has fallen to test the zero line from above. GoNoGo Oscillator will need to hold this level and climb back into positive territory in order for price to have the momentum to climb in earnest in the coming weeks. If the oscillator bounces off zero, we will see another Go Trend Continuation Icon (green circle) telling us that momentum is resurgent in the direction of the underlying “Go” trend and we will look for price to make an attempt at a new higher high.