
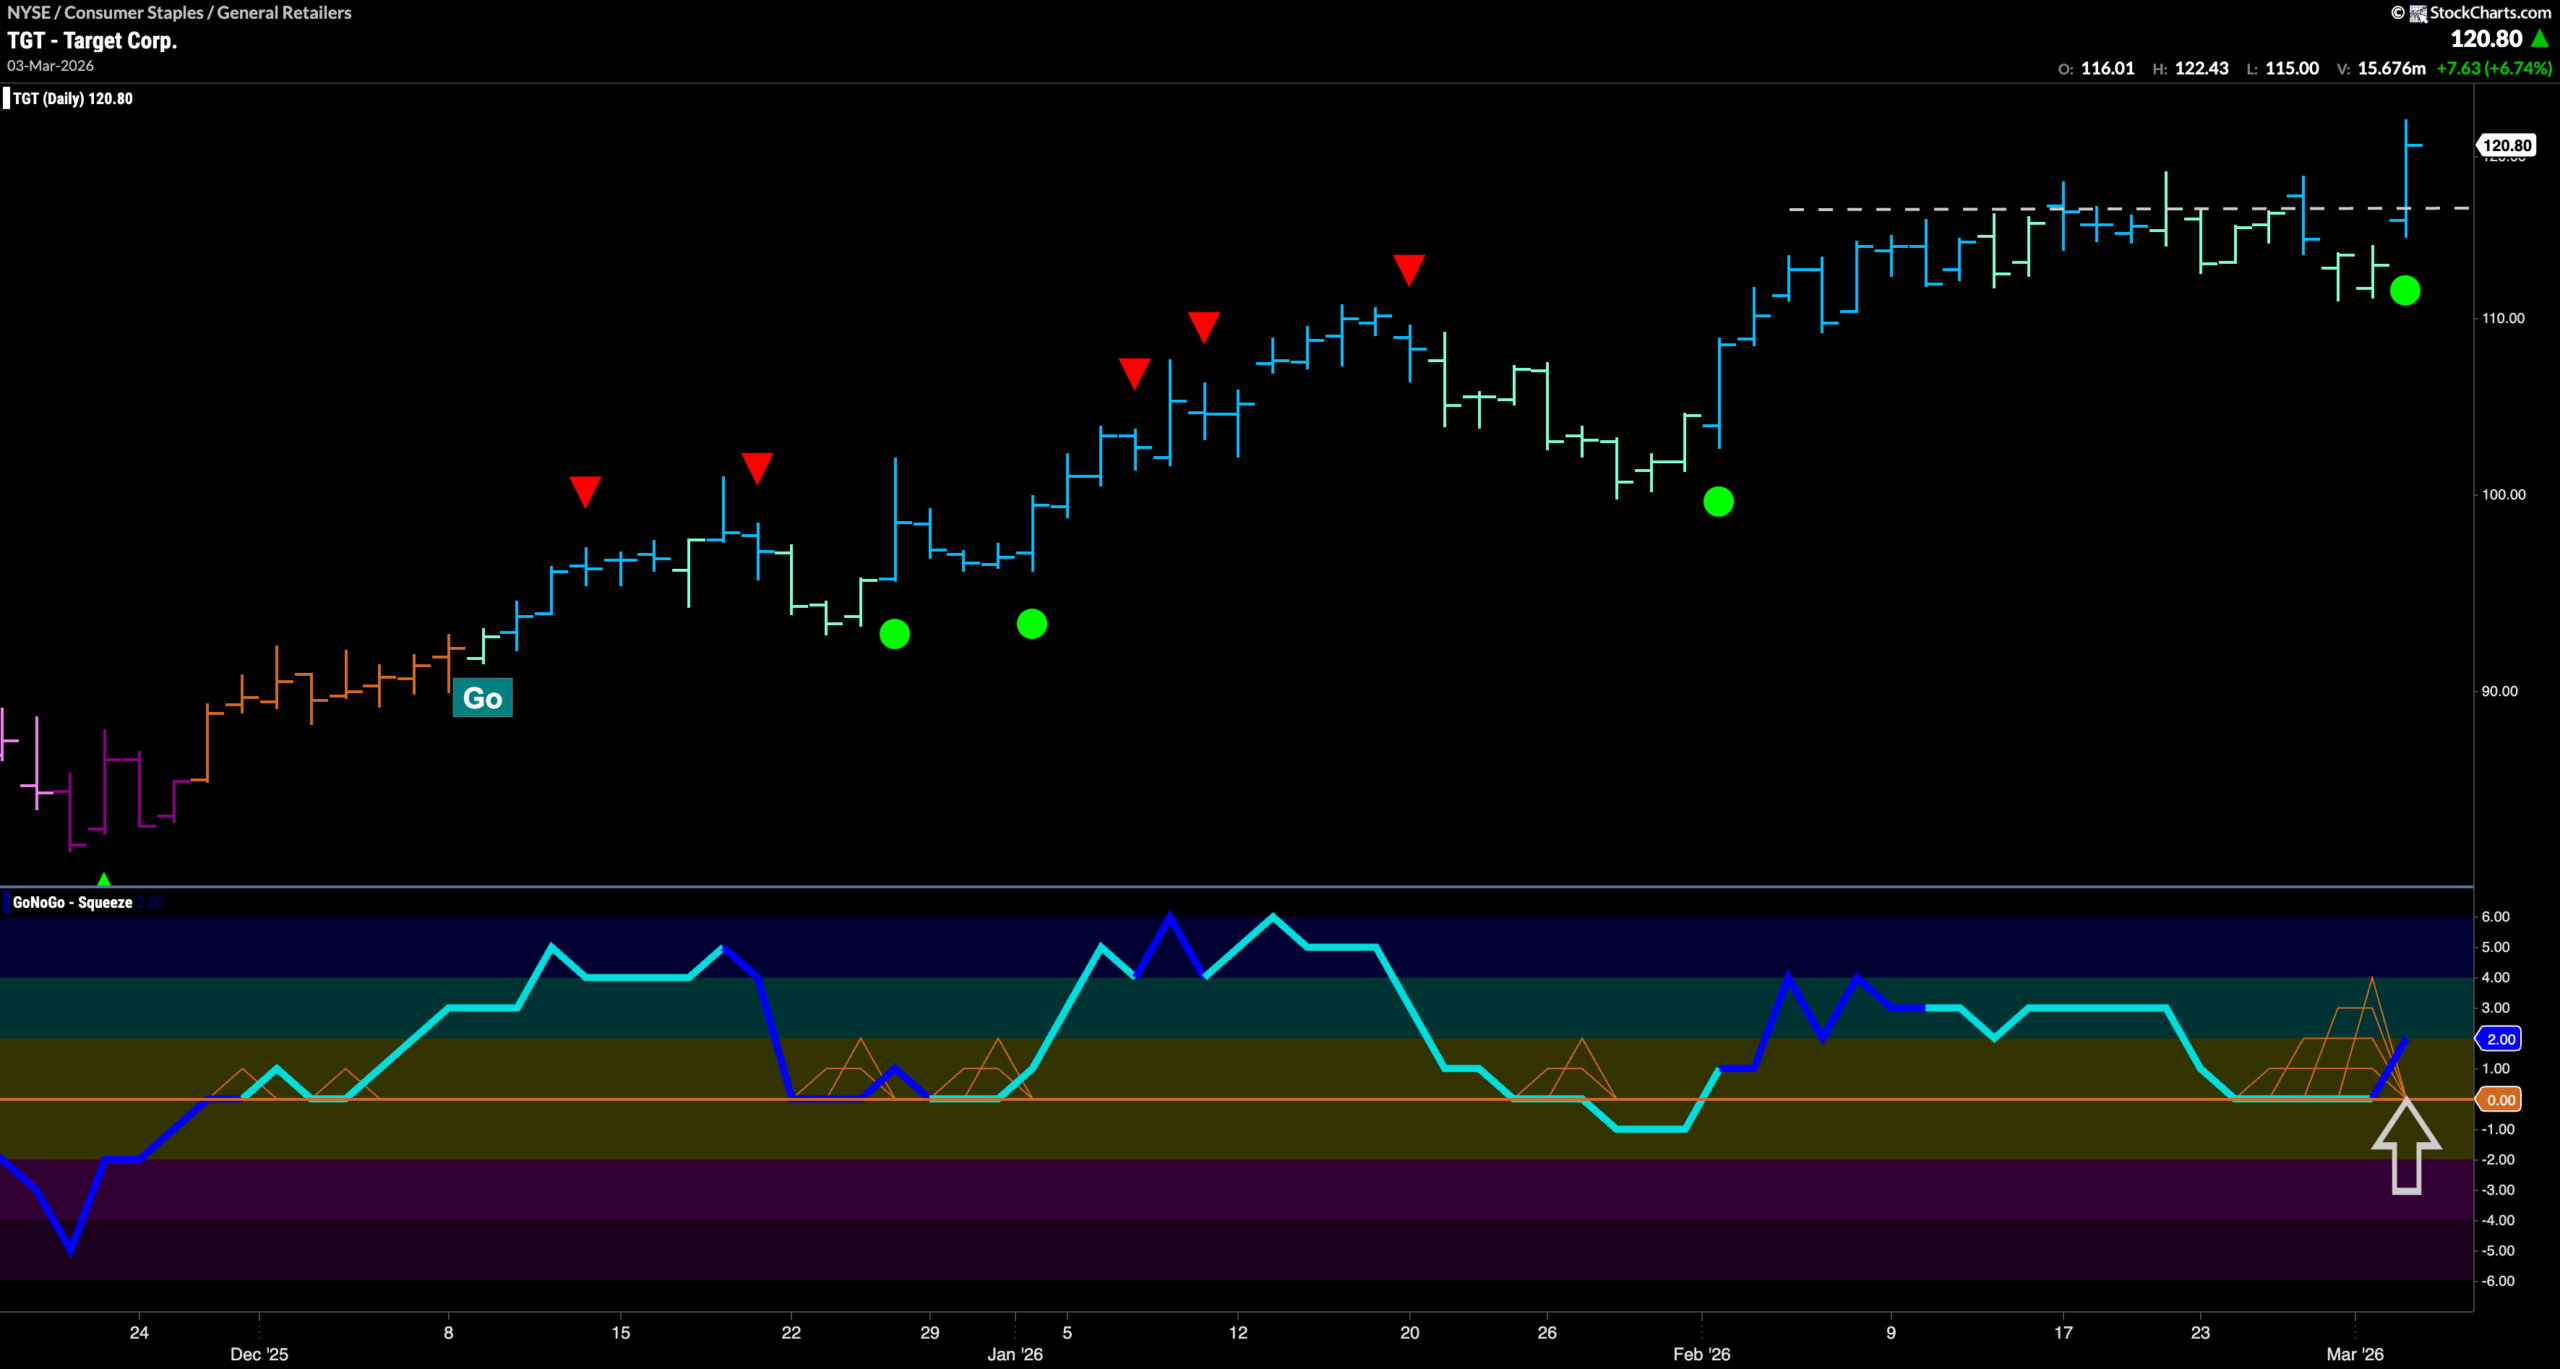

$TGT has been in a “Go” trend for several months.
During that time, we have seen a series of higher highs and higher lows as price climbed close to $120. GoNoGo Oscillator has been at or above the zero line almost the entire time, showing that momentum has been confirming the trend in price. Recently, as price moved mostly sideways since peaking mid February, we see that GoNoGo Oscillator once again fell to test the zero line. It was important to note whether it would again find support. It did, with the oscillator breaking out of a small GoNoGo Squeeze into positive territory with increasing volume (dark blue oscillator color). This triggered a Go Trend Continuation Icon (green circle) under price, telling us that momentum was resurgent in the direction of the “Go” trend. With this boost in momentum, we see GoNoGo Trend painting a new strong blue “Go” bar as price climbs above horizontal resistance to a new high. We will watch to see if price can consolidate at these elevated levels before potentially climbing higher still.





