
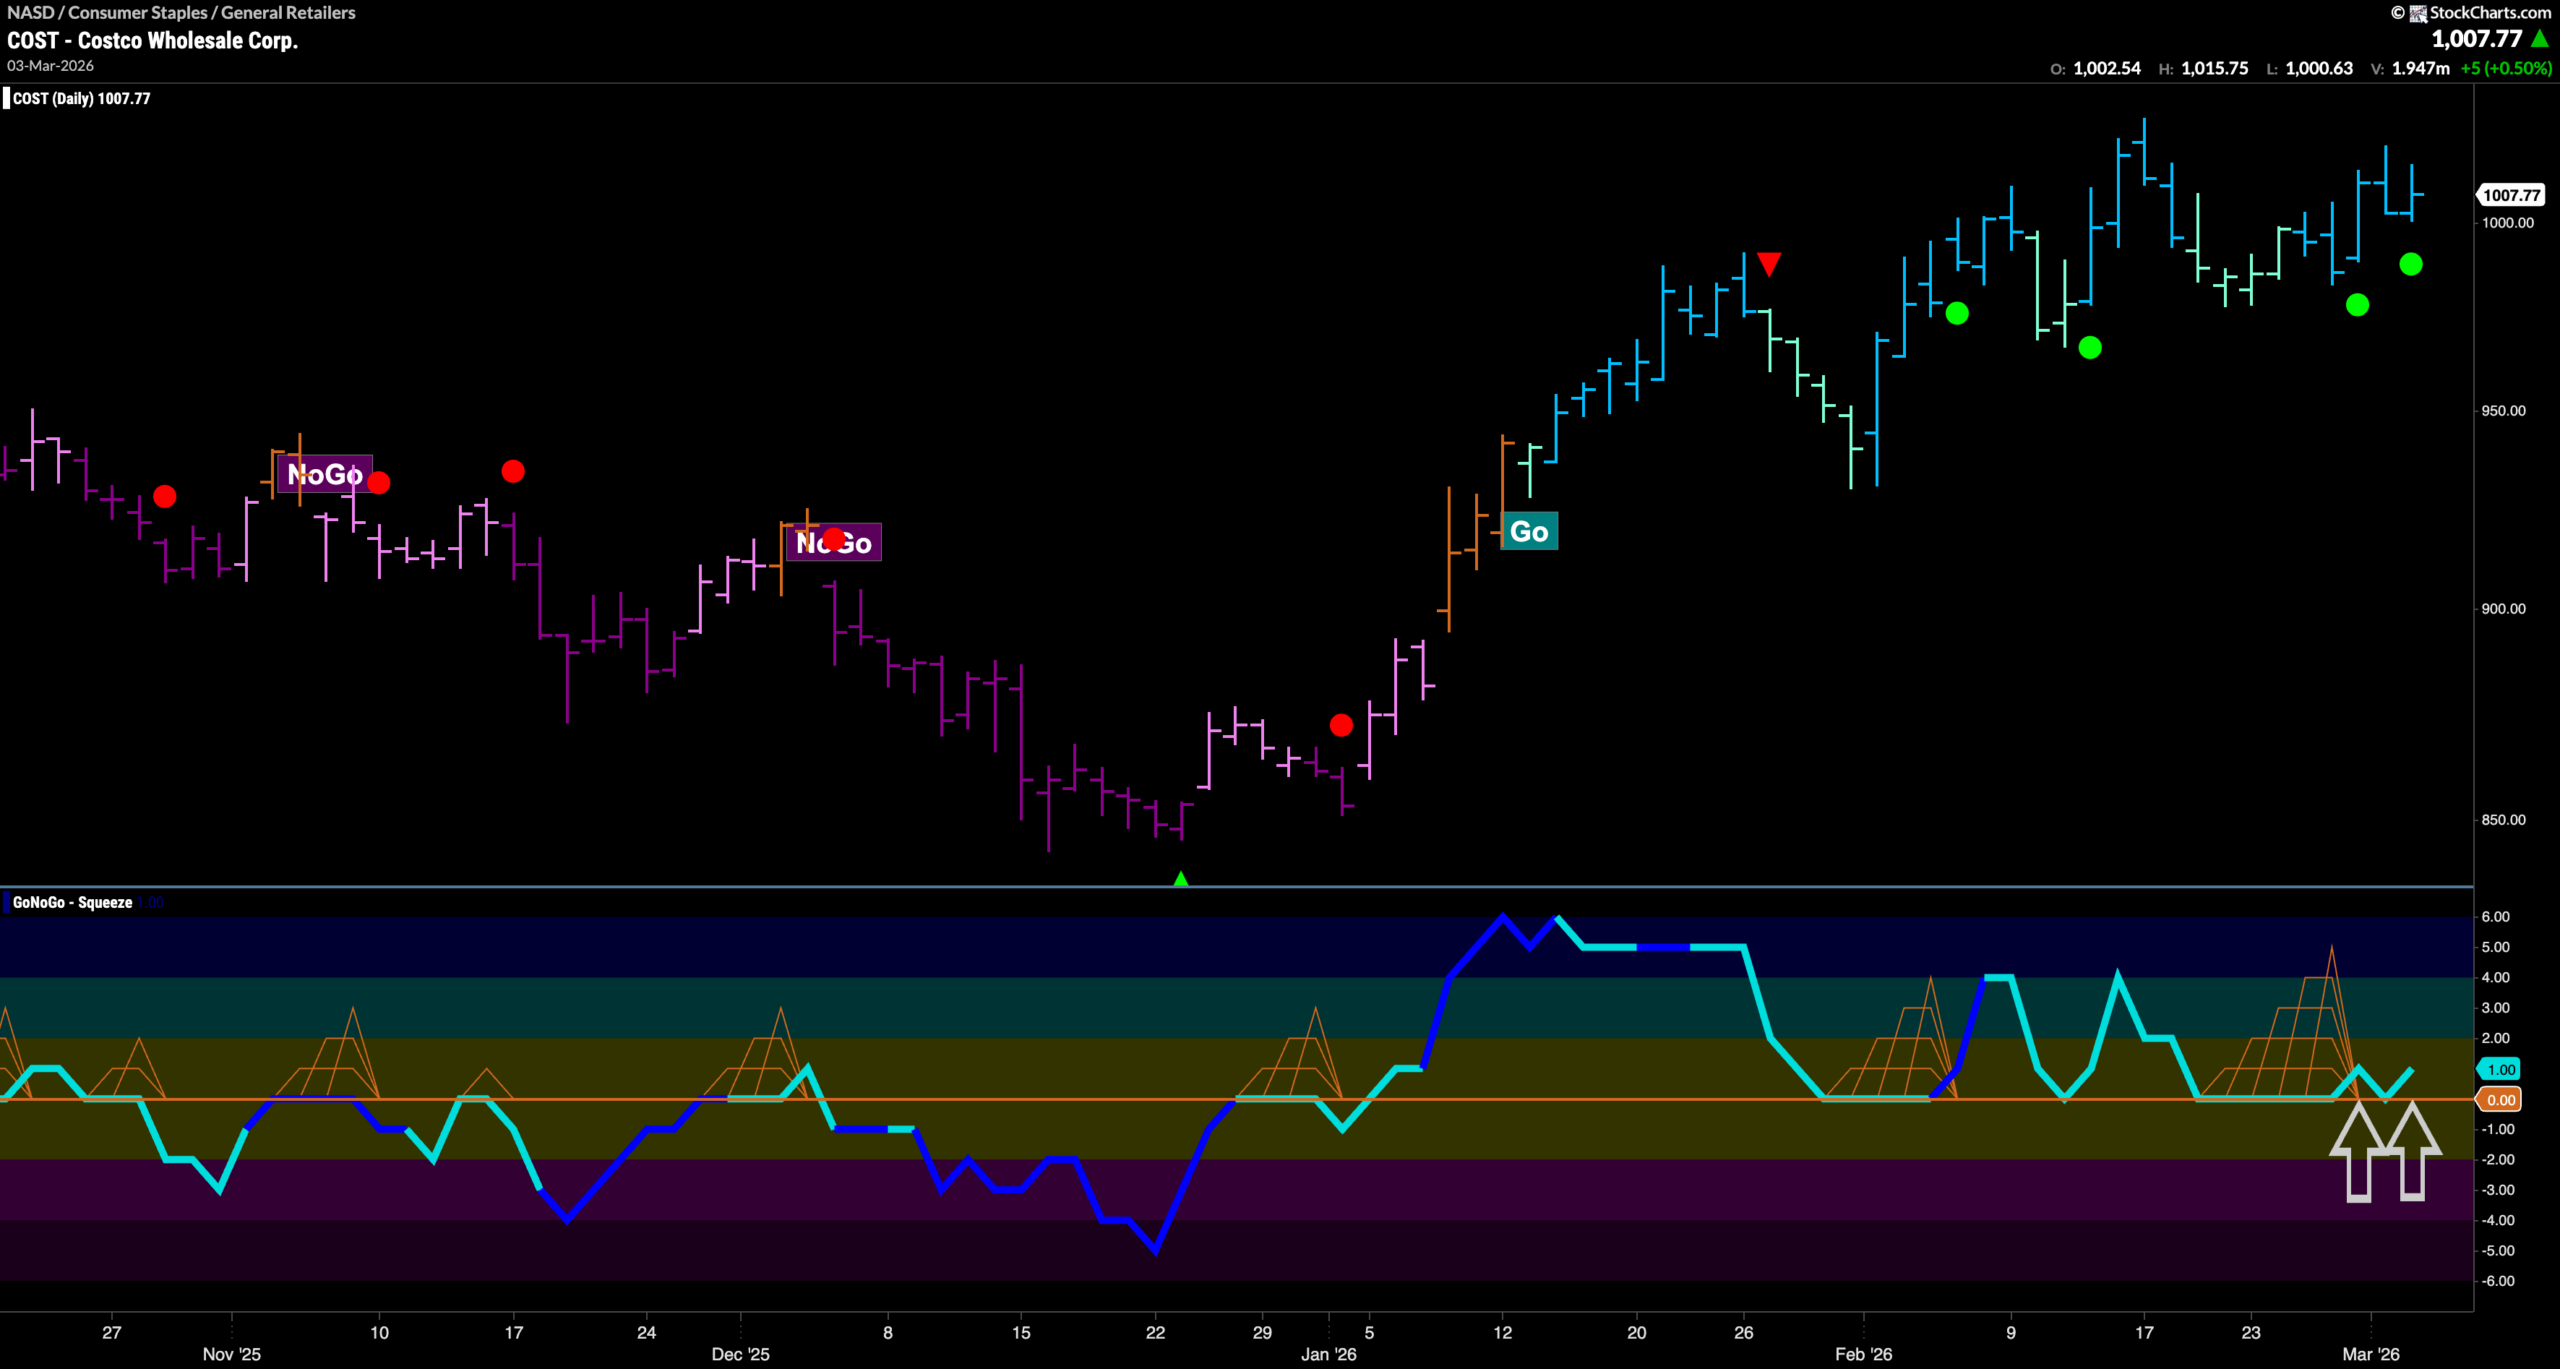

$COST has been in a “Go” trend since mid January.
Since then, we have seen price make higher highs and higher lows as GoNoGo Oscillator has been at or above the zero line confirming the trend in price. Each time the oscillator has fallen to test the zero line from above it has found support and we have seen strong signs of Go Trend Continuation. Most recently, we see GoNoGo Oscillator has broken out of a GoNoGo Squeeze into positive territory and has quickly retested the zero line and found support. This has led to a clustering of Go Trend Continuation Icons (green circles) indicating that momentum is resurgent in the direction of the “Go” trend. With GoNoGo Trend painting strong blue “Go” bars as price closes in on prior highs, we will watch to see if this momentum boost gives price the push it needs to climb to a new higher high in the coming days.





