
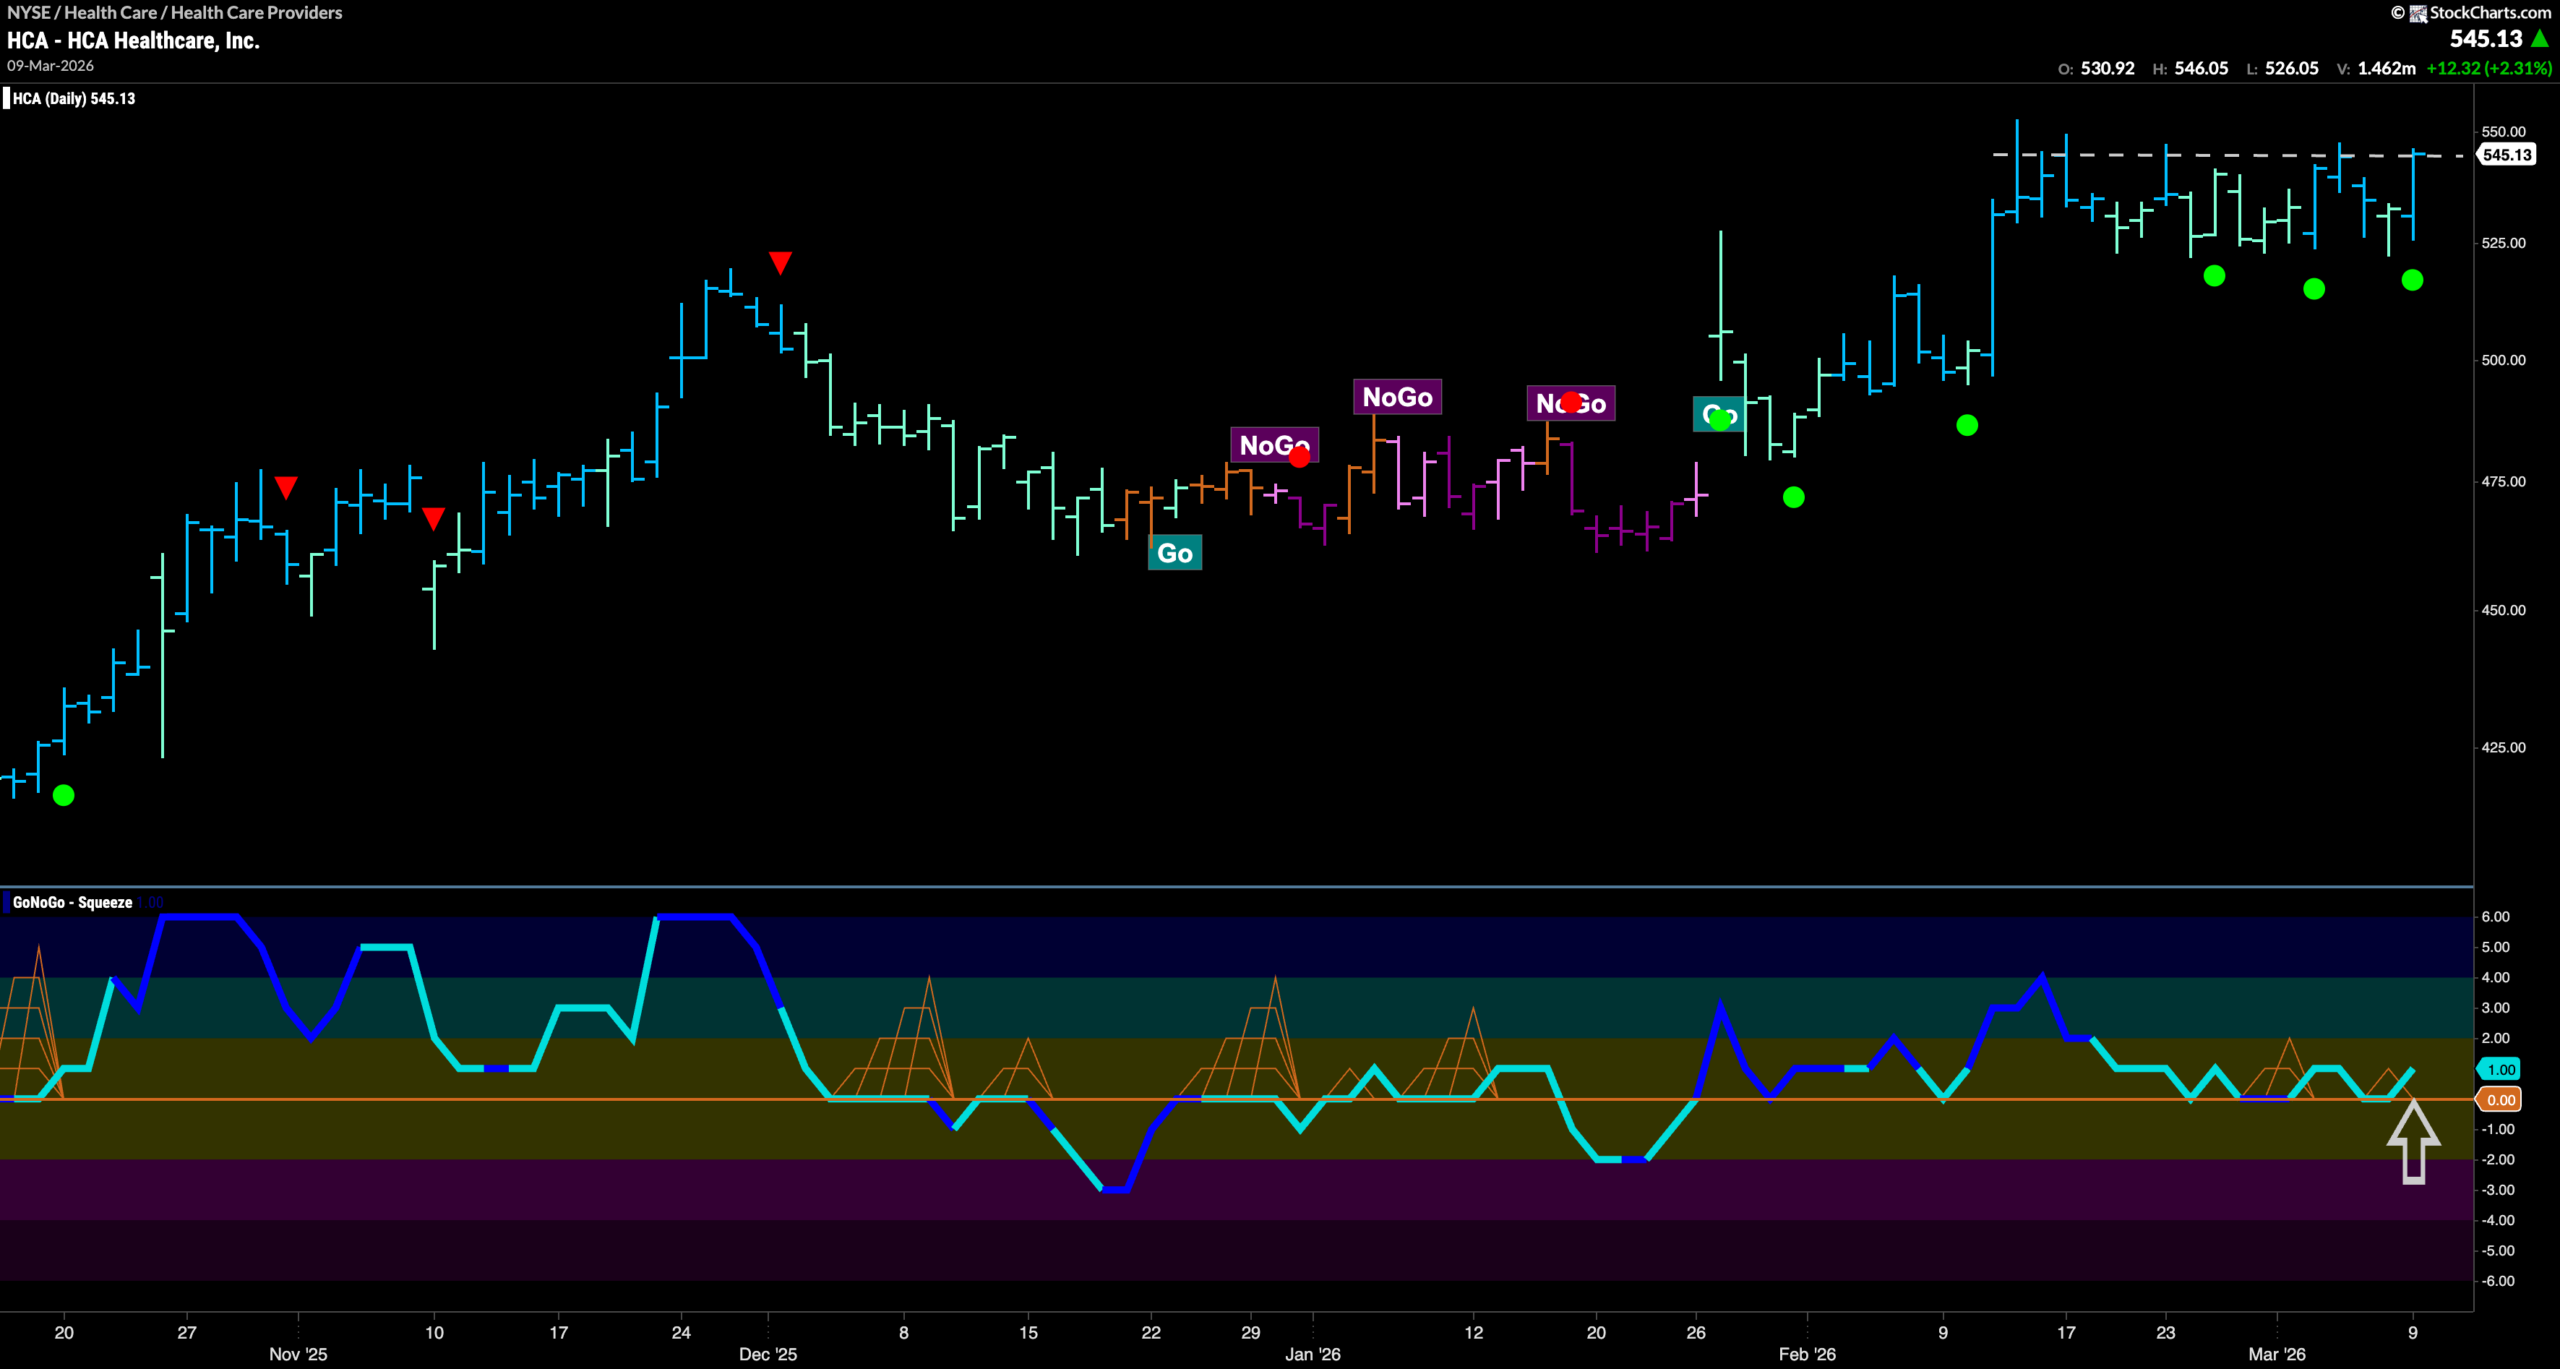

$HCA re-entered a “Go” trend at the end of January.
Since then, we saw price climb to a new high on predominantly strong blue “Go” bars. Having hit that high mid February, we saw price move mostly sideways with a clear line of horizontal resistance forming on the chart as the healthcare stock failed to go higher. During that time, GoNoGo Trend painted several weaker aqua bars and GoNoGo Oscillator fell to test the zero line several times. In a good sign, GoNoGo Oscillator found support several times at that level, each time bouncing back into positive territory. That has given a clustering of Go Trend Continuation Icons (green circles) telling us that momentum remains in step with the “Go” trend. Now, with price painting a strong blue “Go” bar and testing resistance yet again, we see the oscillator finding support one more time at zero. With momentum therefore resurgent in the direction of the “Go” trend, we will look to see if this gives price the push it needs to climb to a new higher high in the coming days.





