
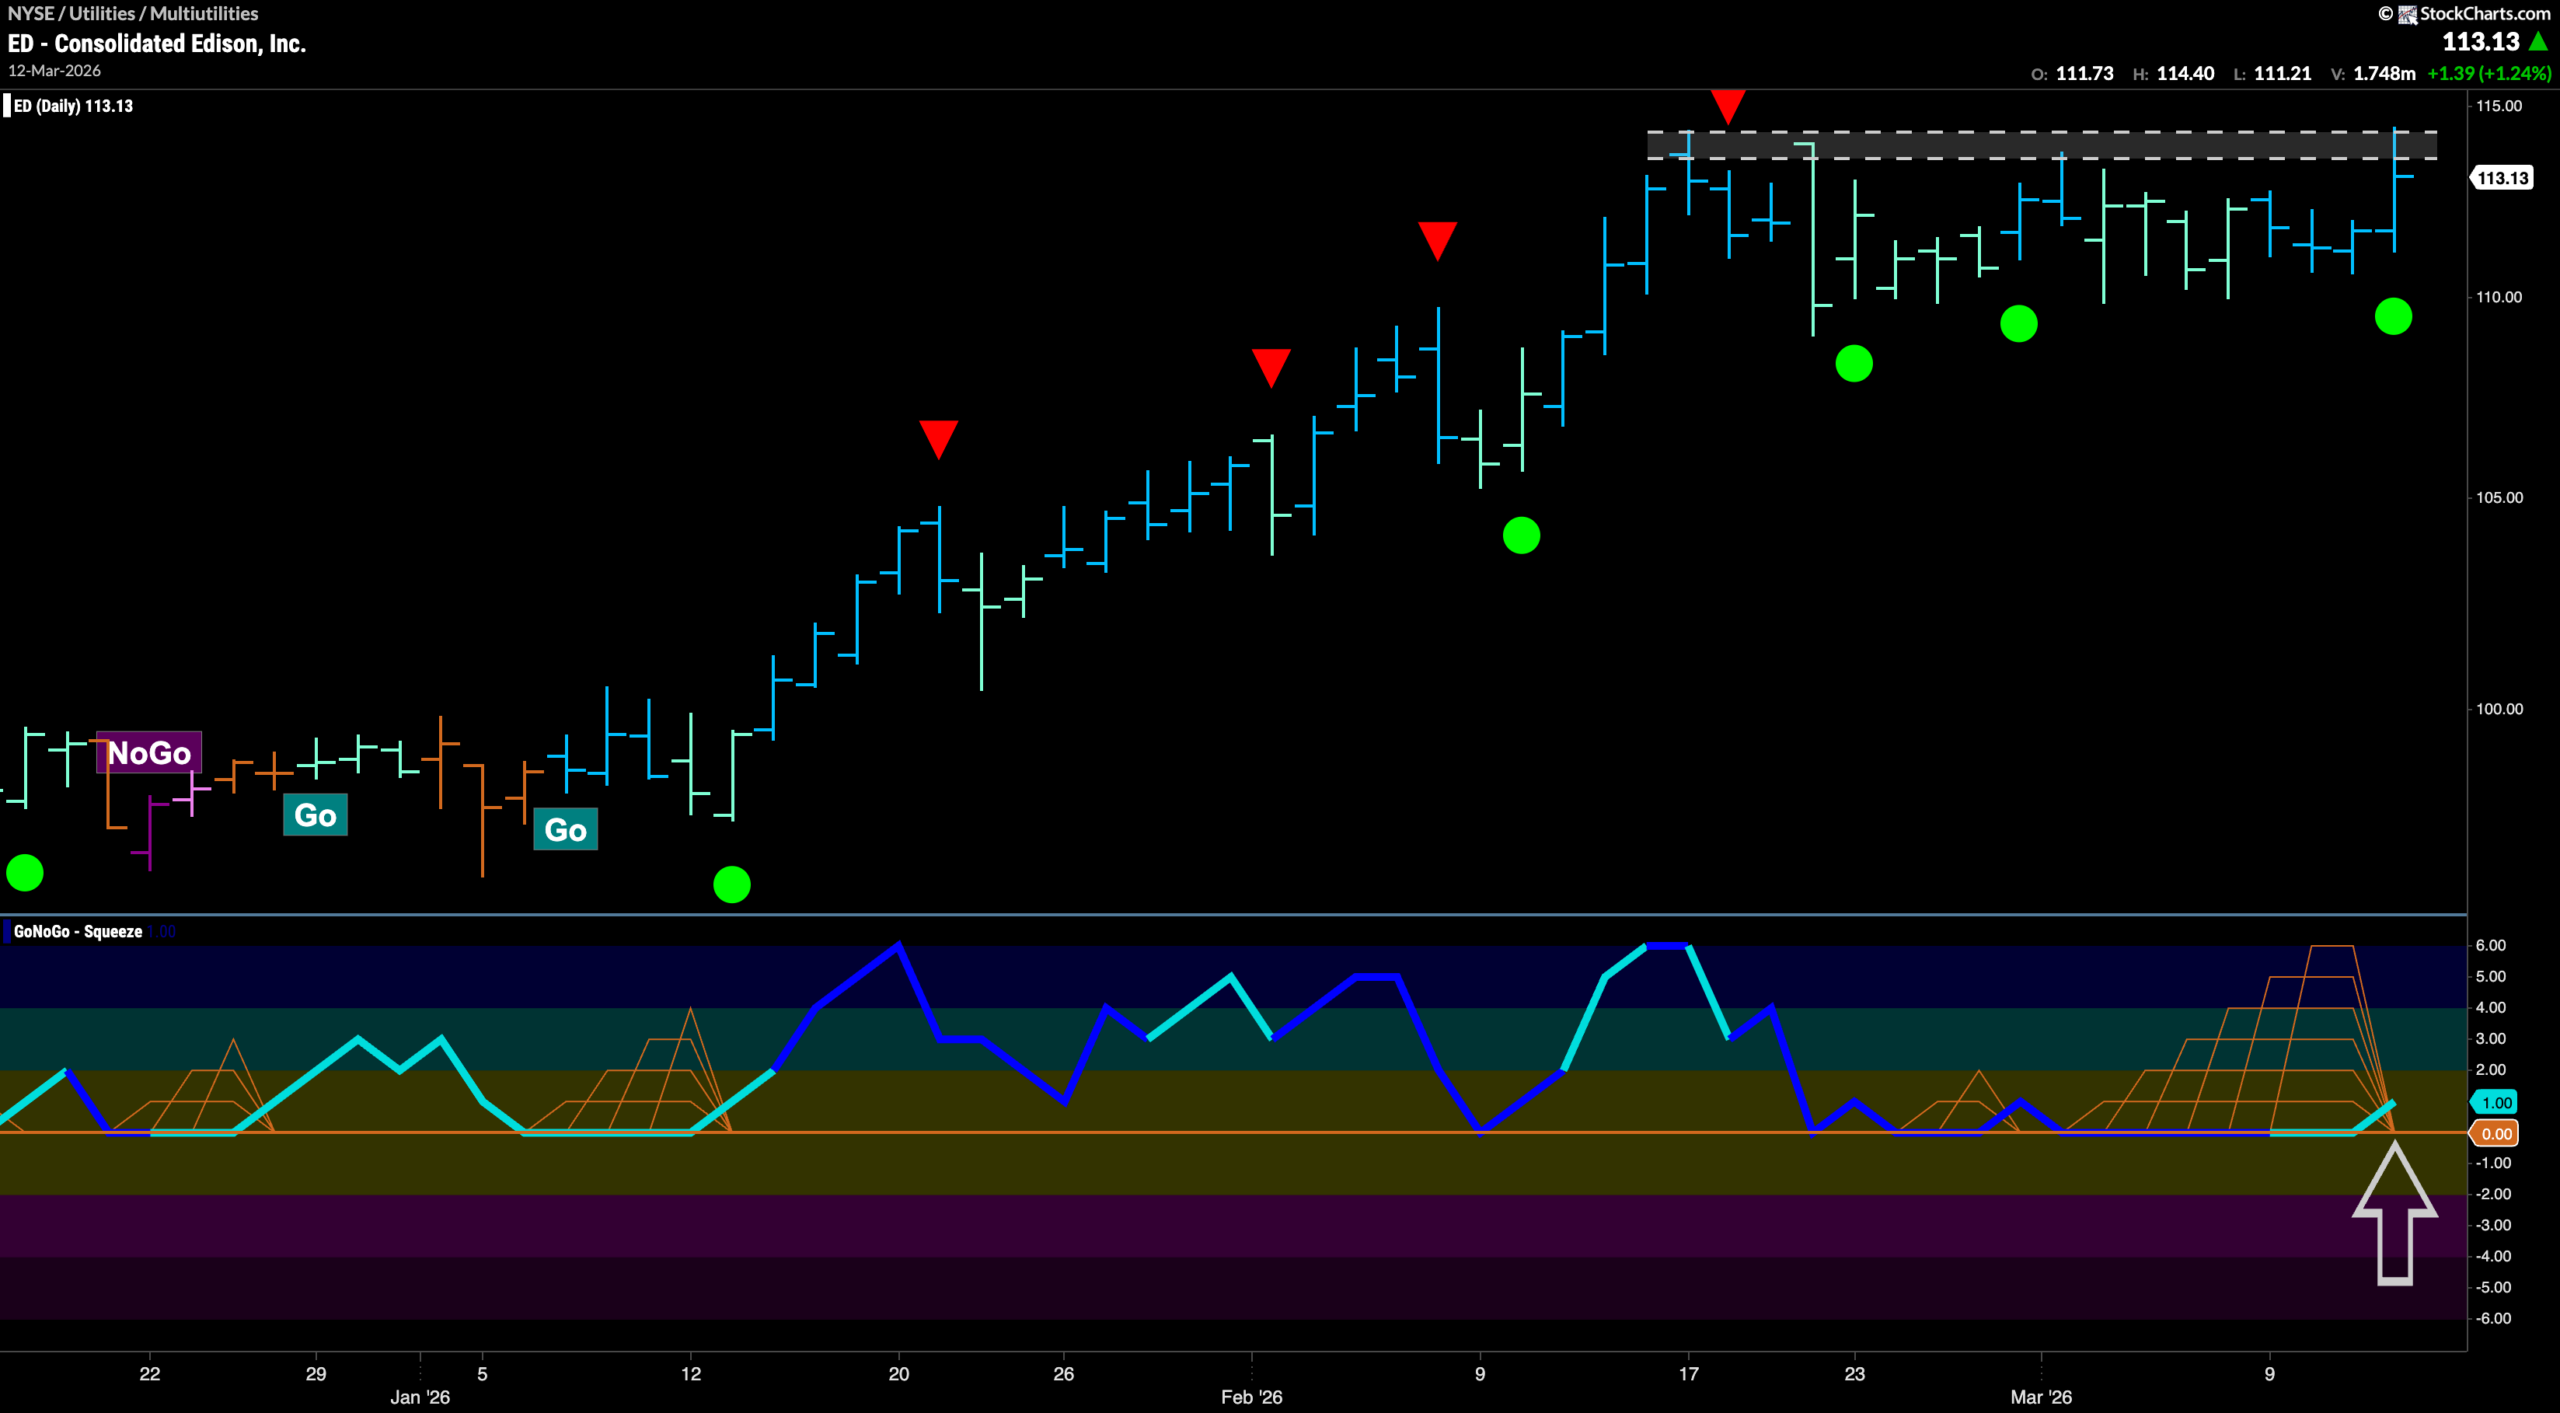

$ED has been in a “Go” trend since the beginning of this year.
We have seen price bound to higher highs and higher lows with GoNoGo Trend painting mostly blue bars as price raced to a high in mid February. During that time, GoNoGo Oscillator was supported by the zero line, bouncing back into positive territory each time it tested that level. This tells us that momentum has remained on the side of the “Go” trend. After the last high, we saw another Go Countertrend Correction Icon (red arrow) indicating that price may struggle to go higher in the short term due to waning momentum. Indeed, we have seen a majority of weaker aqua bars as price has mostly moved sideways since. GoNoGo Oscillator fell to test the zero line again and we saw a Max GoNoGo Squeeze reflecting the tug of war between buyers and sellers at this level. Now with price painting a bright blue bar and challenging overhead resistance, we see the oscillator has broken out of the Squeeze into positive territory. We will watch to see if this resurgent momentum in the direction of the “Go” trend (Go Trend Continuation Icon, green circle) will give price the push it needs to climb to a new higher high in the coming days.





