
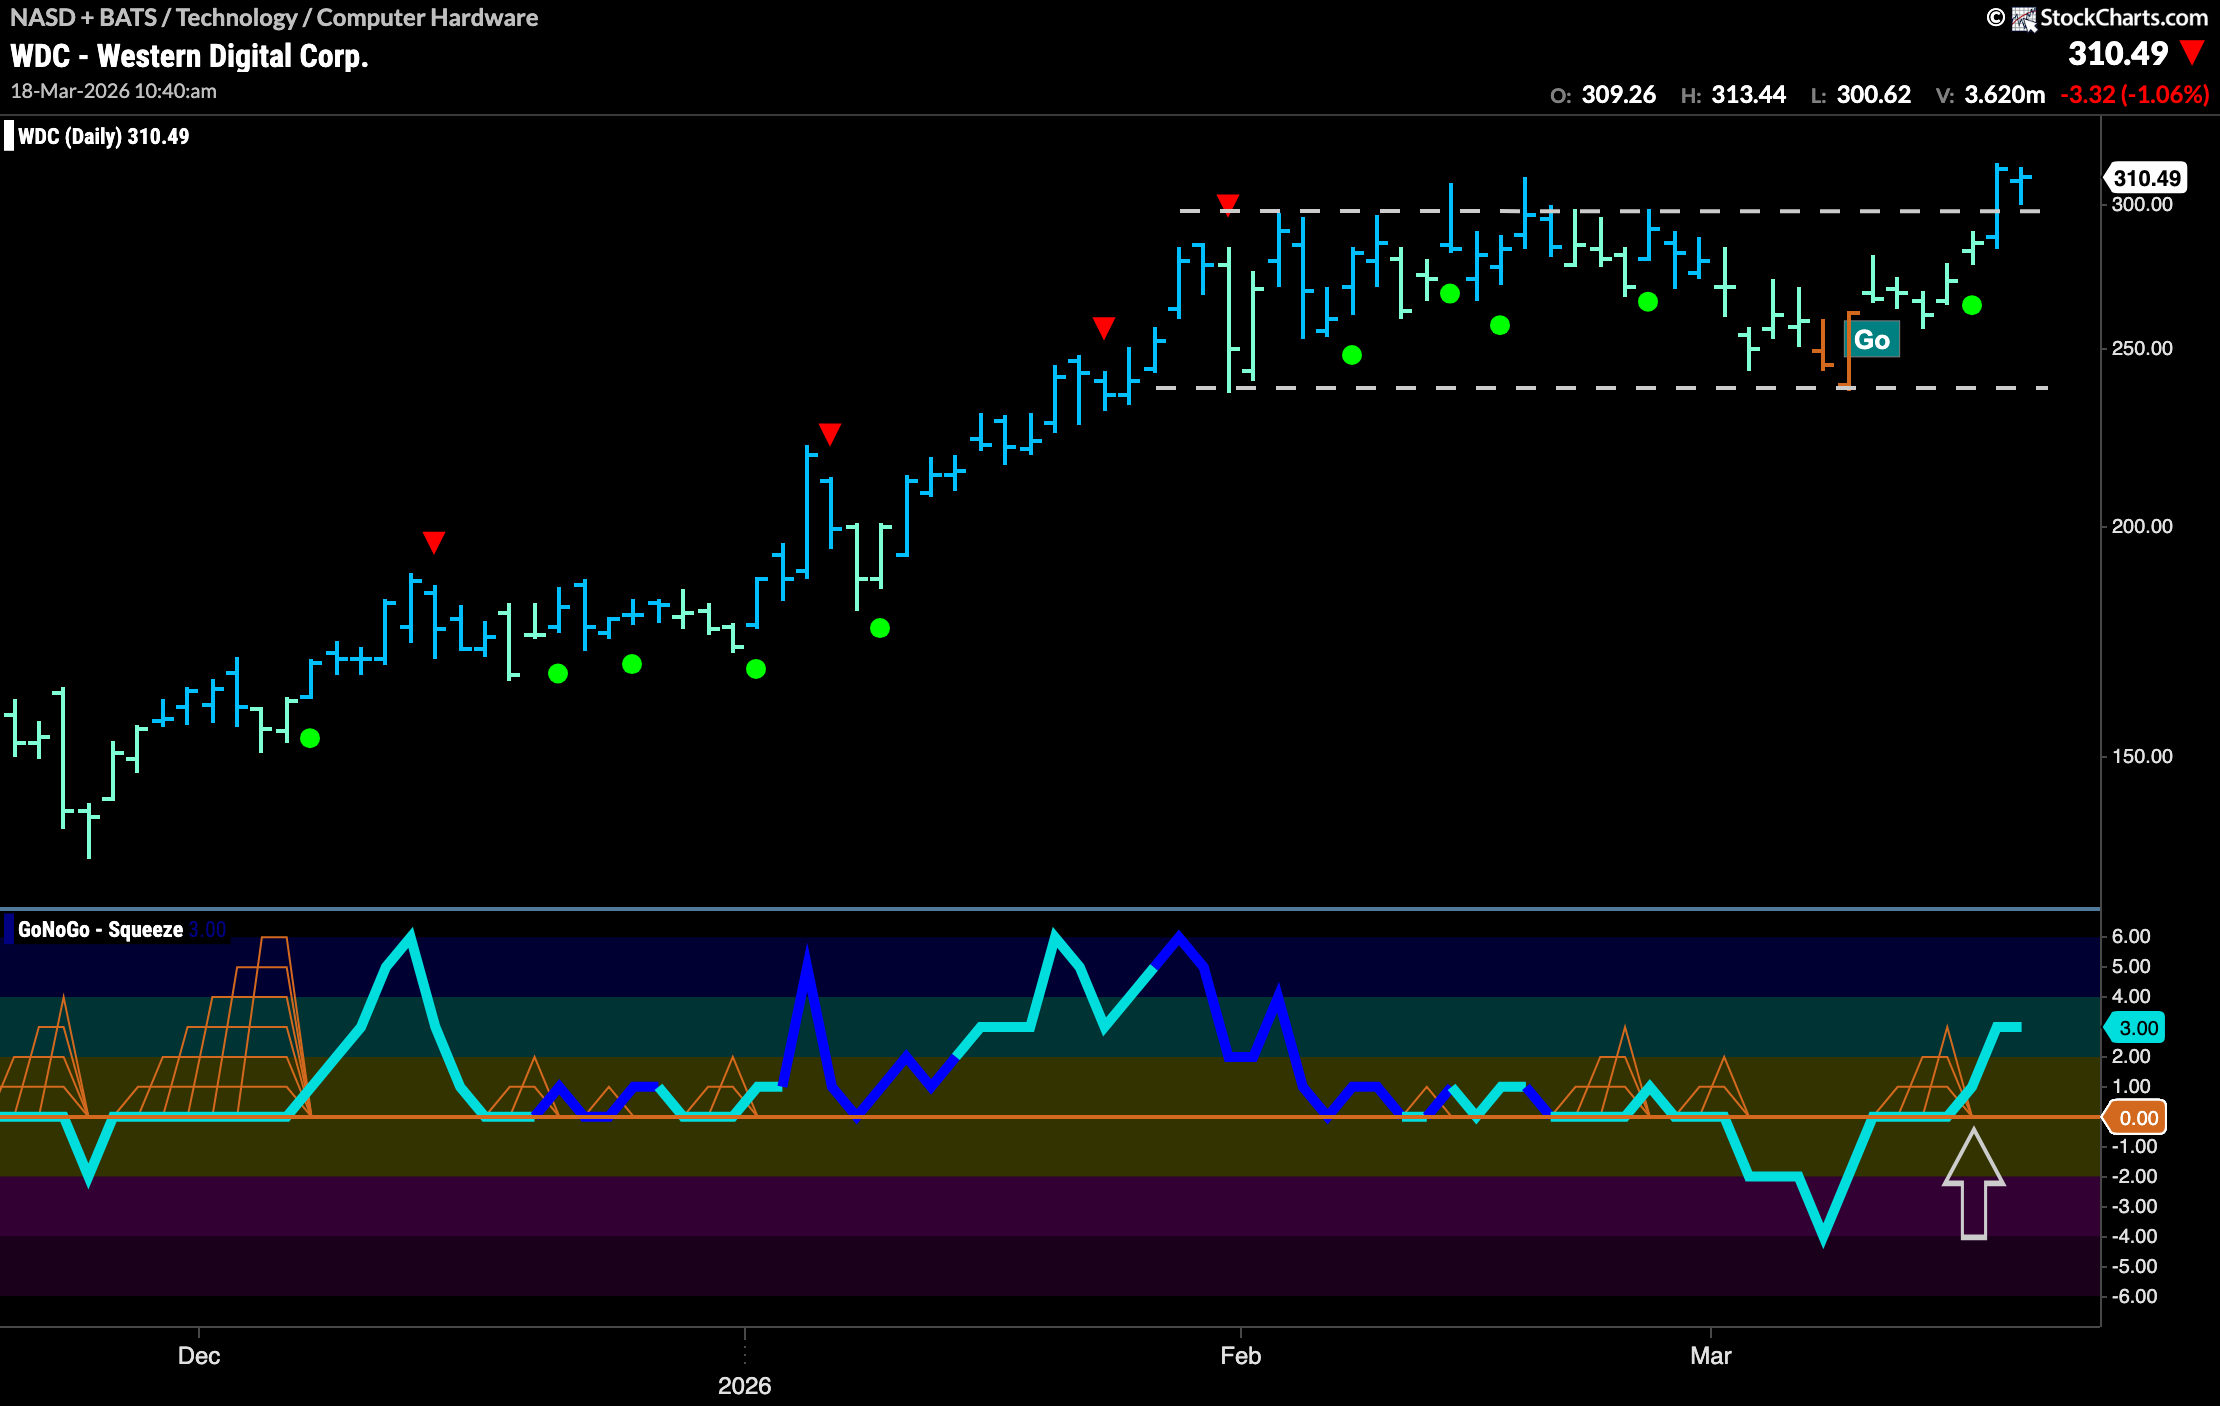

$WDC has been in an incredible “Go” trend that began in early May of last year.
For almost a year, we have seen a series of higher highs and higher lows and an unshakable “Go” trend with the indicator painting only bright blue and aqua bars. During that time, GoNoGo Oscillator remained at or above the zero line, providing support for the trend each time that level was tested. At the end of January, we saw a Go Countertrend Correction Icon (red arrow) indicating that price may struggle to go higher due to waning momentum. Indeed, we saw GoNoGo Trend paint several weaker aqua bars as price has moved mostly sideways. GoNoGo Oscillator during this time fell to test the zero line several times and eventually fell into negative territory. This spelled a larger concern for the trend and we then saw GoNoGo Trend slip into amber “Go Fish” bars as the market was uncertain about the health of the trend. As the support was found at the lower bound of the channel, GoNoGo Trend painted “Go” bars again and GoNoGo Oscillator rallied back through the zero line into positive territory. Now with momentum resurgent in the direction of the “Go” trend we see price has broken above the upper bound of the channel on strong blue bars. We will look for price to consolidate at these levels and use the previous resistance as support if needed going forward.





