
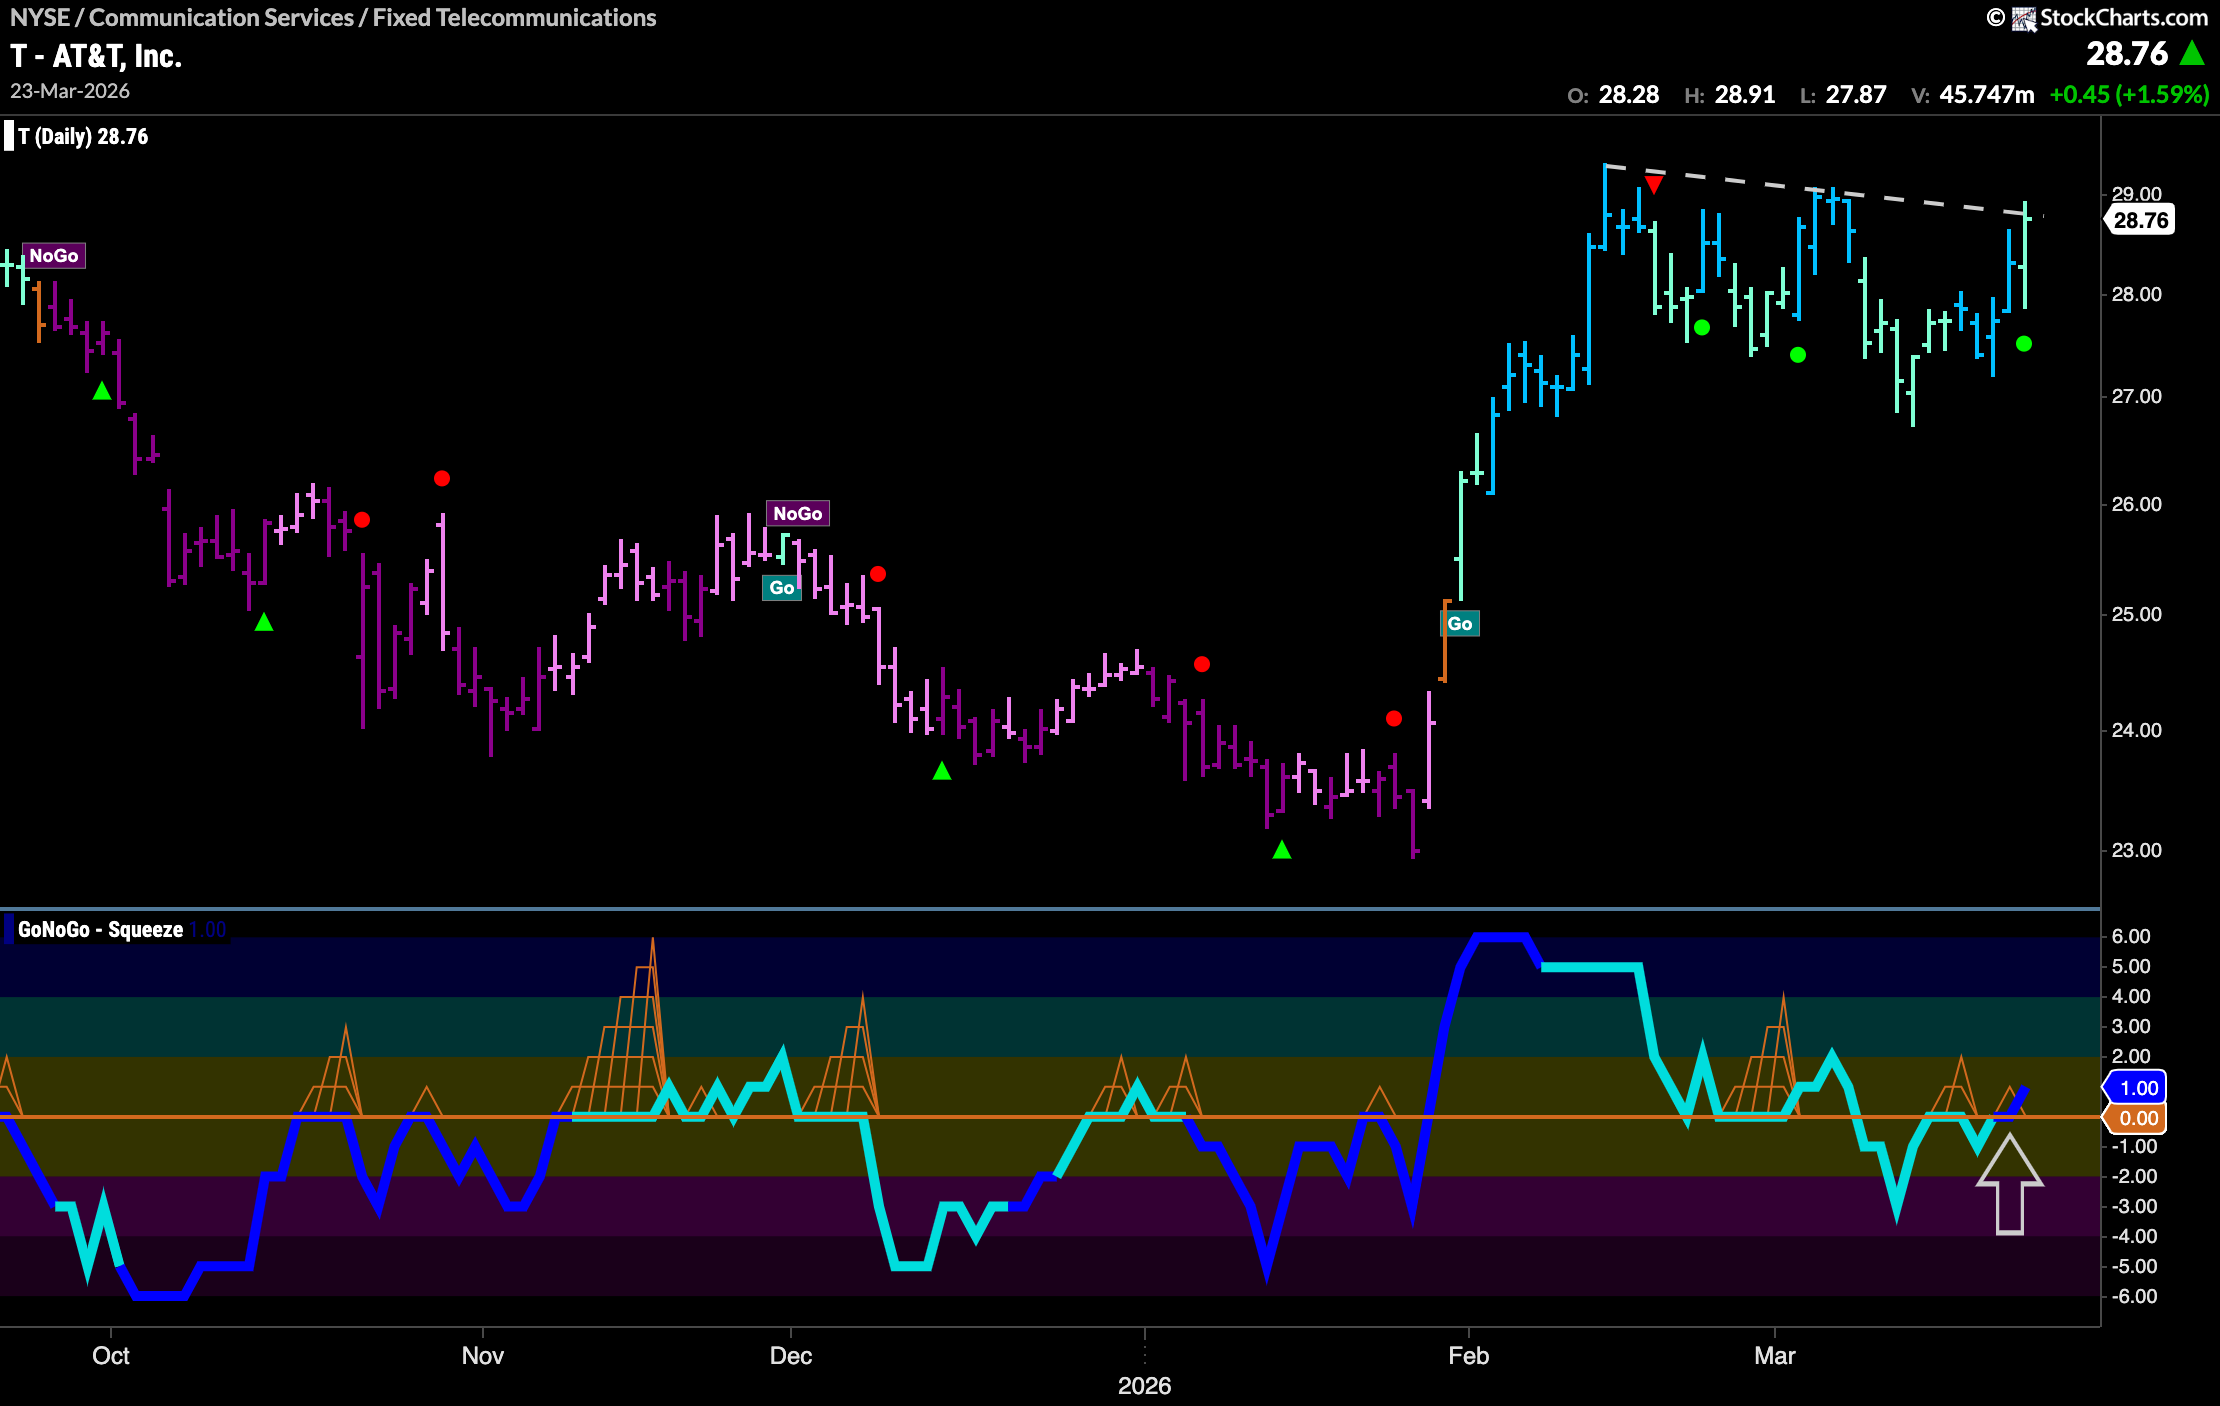

At the end of January, $T rallied into a new “Go” trend.
We saw price race higher to a high of almost $30 in mid February. After that high, we saw a Go Countertrend Correction Icon (red arrow) indicating that price may struggle to go higher in the short term due to waning momentum. Indeed, we have seen price fall back from that high since. Price made a slightly lower high earlier this month and GoNoGo Oscillator fell into negative territory after failing to find support at the zero line. Now, price has risen to test the downward sloping trend line and GoNoGo Oscillator has been able to break back into positive territory on increasing volume. We will watch to see if this resurgent momentum (Go Trend Continuation Icon, green circle) will give price the boost it needs to climb above resistance and on to a new higher high.





