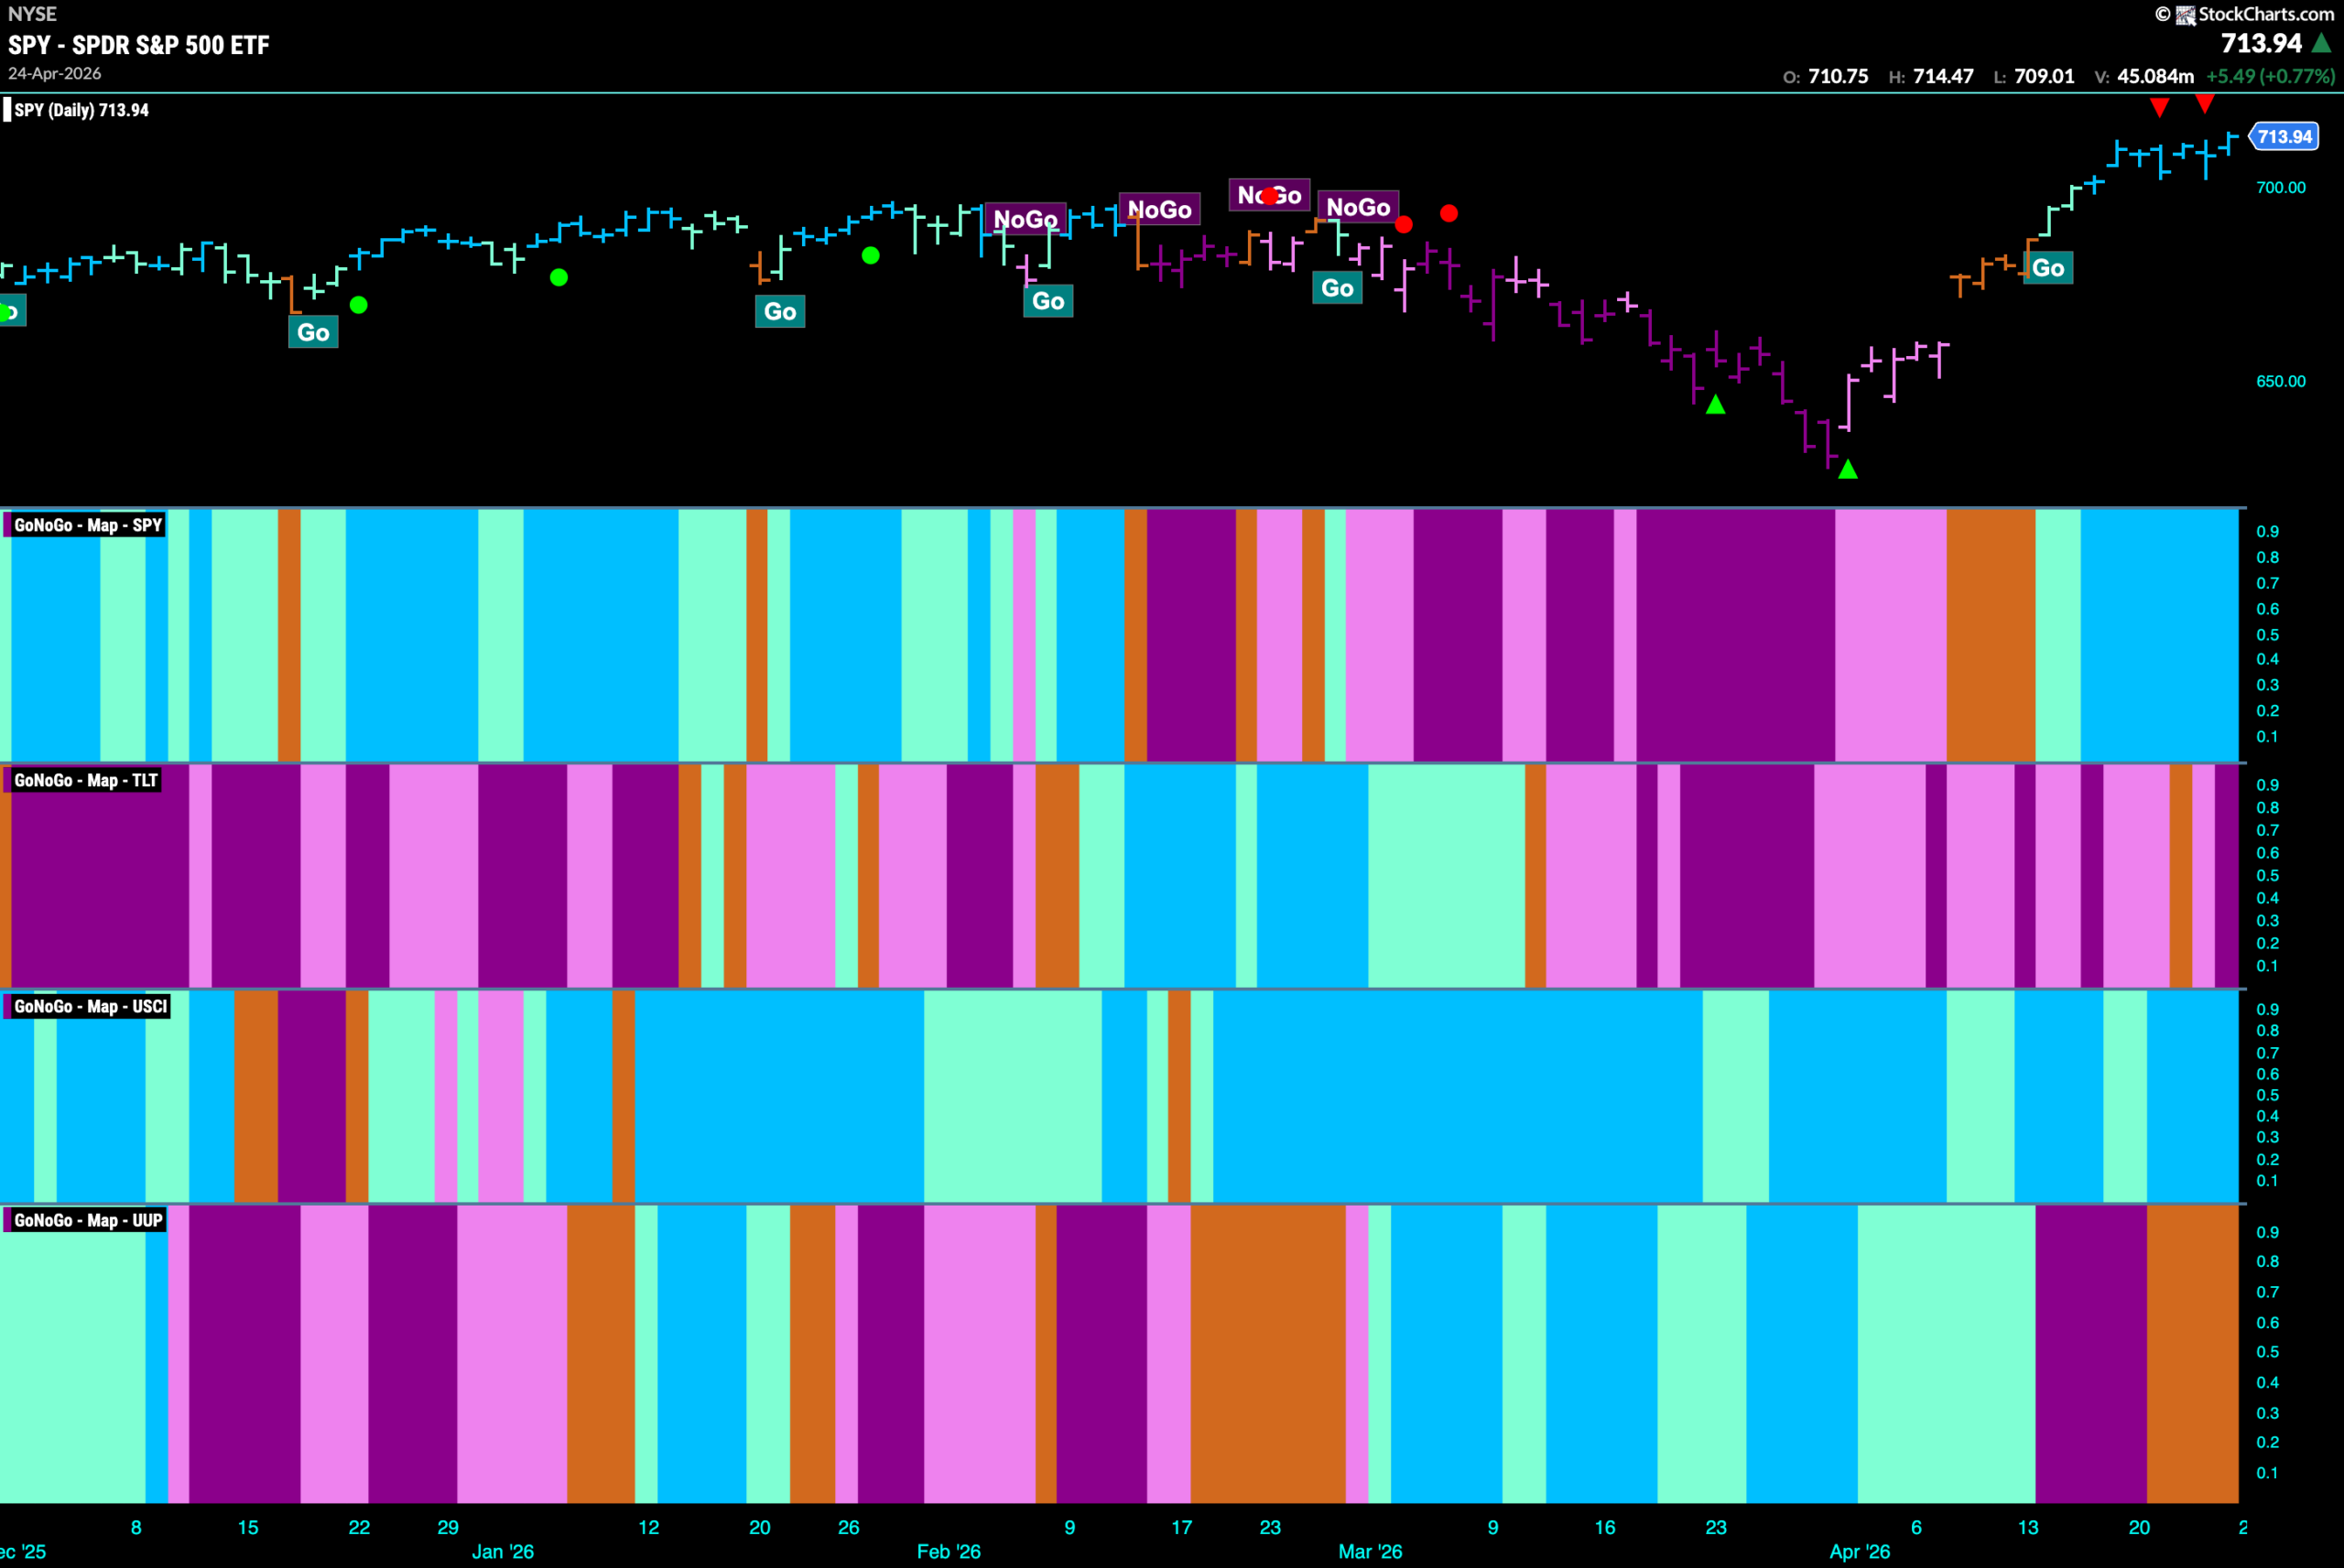
Good morning and welcome to this week’s Flight Path. The equity trend continued this week as the indicator painted a string of uninterrupted bright blue “Go” bars. Treasury bond prices saw the “NoGo” hit back after a lone amber “Go Fish” bar of uncertainty with a strong purple bar to end the week. U.S. commodity prices painted strong blue “Go” bars as the trend held strong and the dollar showed prolonged market uncertainty as purple “NoGo” bars were followed with 4 consecutive amber “Go Fish” bars.
$SPY Consolidates at the Highs
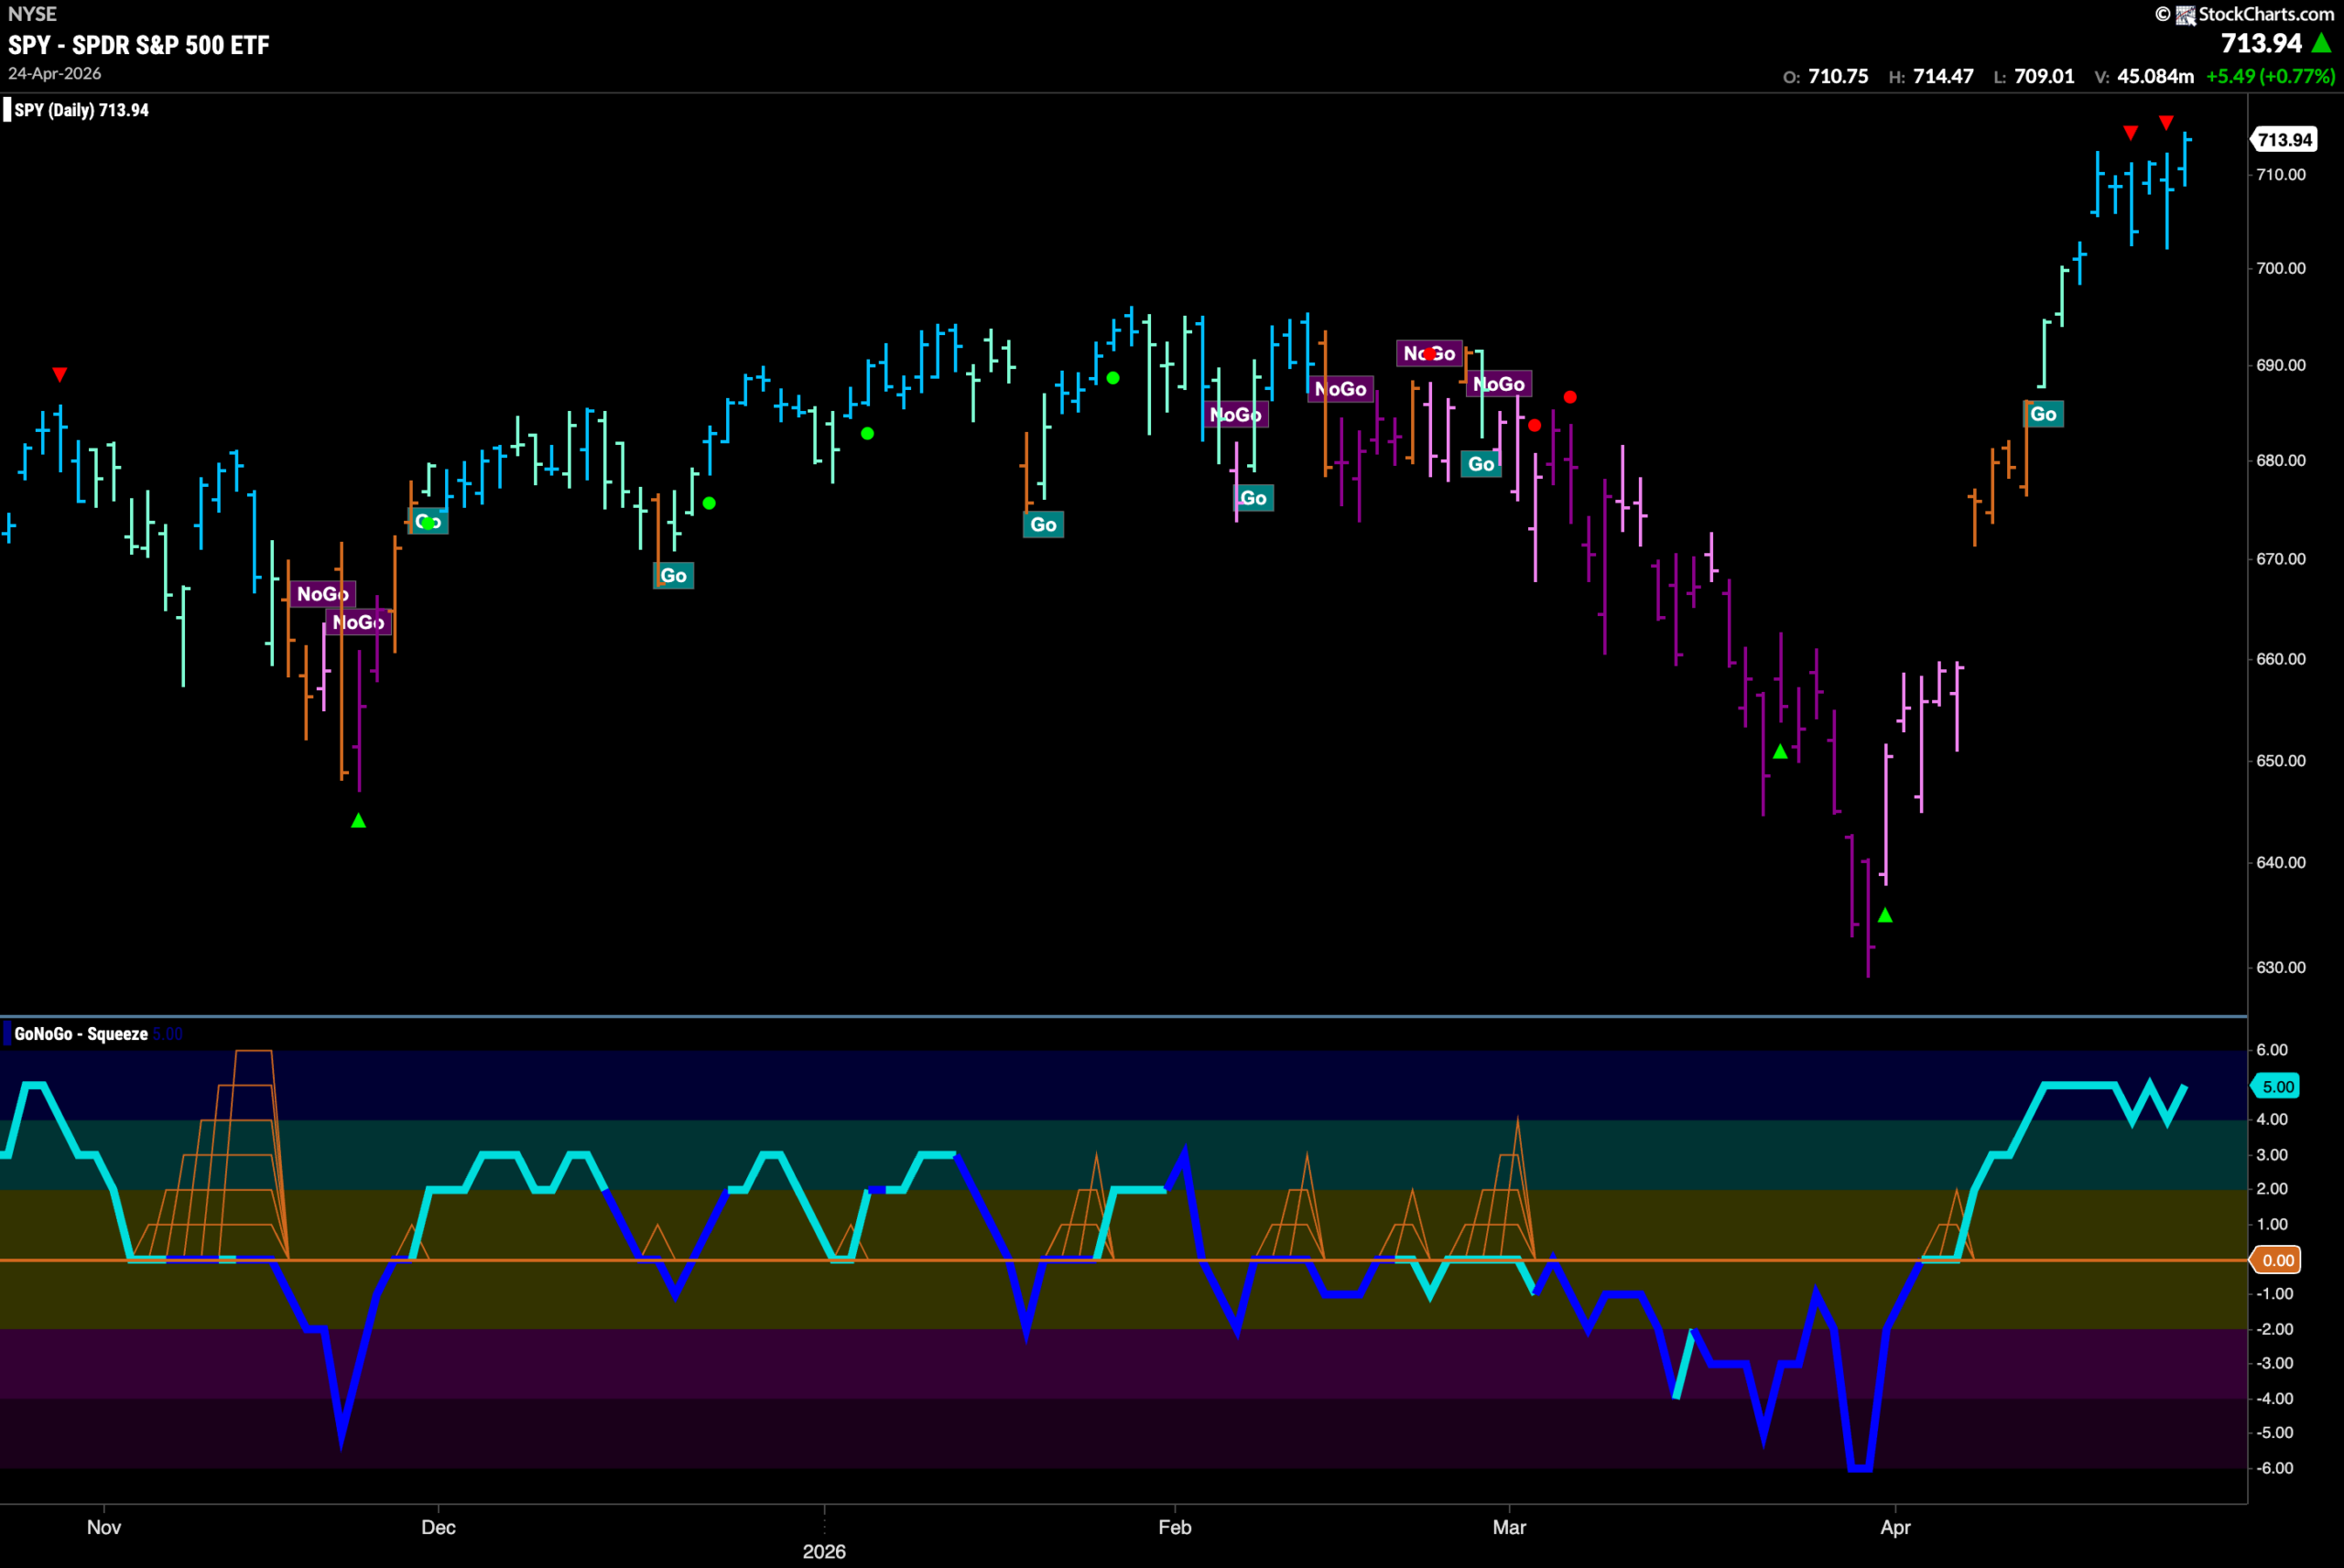
The GoNoGo chart below shows that the new “Go” trend held strong this past week as we see consecutive bright blue bars as price continues to edge higher. If we look at the lower panel, we see that GoNoGo Oscillator is showing maintained market enthusiasm as it stays overbought or close to it for the entire week. Heavy buying is allowing price to remain at these elevated levels.
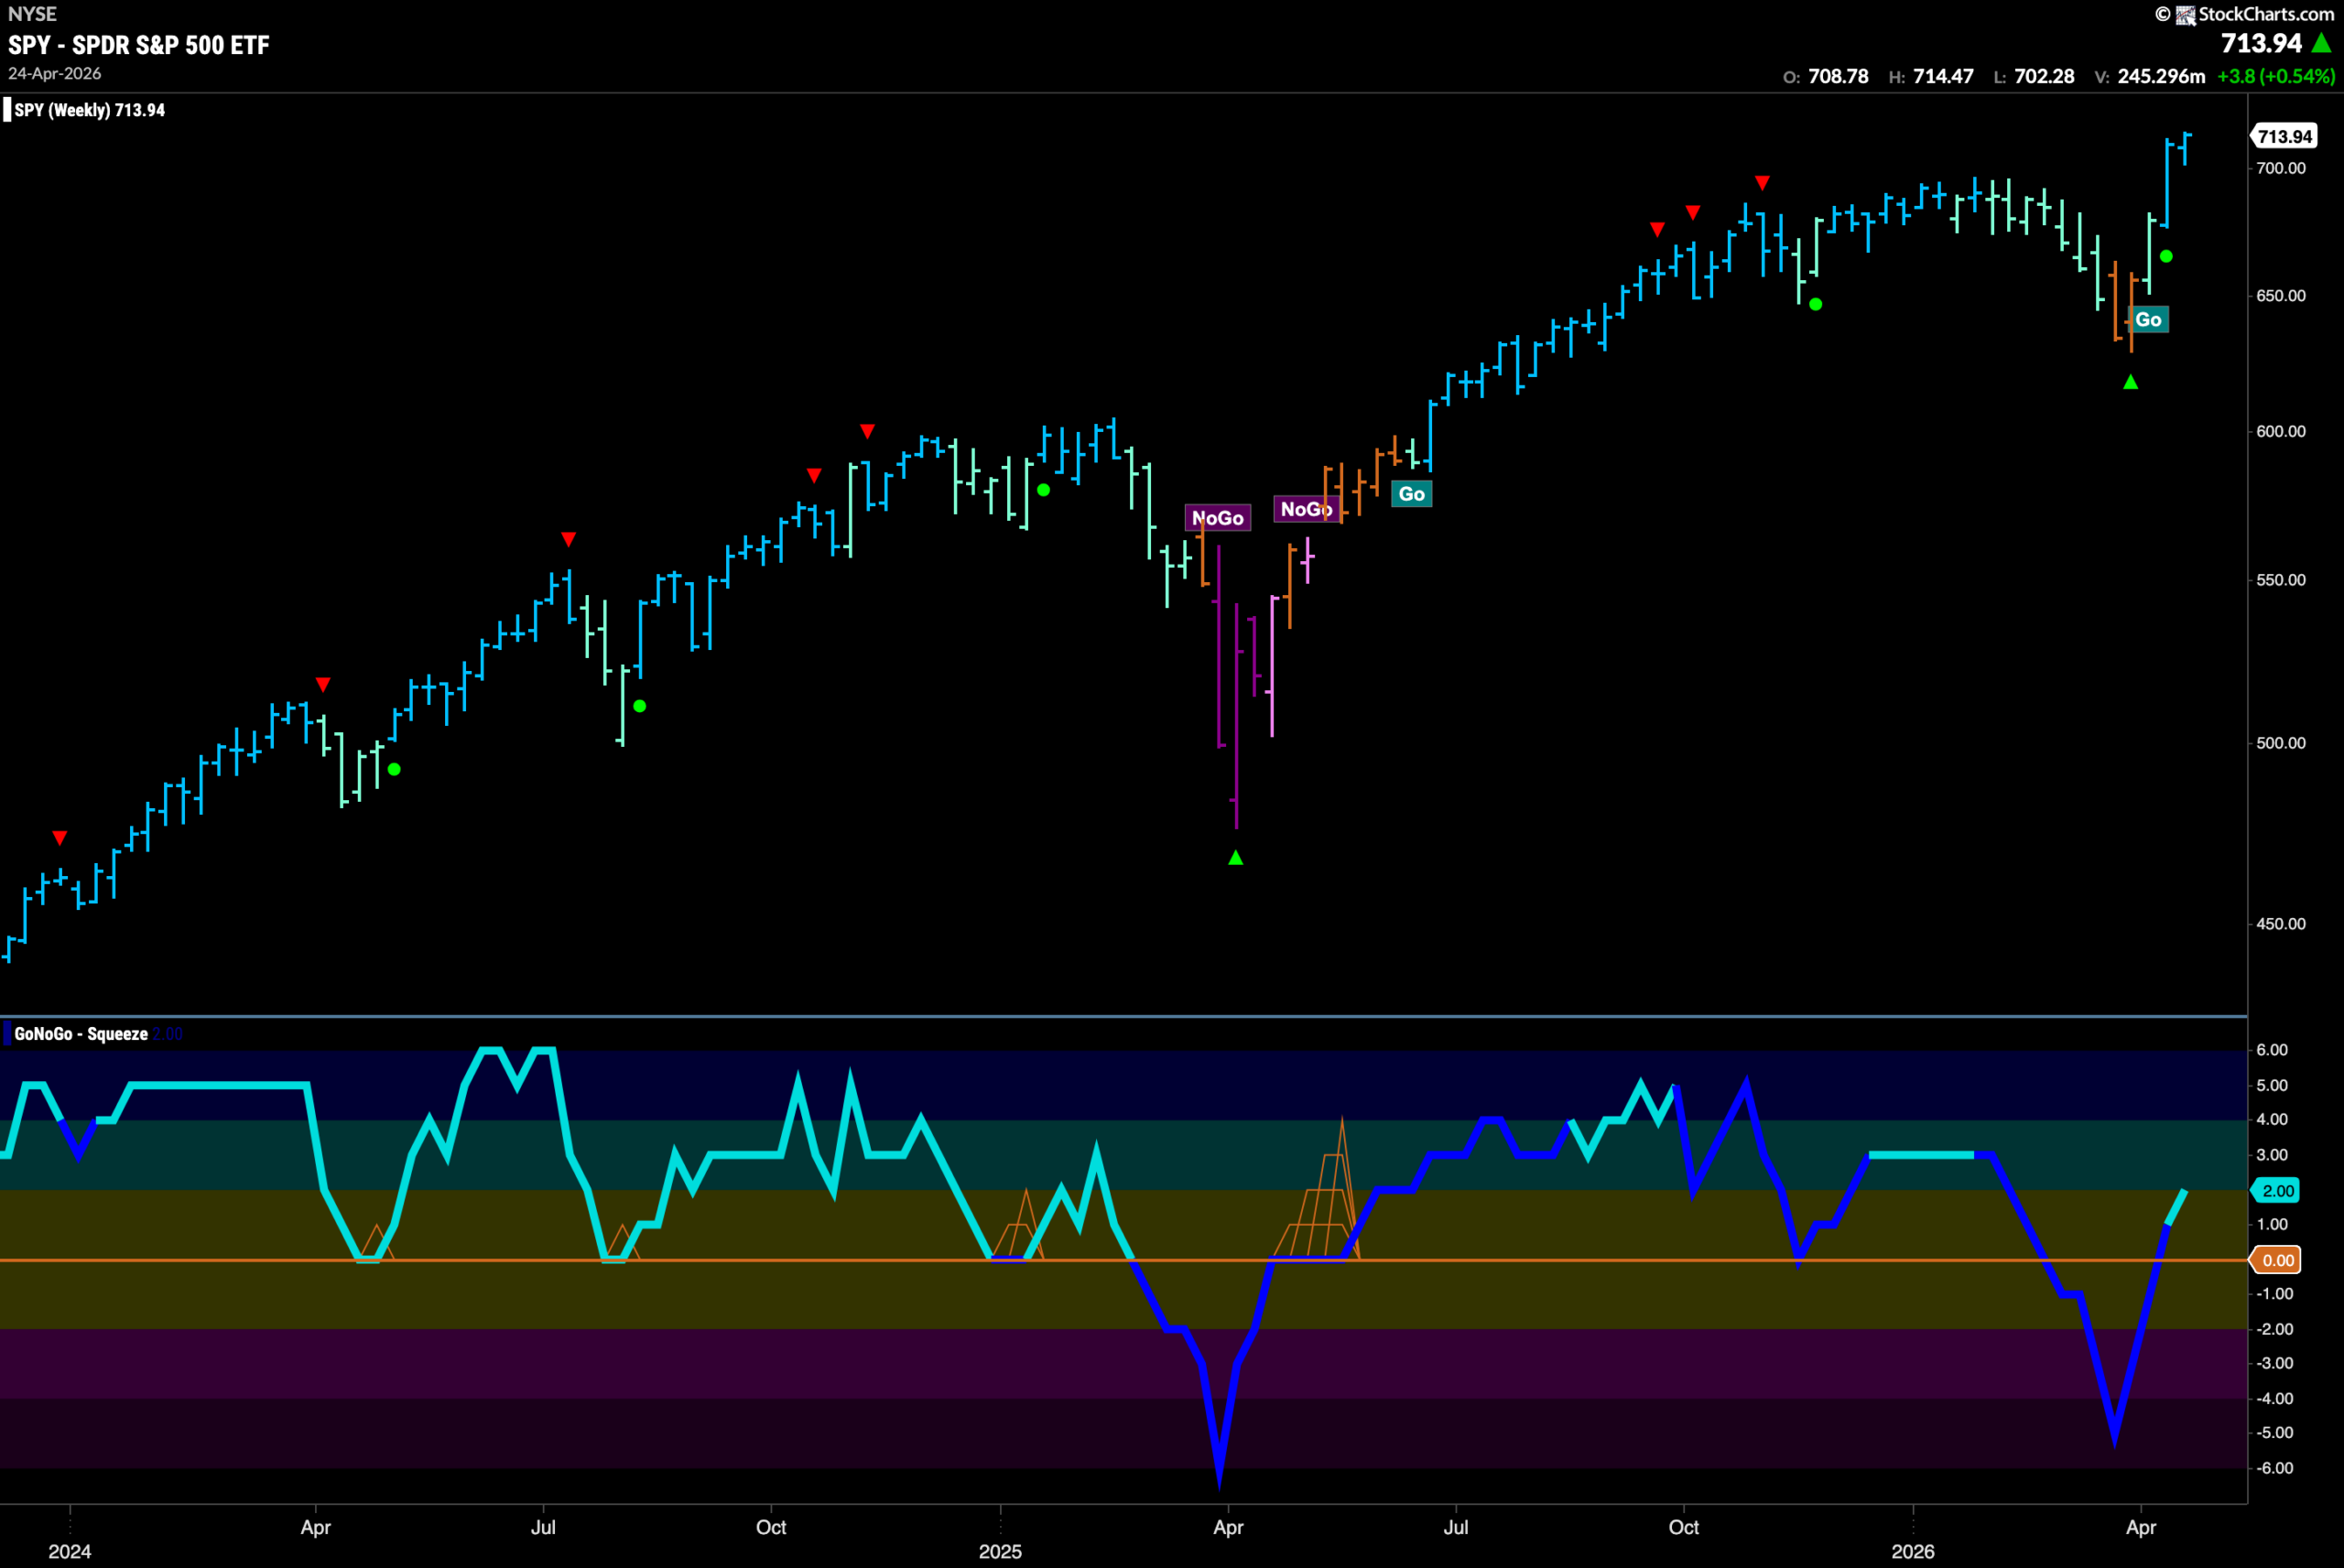
The weekly chart shows that the “Go” trend painted another bright blue bar at a new higher close as price followed through on the massive gains the week before. We see GoNoGo Oscillator has burst back through the zero line into positive territory and that tells us that momentum is once again aligned with the trend.
Treasury Rates See Strong Blue Bars Return
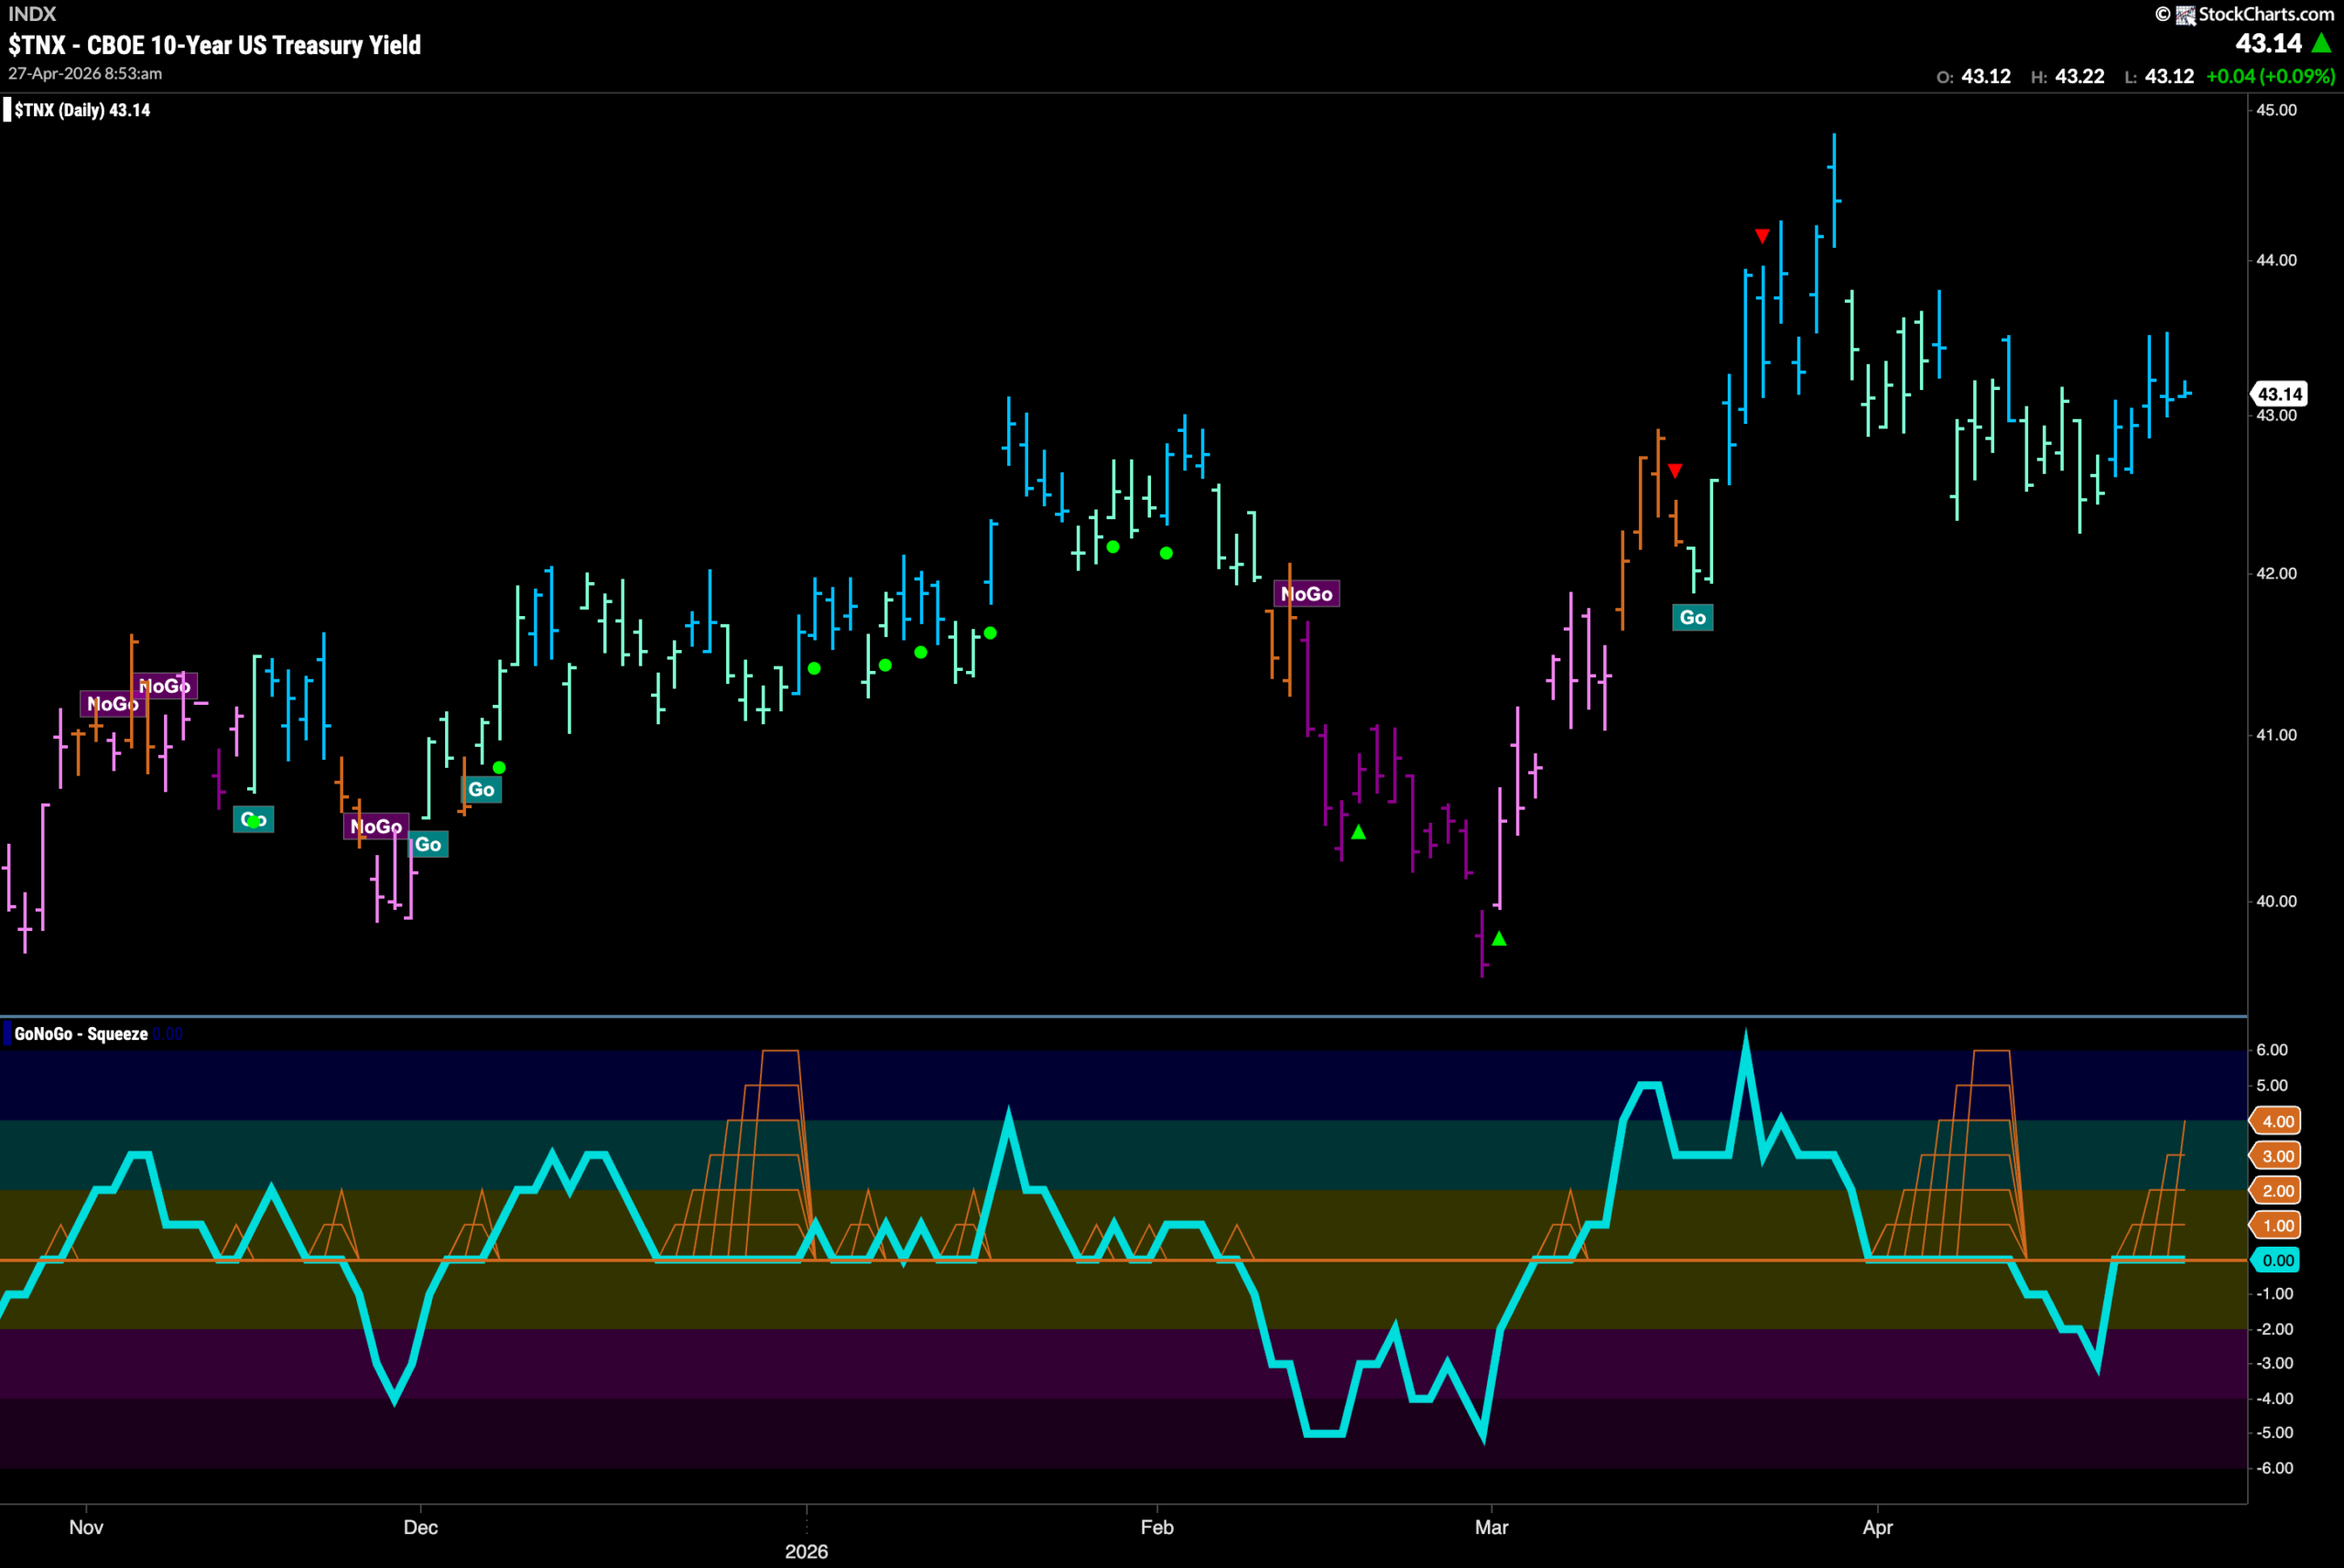
GoNoGo Trend shows that the “Go” trend remains in place for rates and we see the indicator returning to show strength with bright blue bars this past week. This comes as GoNoGo Oscillator tries to fight through the resistance it is finding at the zero line. We see another GoNoGo Squeeze building and we will watch to see if it can regain positive territory this week.
Dollar ($UUP) Sees Market Uncertainty
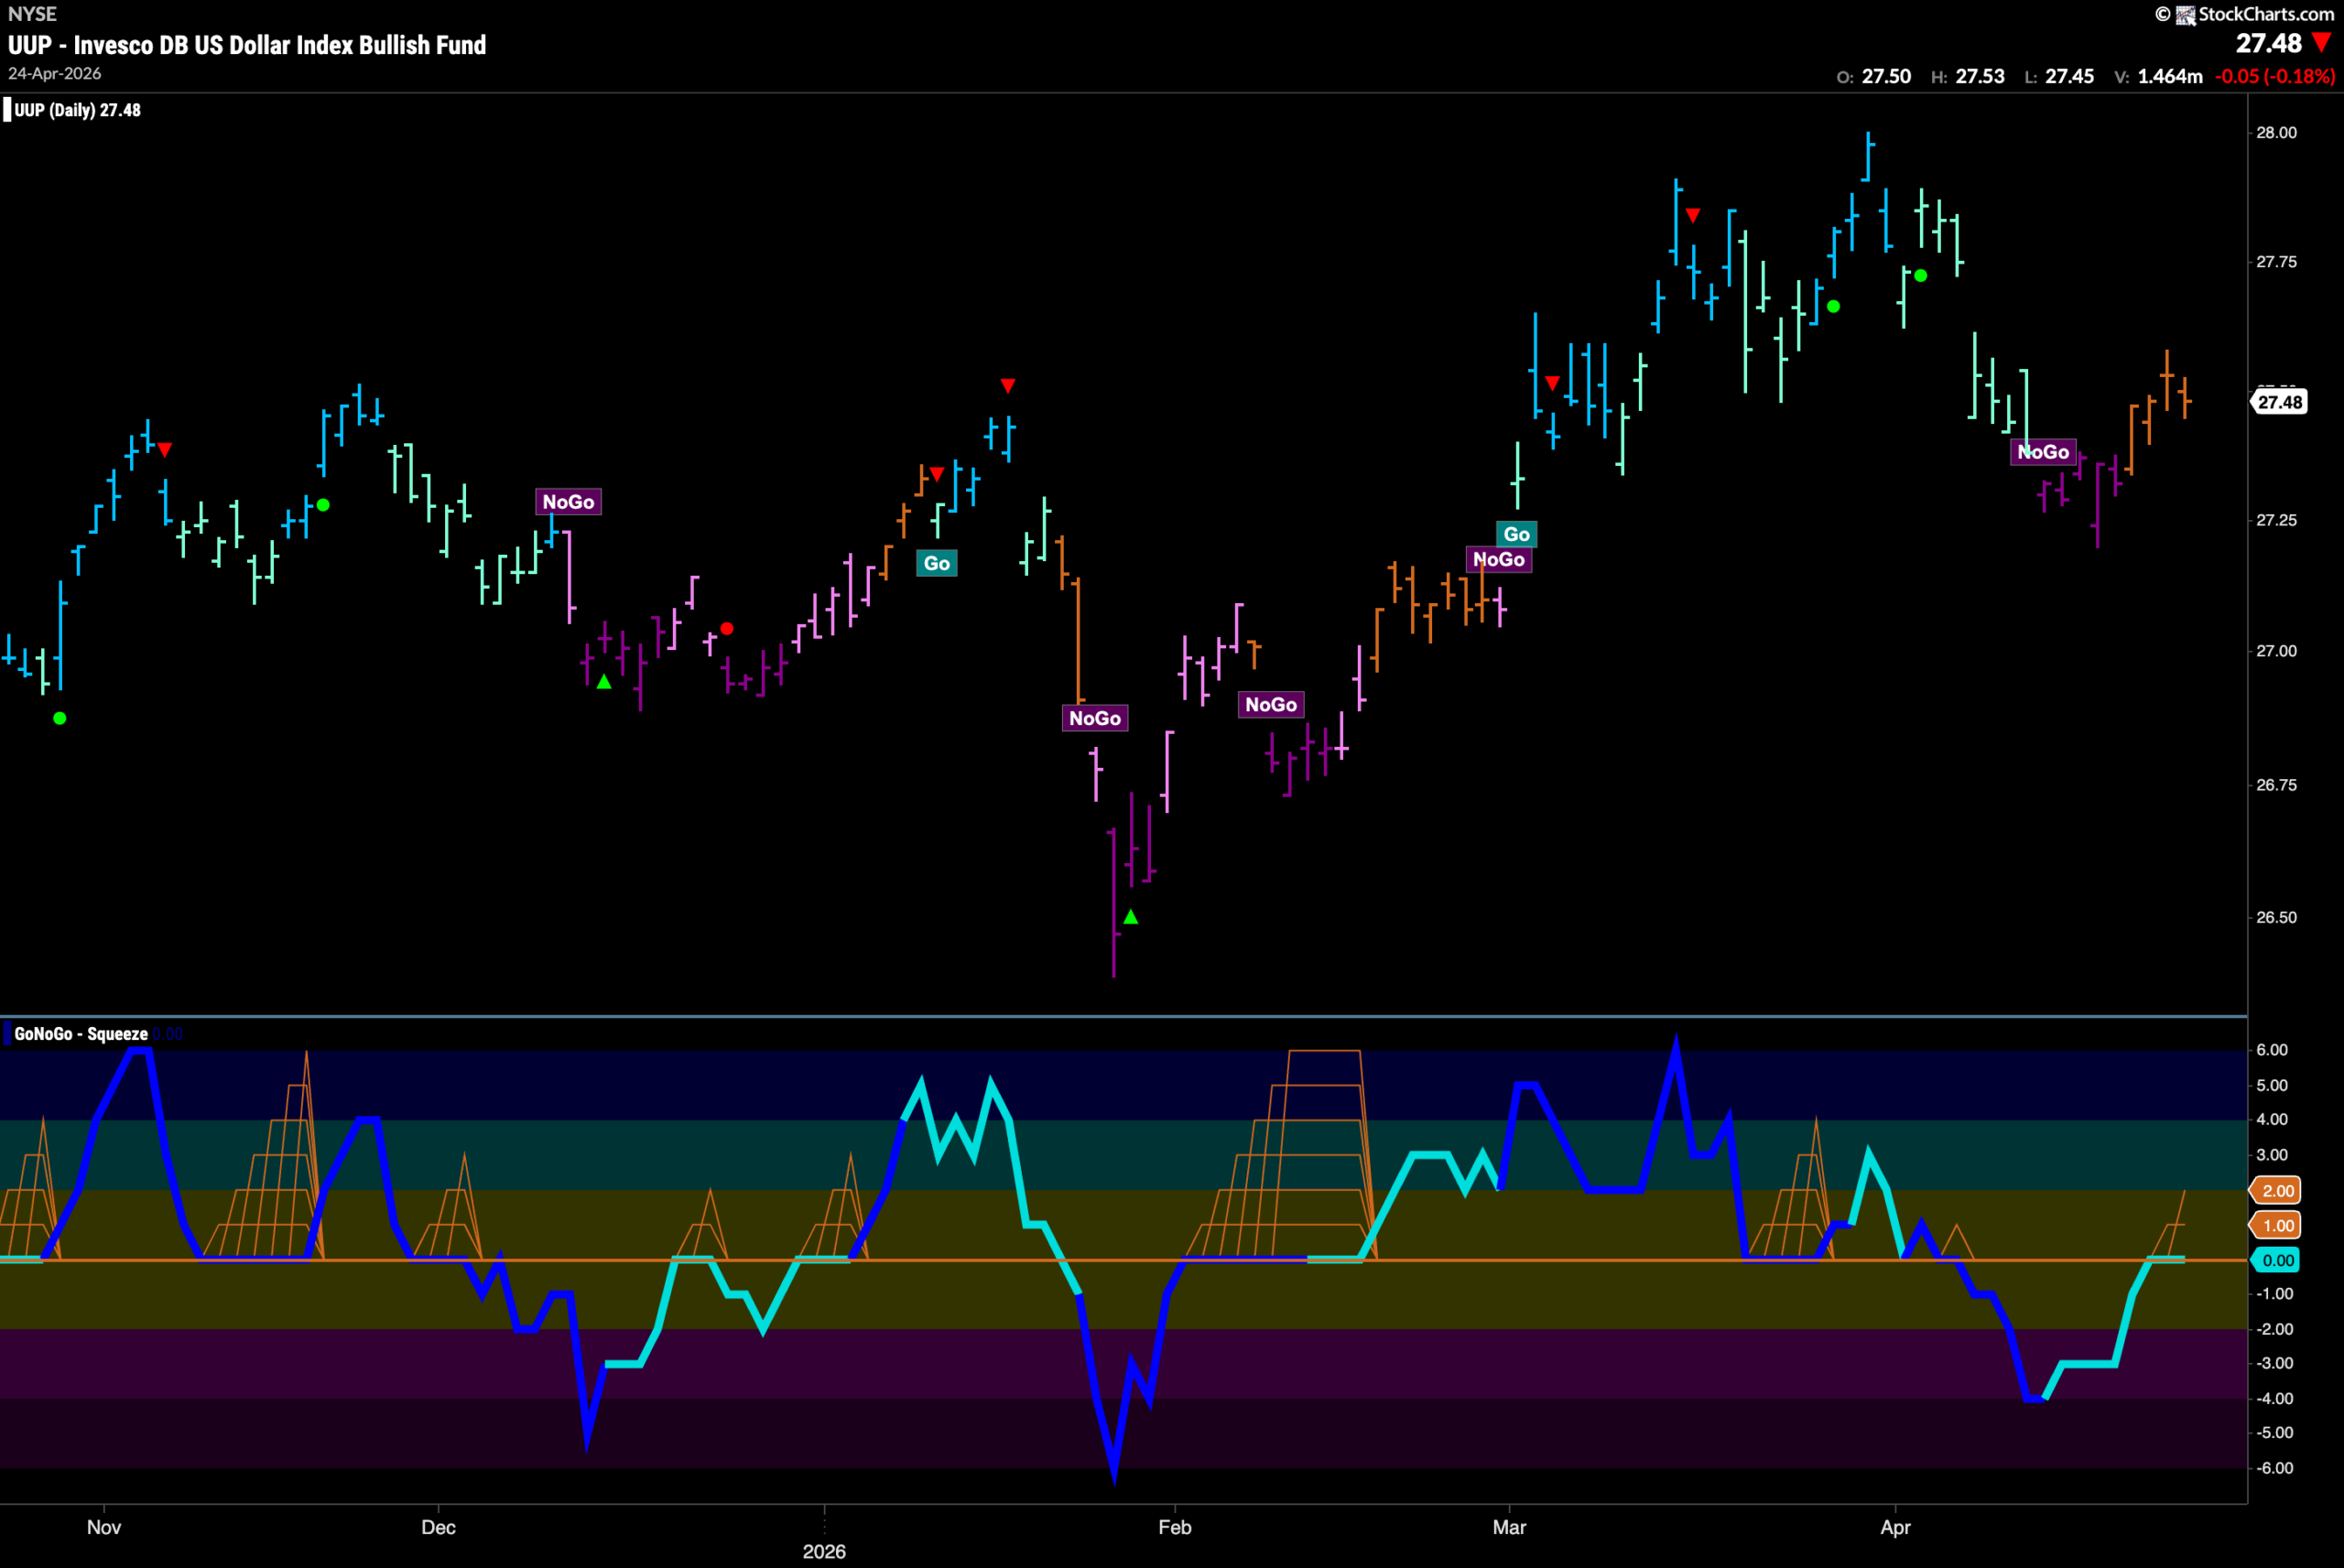
The chart below shows that the trend in the dollar reflects market uncertainty this week as GoNoGo Trend paints a string of amber “Go Fish” bars. This tells us that not enough criteria are being met in order to paint a trend in either direction. GoNoGo Oscillator is also testing the zero line from below. We will pay close attention to the oscillator panel. Should it break back into positive territory this would perhaps give price a boost to go higher.
Oil ($USO) Sees Strong “Go” Bars Return
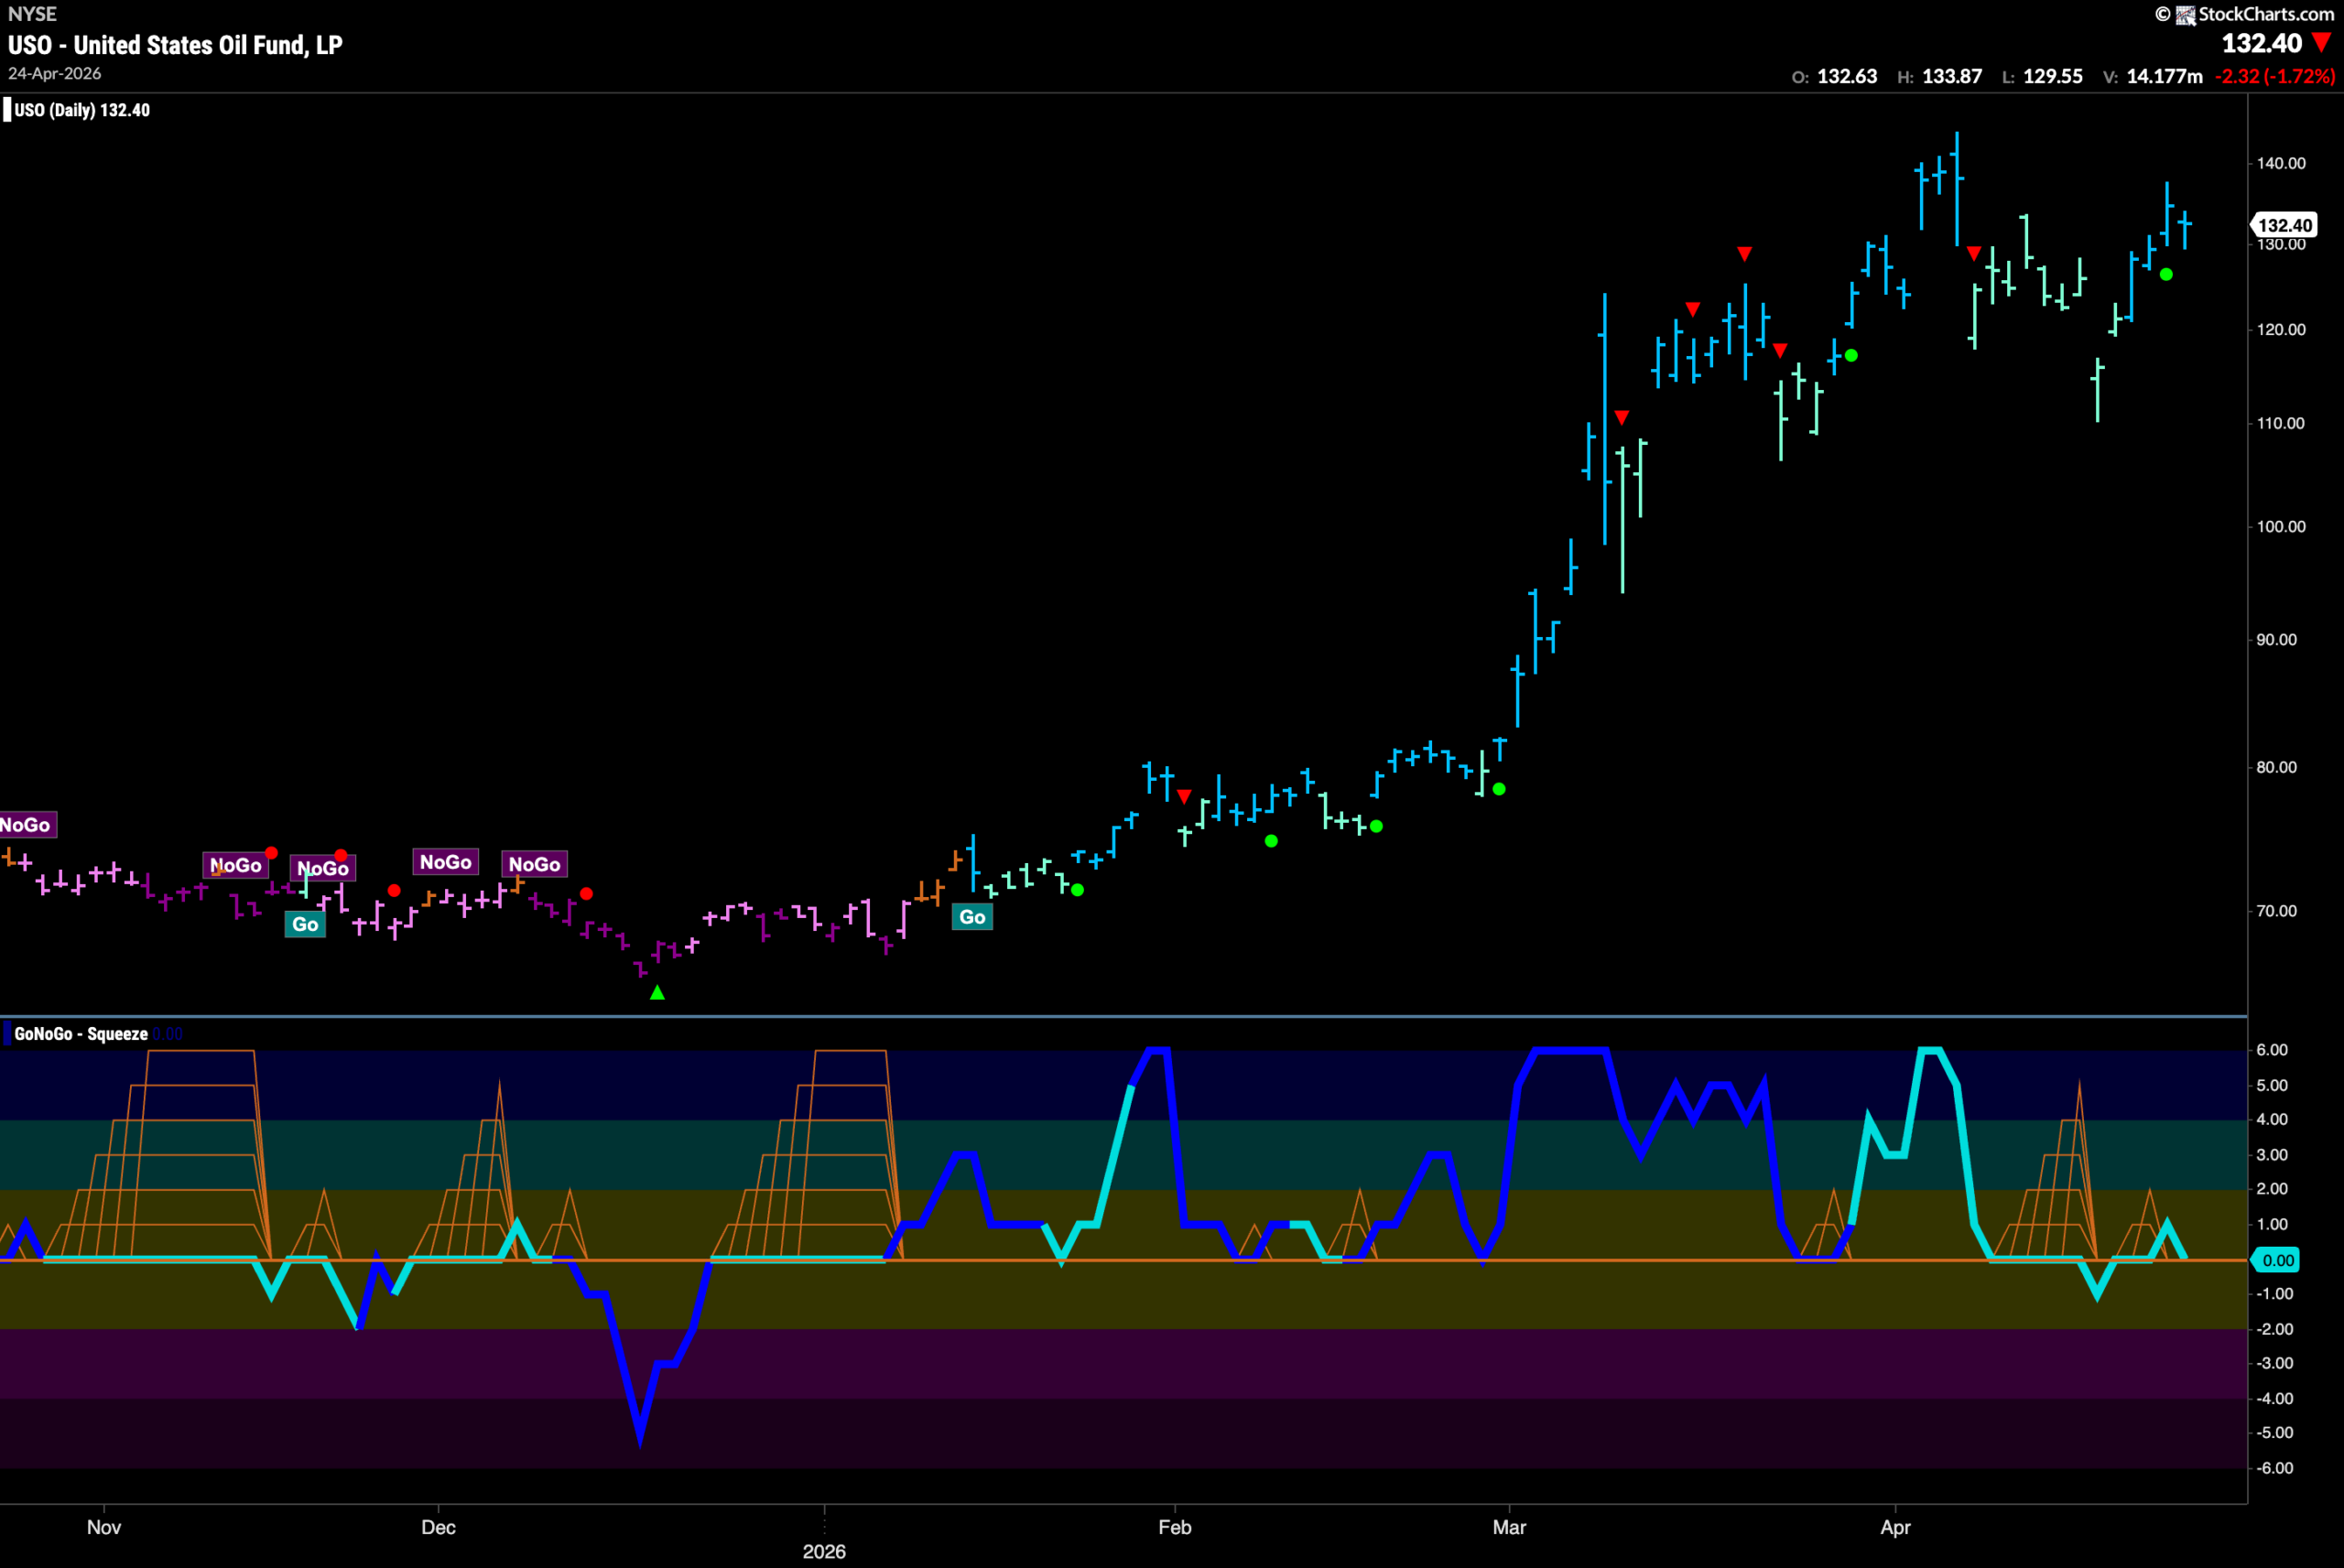
GoNoGo Trend shows that the “Go” trend continues for another week and the indicator shows strength as it paints consecutive bright blue bars. GoNoGo Oscillator has also crept back into positive territory and that triggered a Go Trend Continuation Icon (green circle) under the price bar. This indicates resurgent momentum in the direction of the “Go” trend. We will look to see if the oscillator can continue to find support at zero. If it does, we would look for price to mount an attack on a new high.
Gold ($GLD) Rolls Over in “NoGo” Trend
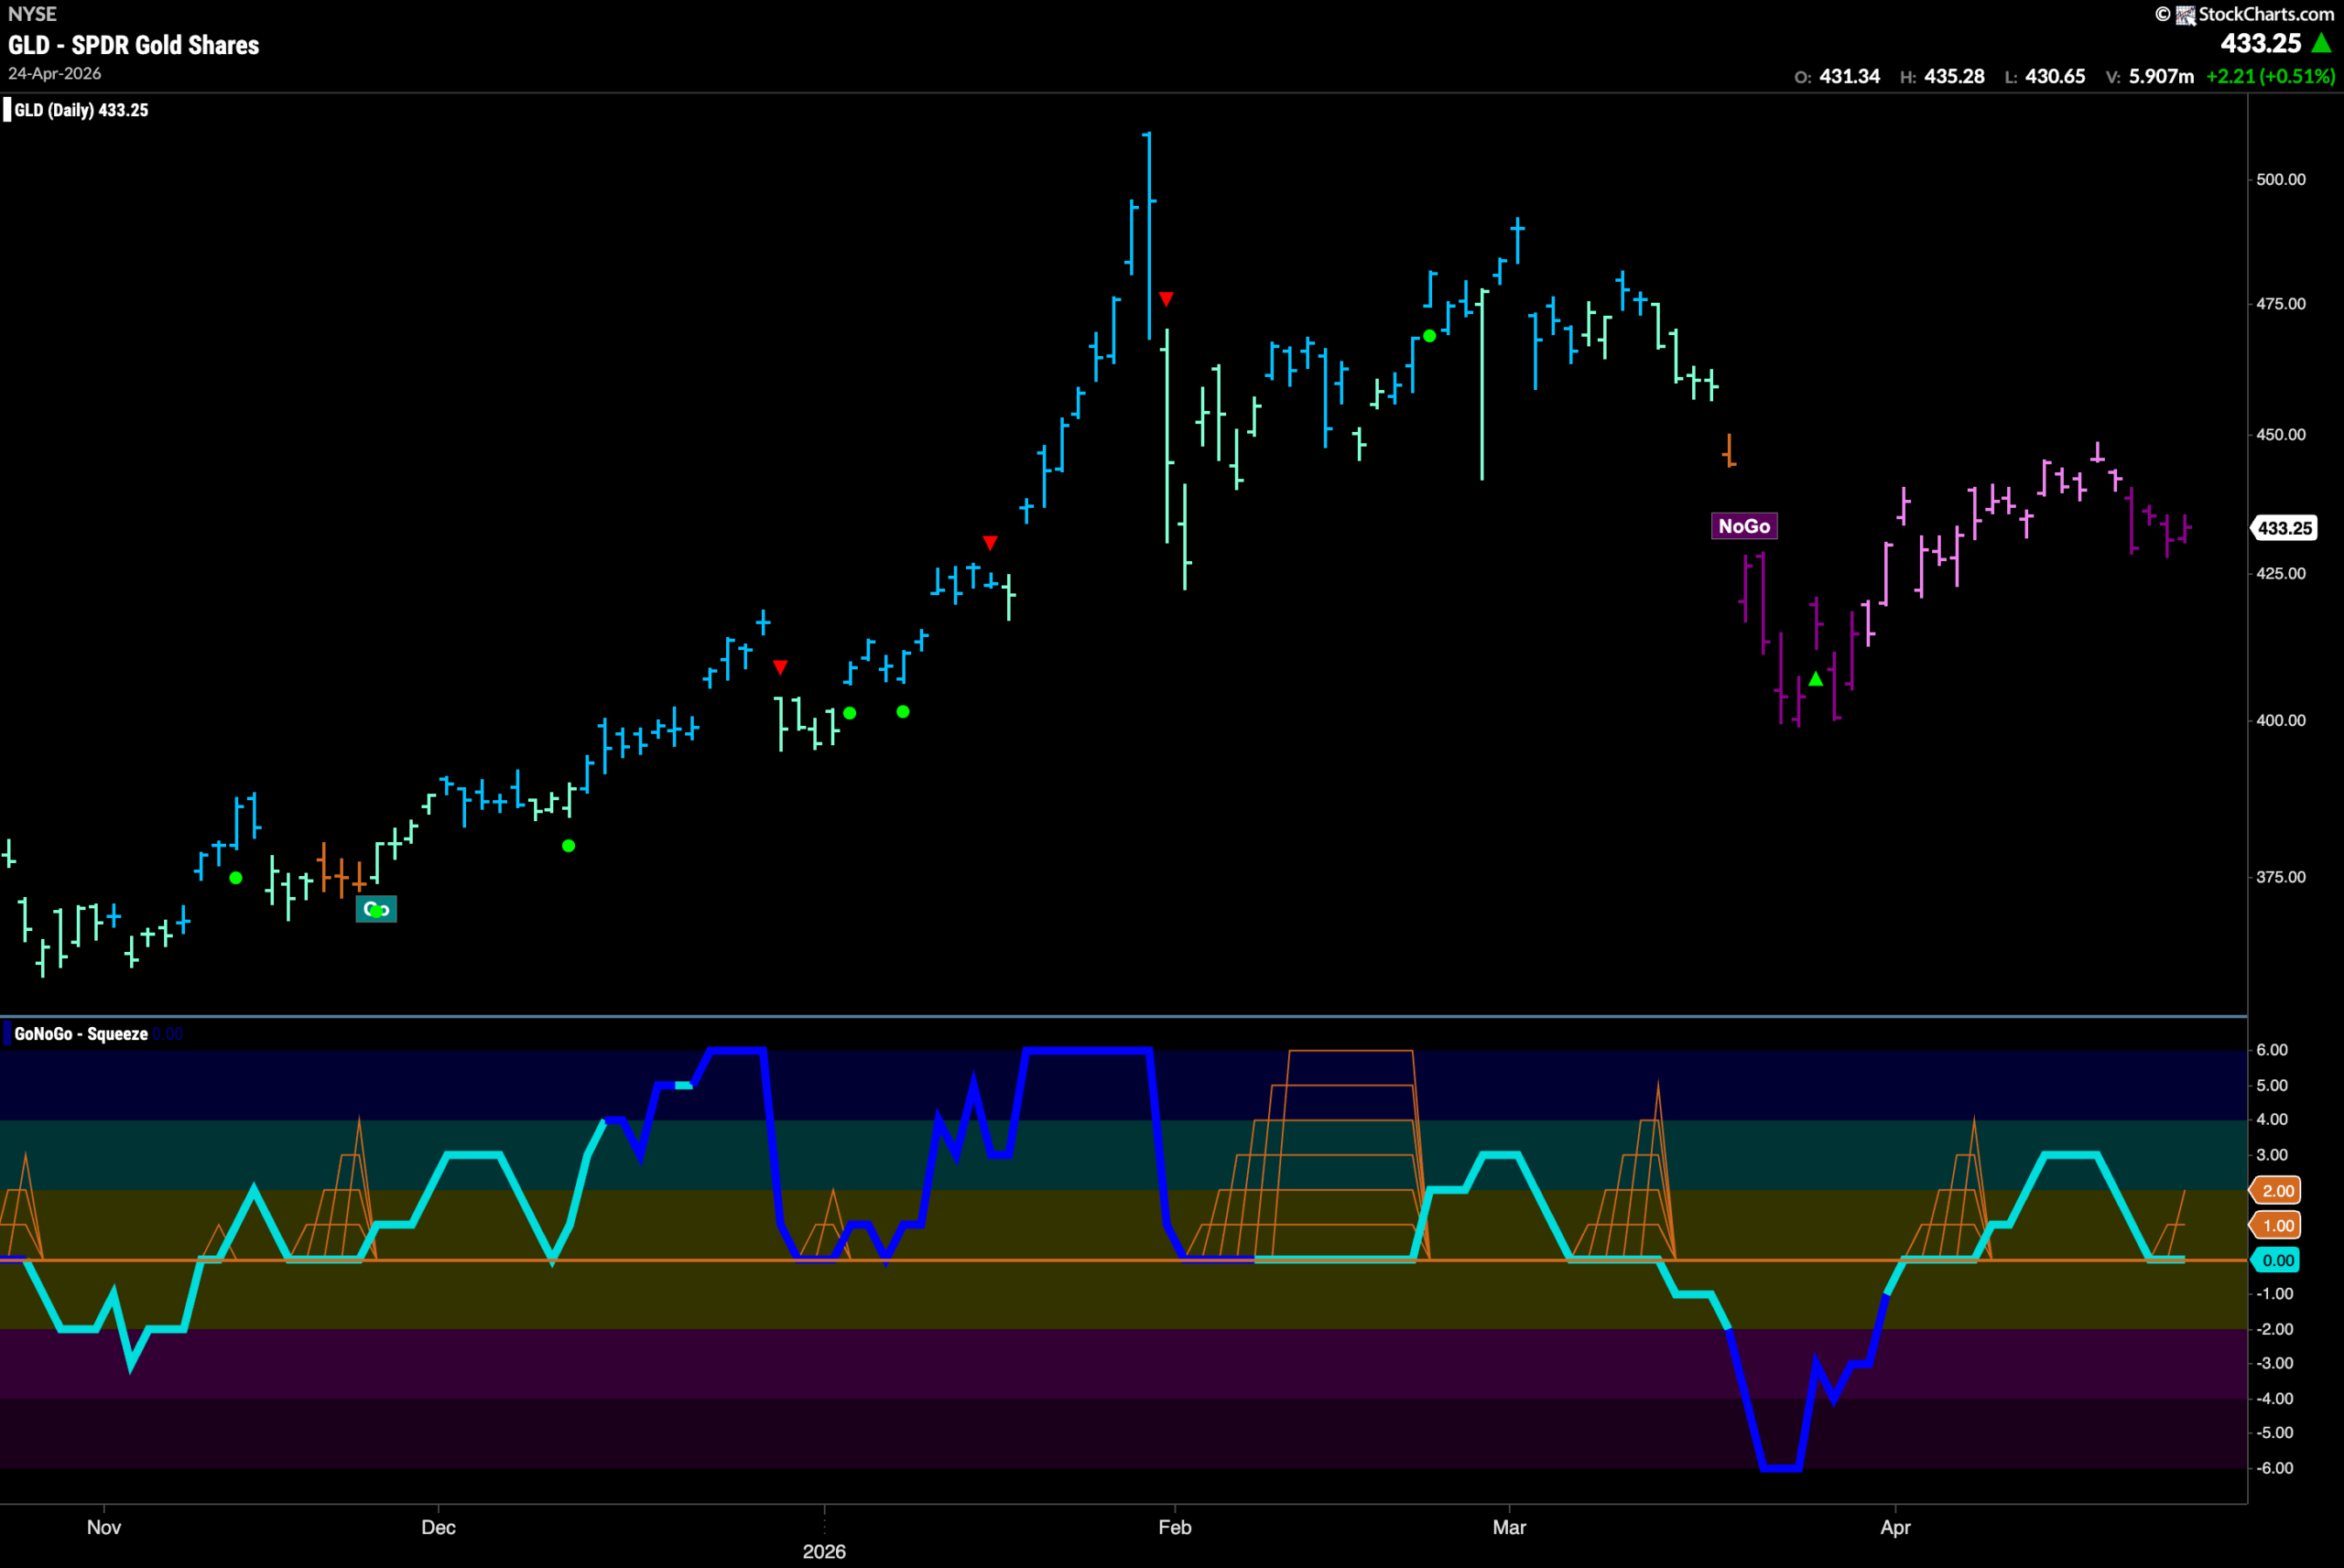
Gold remains in the “NoGo” Trend and we saw strength return as GoNoGo Trend paints strong purple bars after price set a new lower high. We see that GoNoGo Oscillator is testing the zero line from above. It will be important to watch to see if it finds support at this level or if it breaks back into negative territory in the coming days.
Sector RelMap
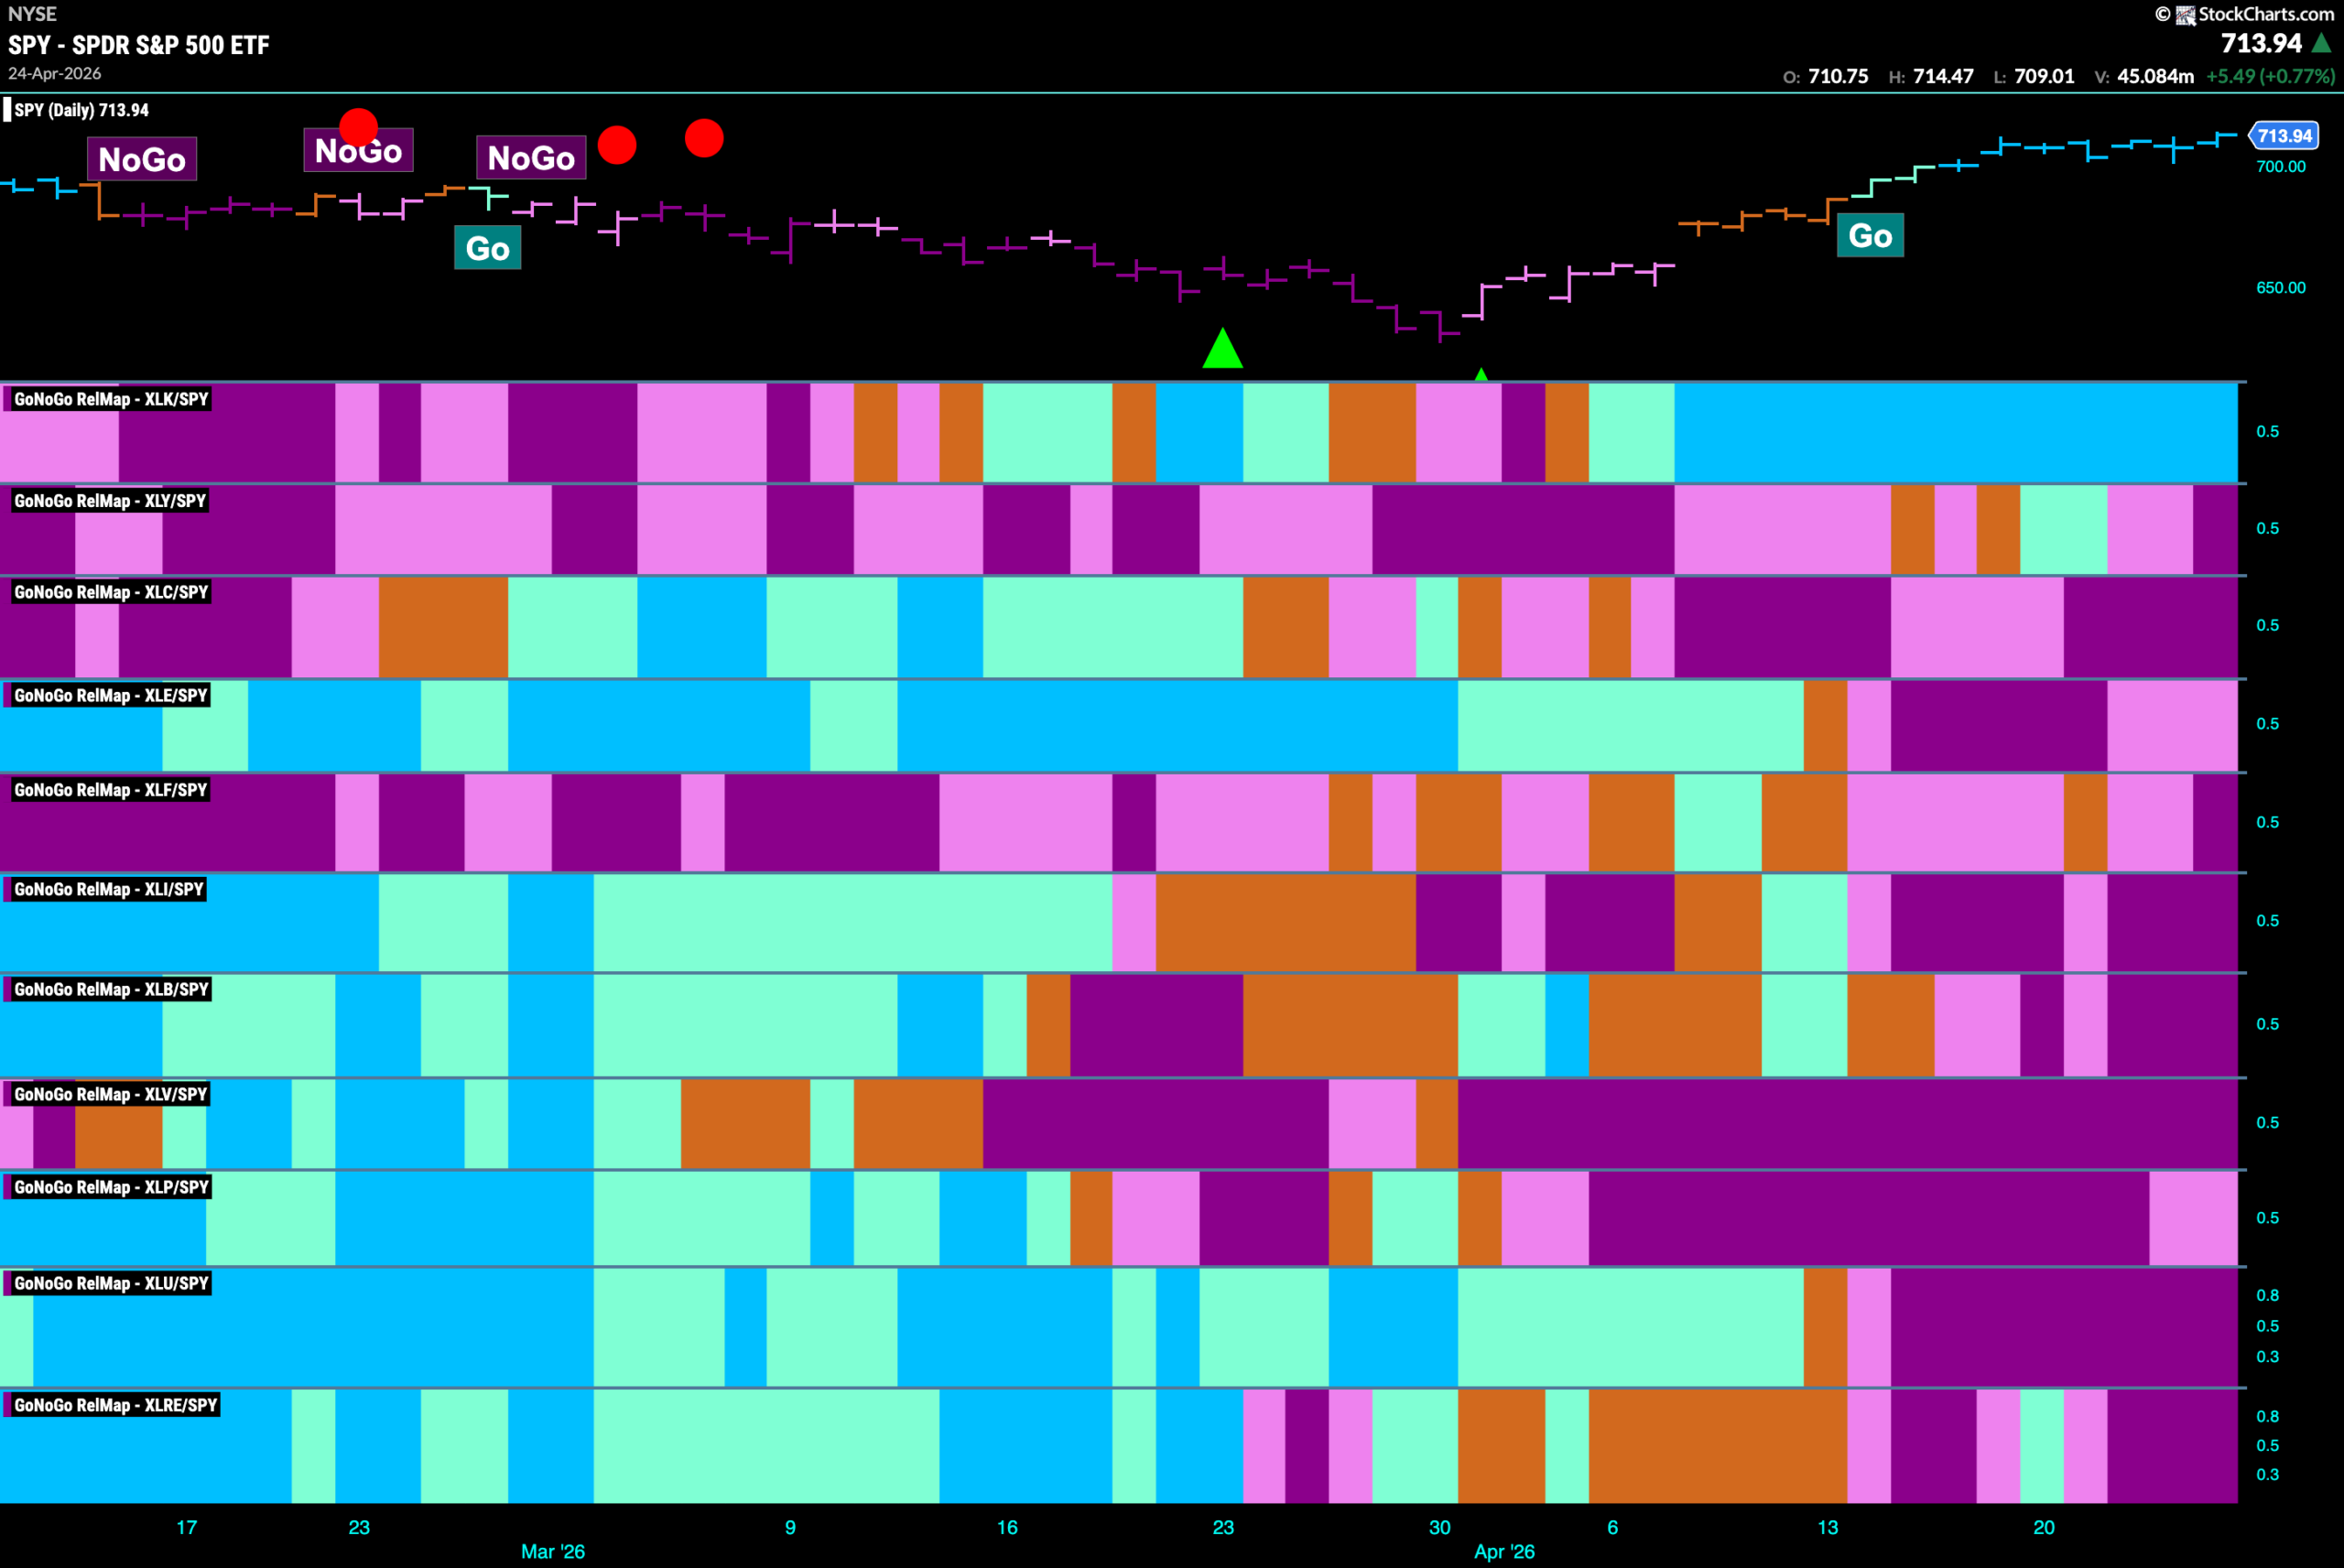
Below is the GoNoGo Sector RelMap. This GoNoGo RelMap applies the GoNoGo Trend to the relative strength ratios of the sectors to the base index. With this view we can get a sense of the relative out performance and relative underperformance of the sectors. 1 sector is in a relative “Go” trend. $XLK, is painting relative “Go” bars.
Technology Sub-Group RelMap
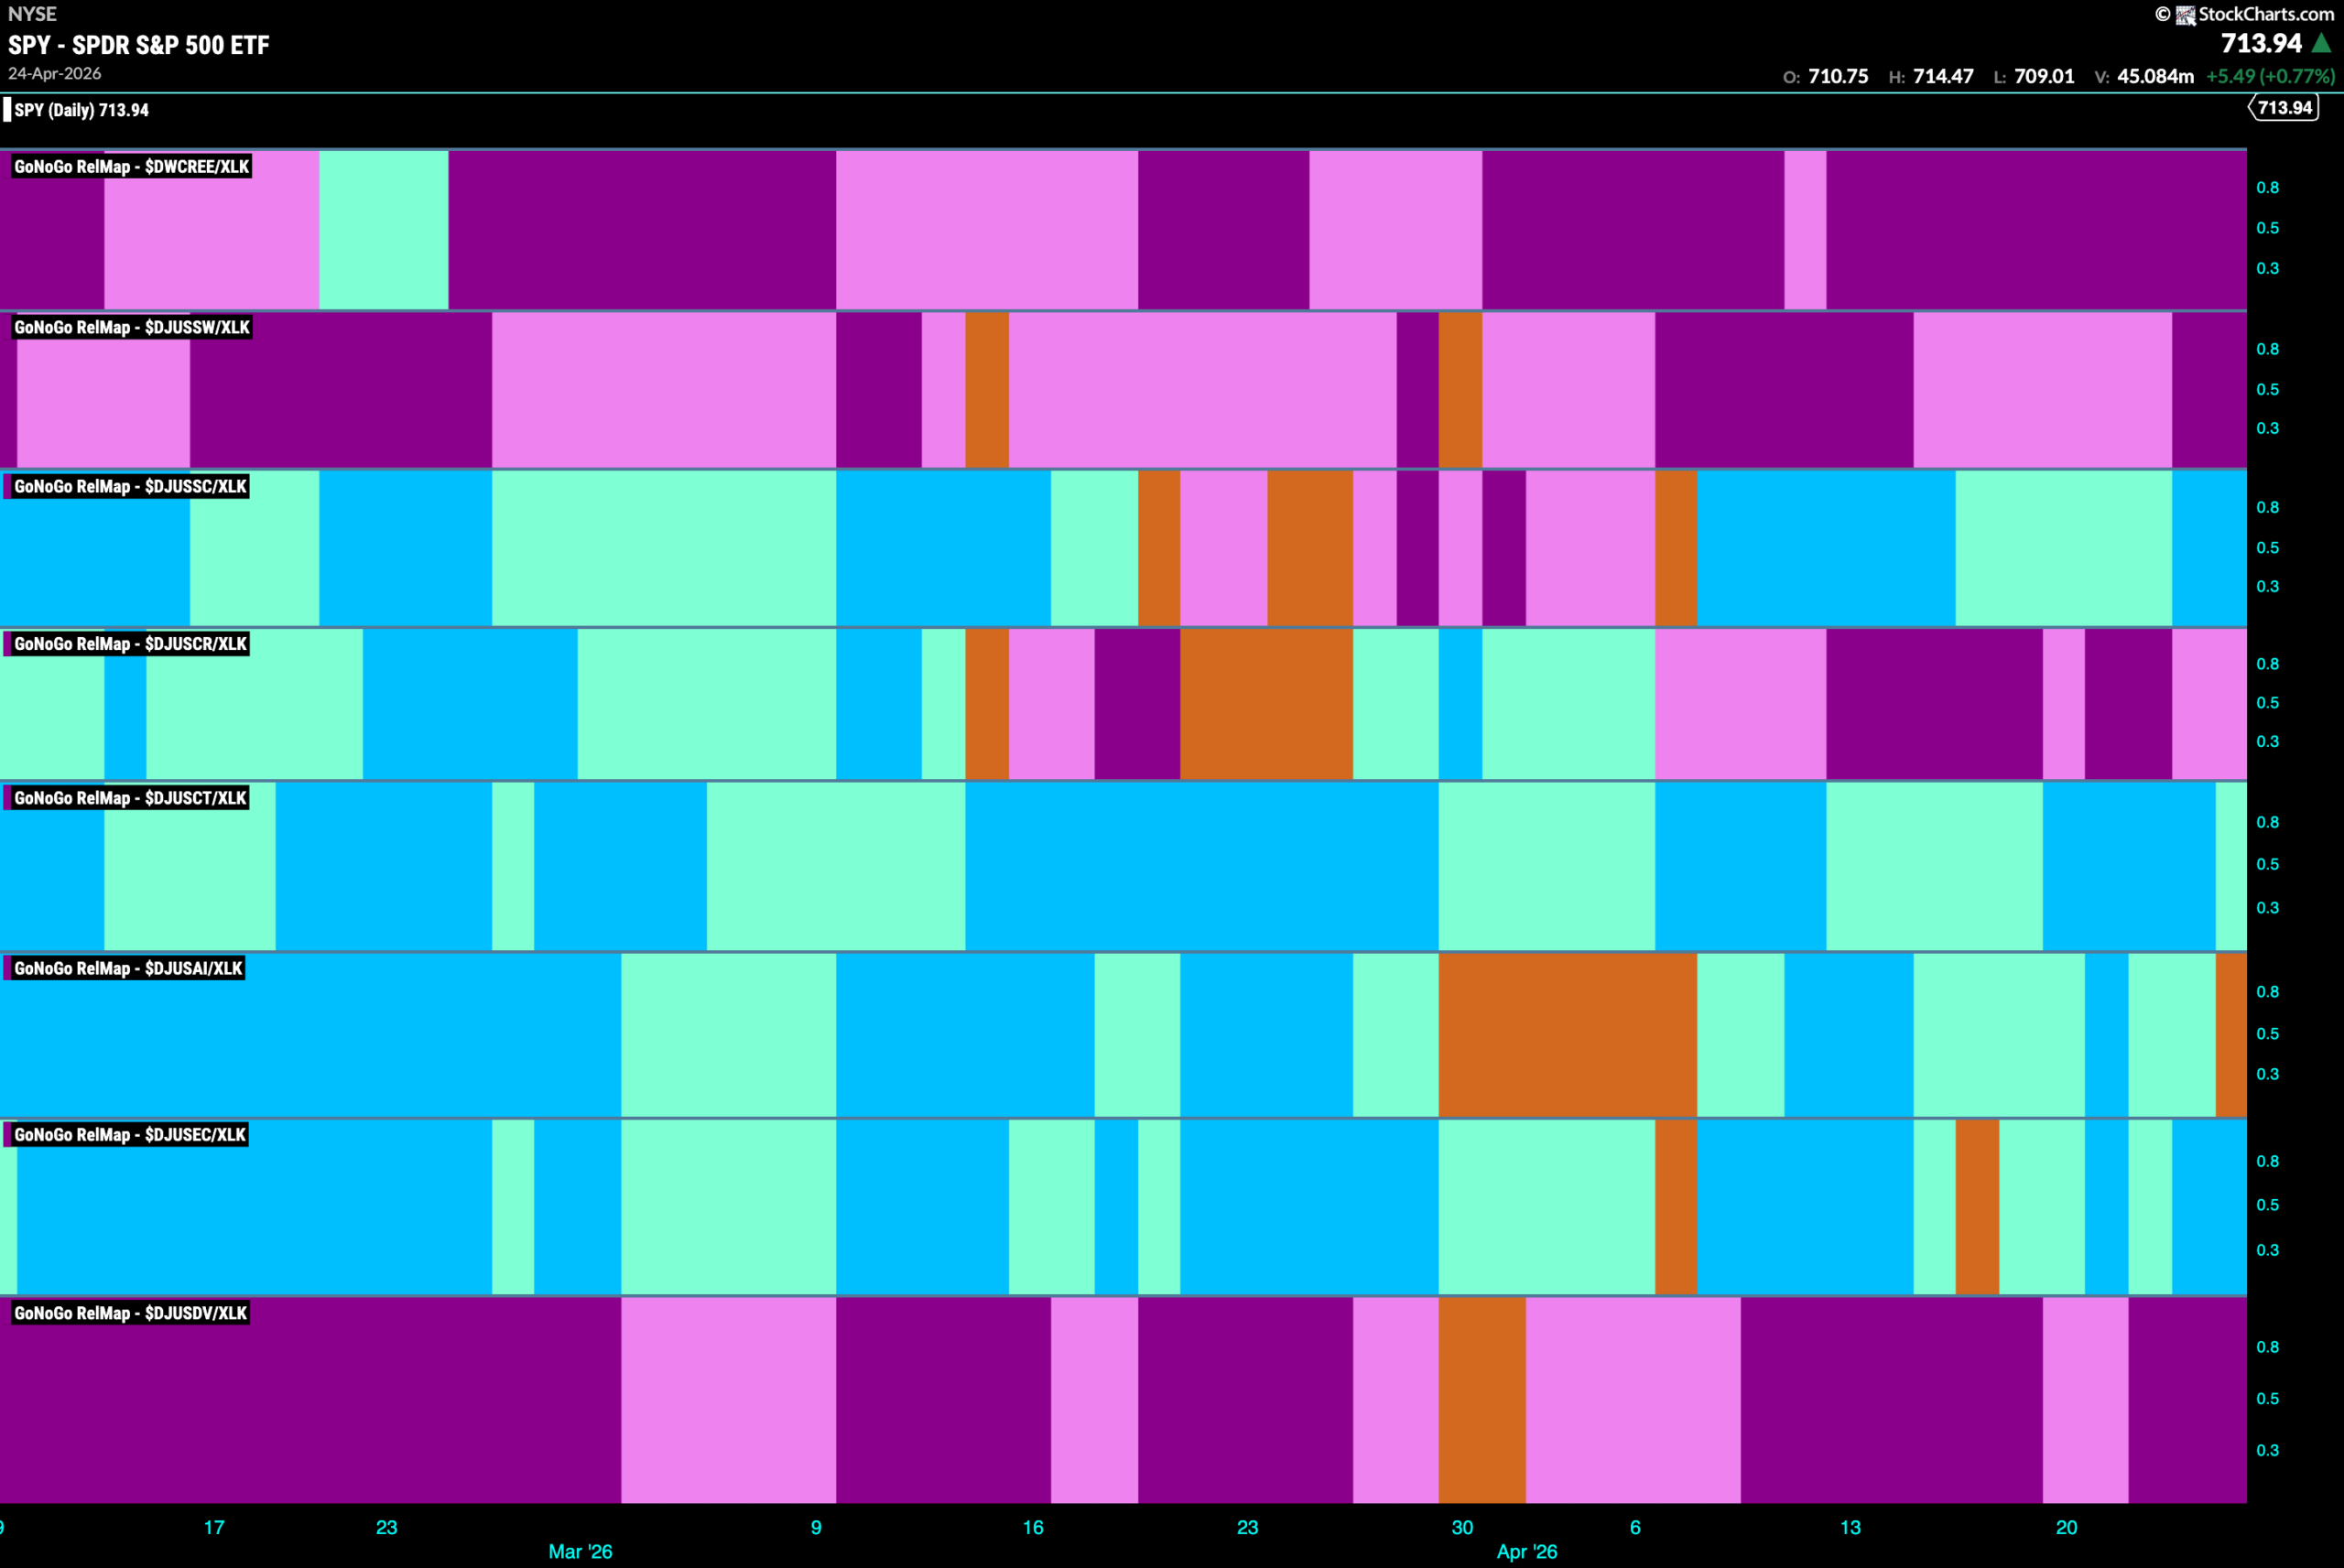
The chart below shows a relative trend breakdown of the sub groups within the technology sector again this week. The Sub-Group RelMap plots the GoNoGo Trend of each sub index to the $XLK. We saw in the above GoNoGo Sector RelMap that $XLK continues to outperform and paints strong relative “Go” bars. When we look at the below RelMap we can see that the telecommunications index in the fifth panel continues to paint “Go” bars on a relative basis.
$GLW Looks Ready for New Highs
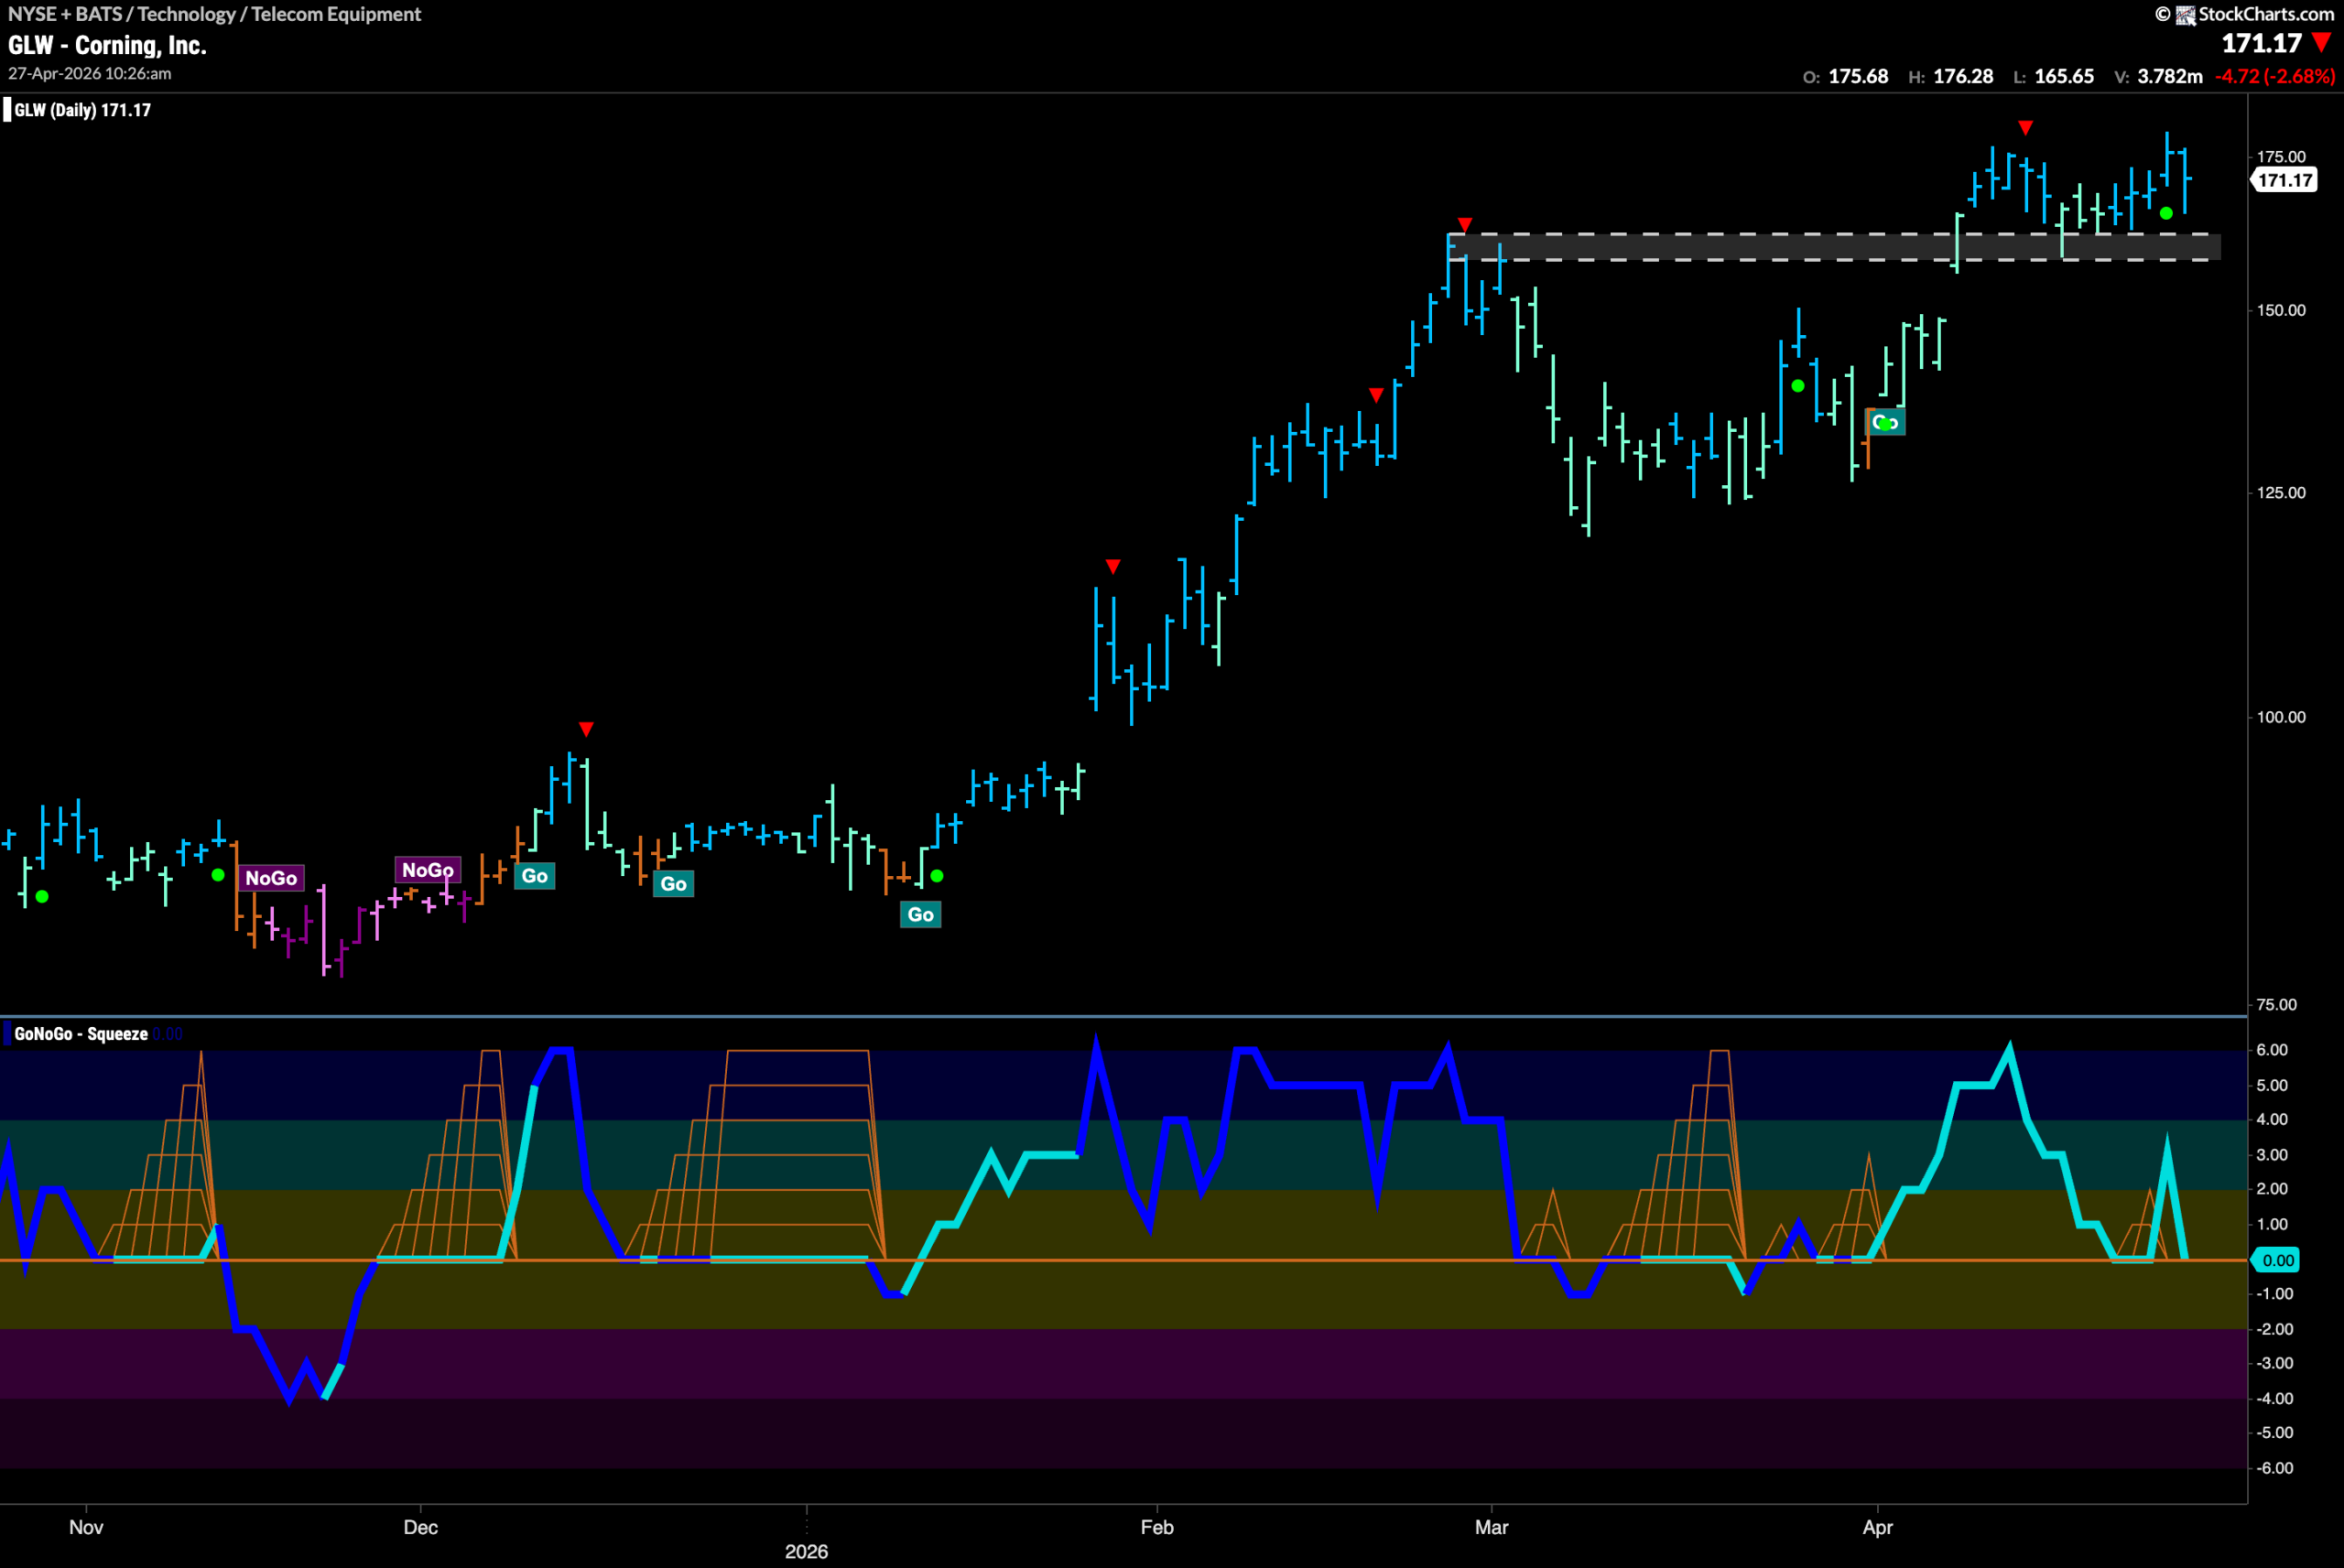
A week ago we noted that $GLW was looking for support having made a new higher high. We see that this past week the trend remained strong and support was found. GoNoGo Oscillator tested the zero line and bounced into positive territory and that triggered a Go Trend Continuation Icon (green circle) under the price bar. We will watch to see if this gives price the boost it needs to set a new higher high this week.
$LITE Looks for Support at Elevated Levels
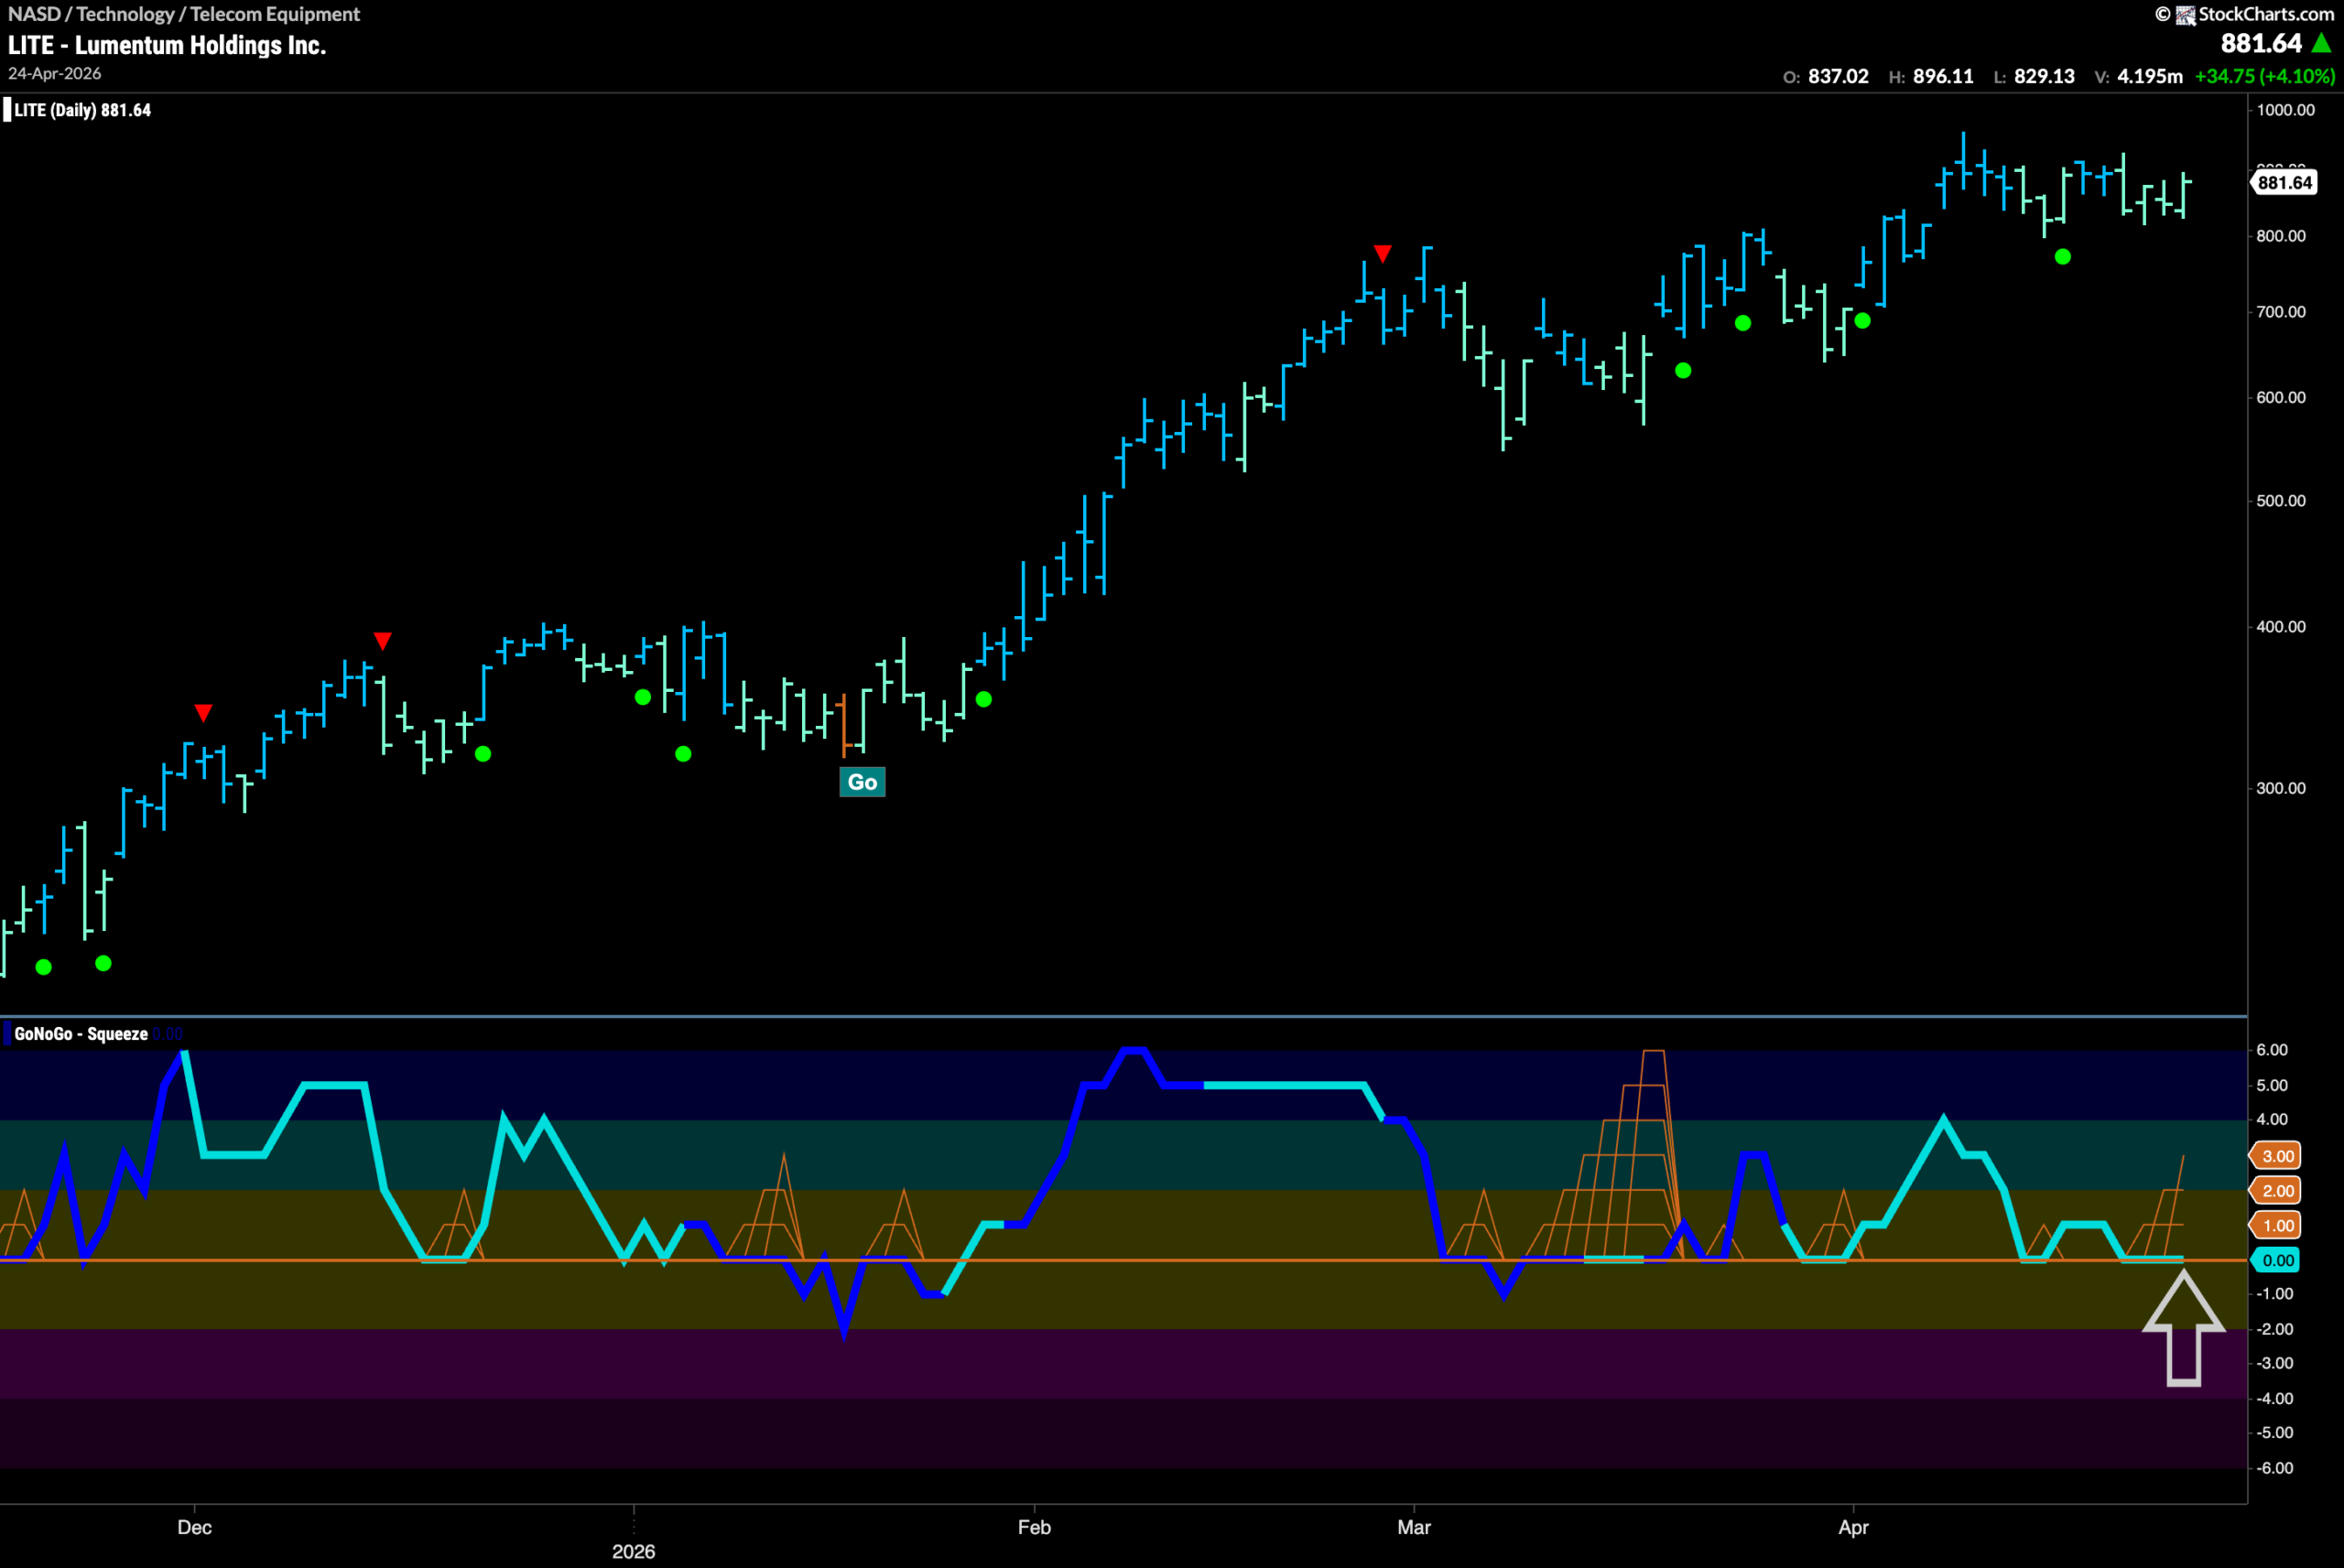
$LITE has been in a strong “Go” trend for several months. We have seen a series of higher highs and higher lows as GoNoGo Oscillator has been primarily at or above the zero line confirming the trend in price. Now, after another higher high, we see some price weakness as GoNoGo Trend paints weaker aqua bars. Looking at the oscillator panel, we see that GoNoGo Oscillator has fallen to test the zero line from above. We will watch to see if it finds support again at this level. If it does, then we could expect price to make an attempt at a new higher high.