Good morning and welcome to this week’s Flight Path. The equity trend was strong again this week and we saw another week of bright blue “Go” bars and price soaring to another higher high. Treasury bond prices remained in the “NoGo” trend but the indicator paints consecutive weak pink bars. U.S. commodities have been in a “Go” trend for several months now and after a few bars of weakness we saw strength return as the indicator moved from aqua to a strong blue “Go” bar. The dollar shows nothing but strong “NoGo” bars this week as the trend takes hold.
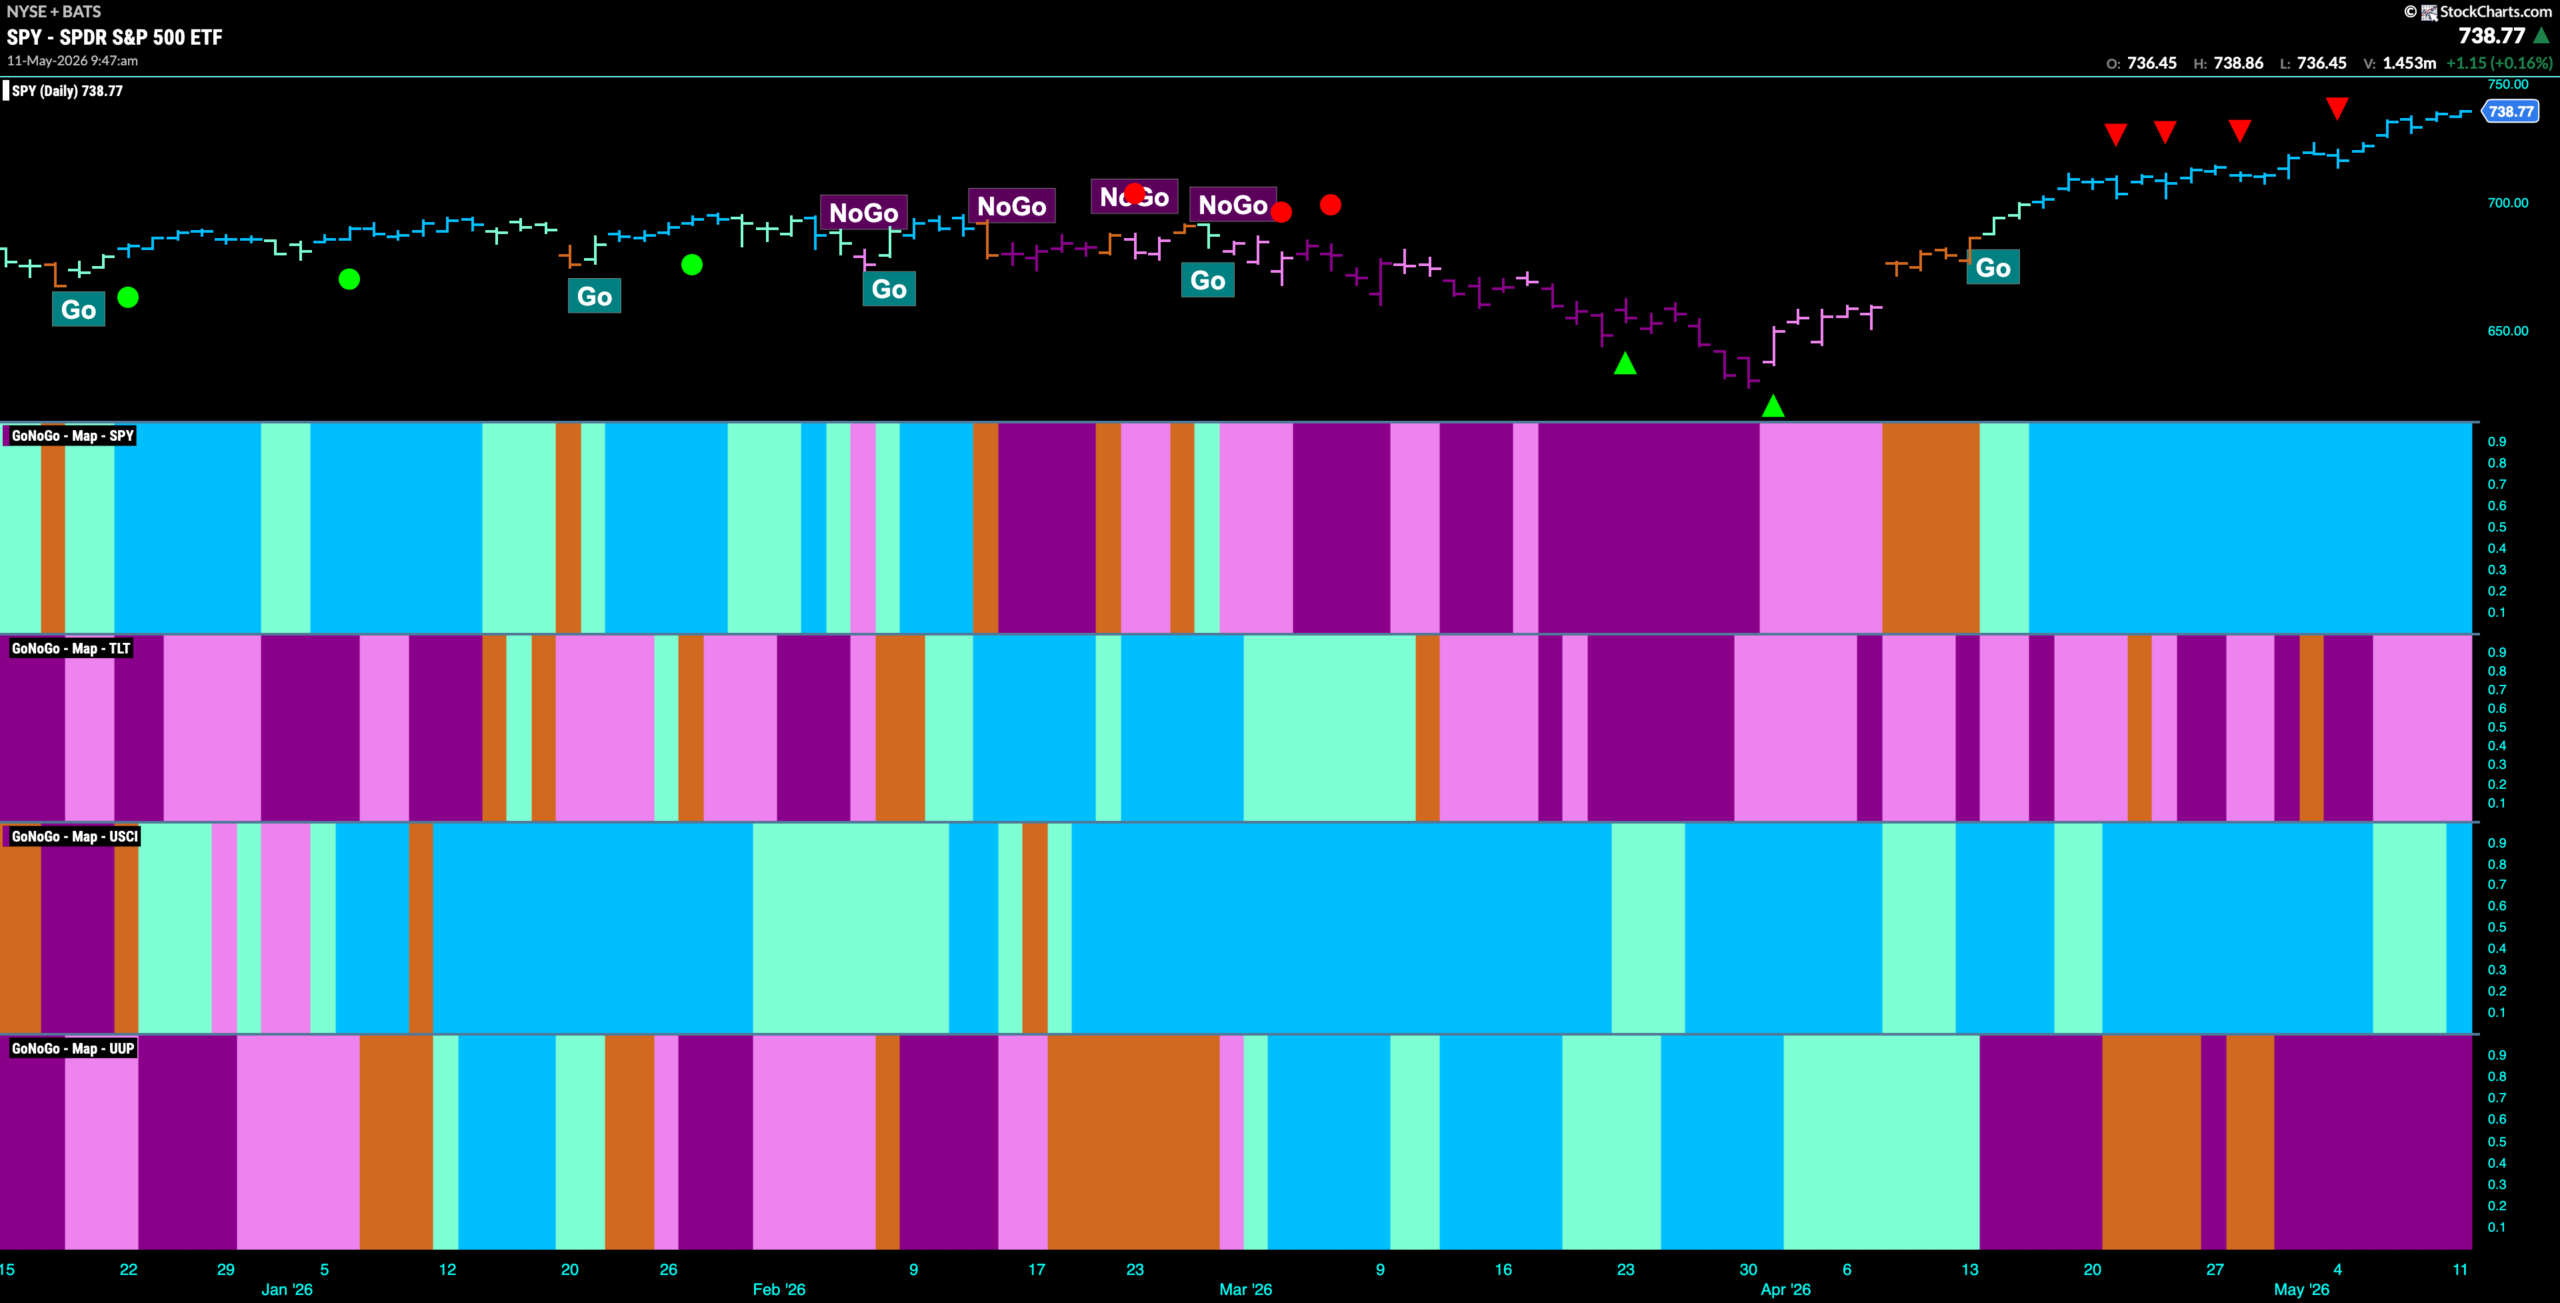
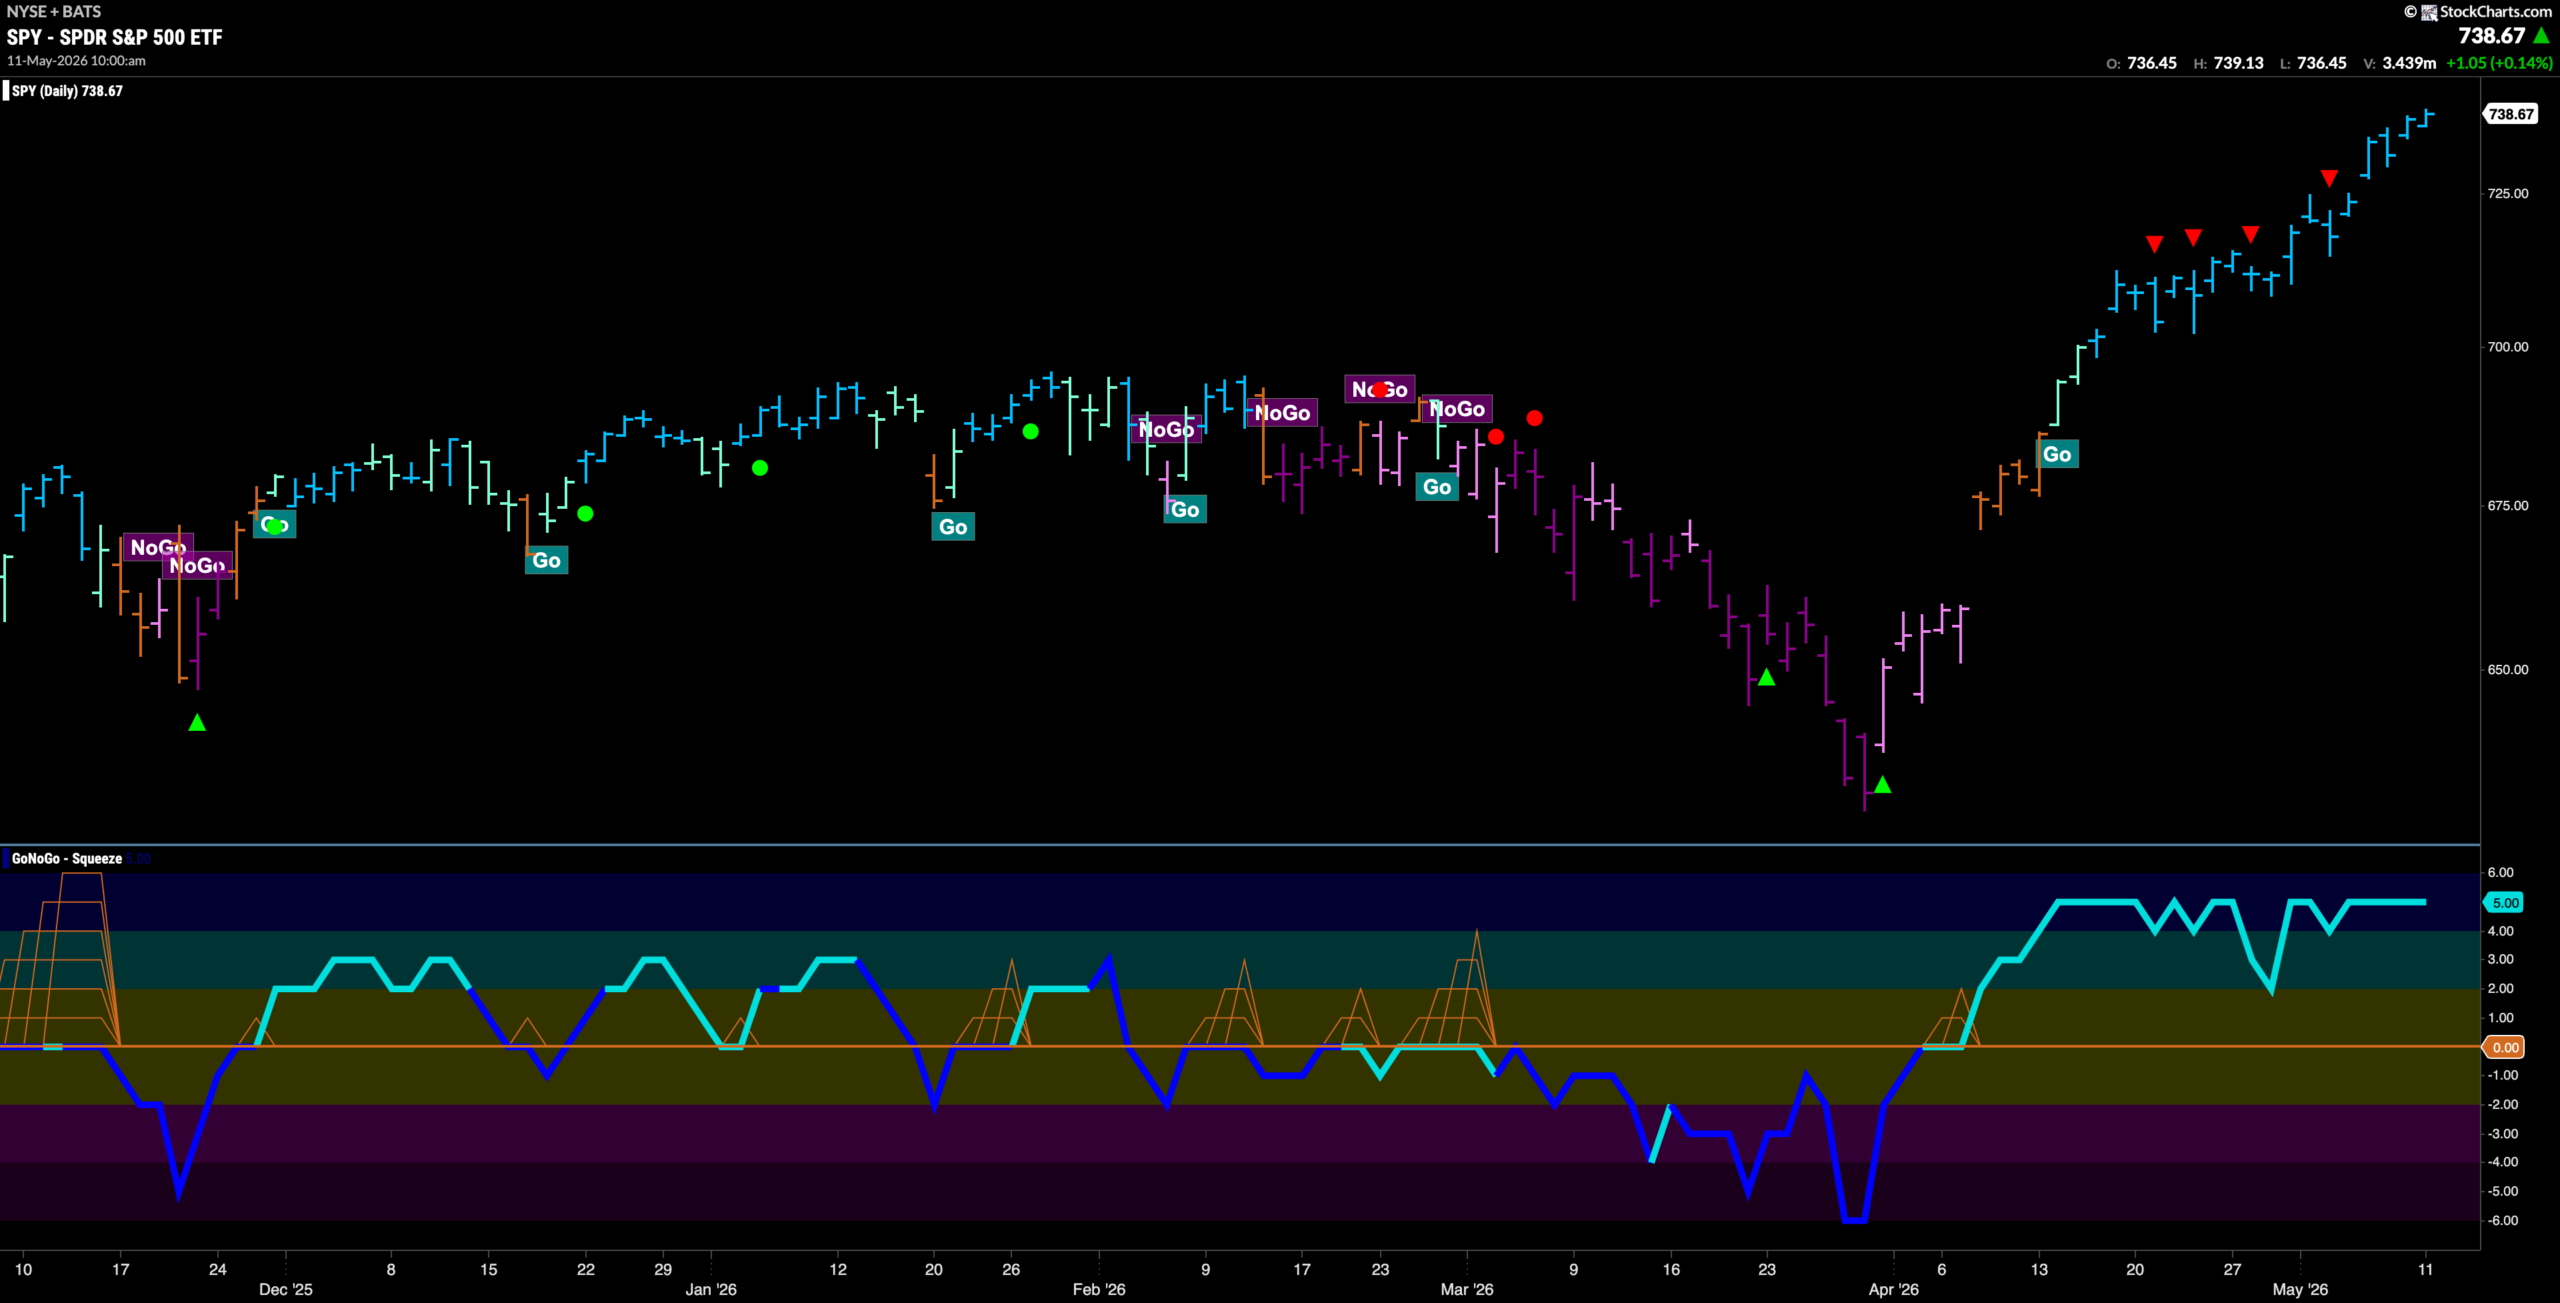
$SPY Continues String of Strong Blue “Go” Bars at Highs
The GoNoGo chart below shows that the “Go” trend has stayed strong for another week as the indicator paints uninterrupted bright blue bars. We see that the trend leaned into the market enthusiasm and barely slowed down following several Go Countertrend Correction Icons (red arrows). If we turn our attention to the lower panel we can see that GoNoGo Oscillator has been dipping in and out of overbought territory for several weeks. Now, we see it continues at an overbought value of 5. This shows continued, strong momentum in the direction of the “Go” trend.
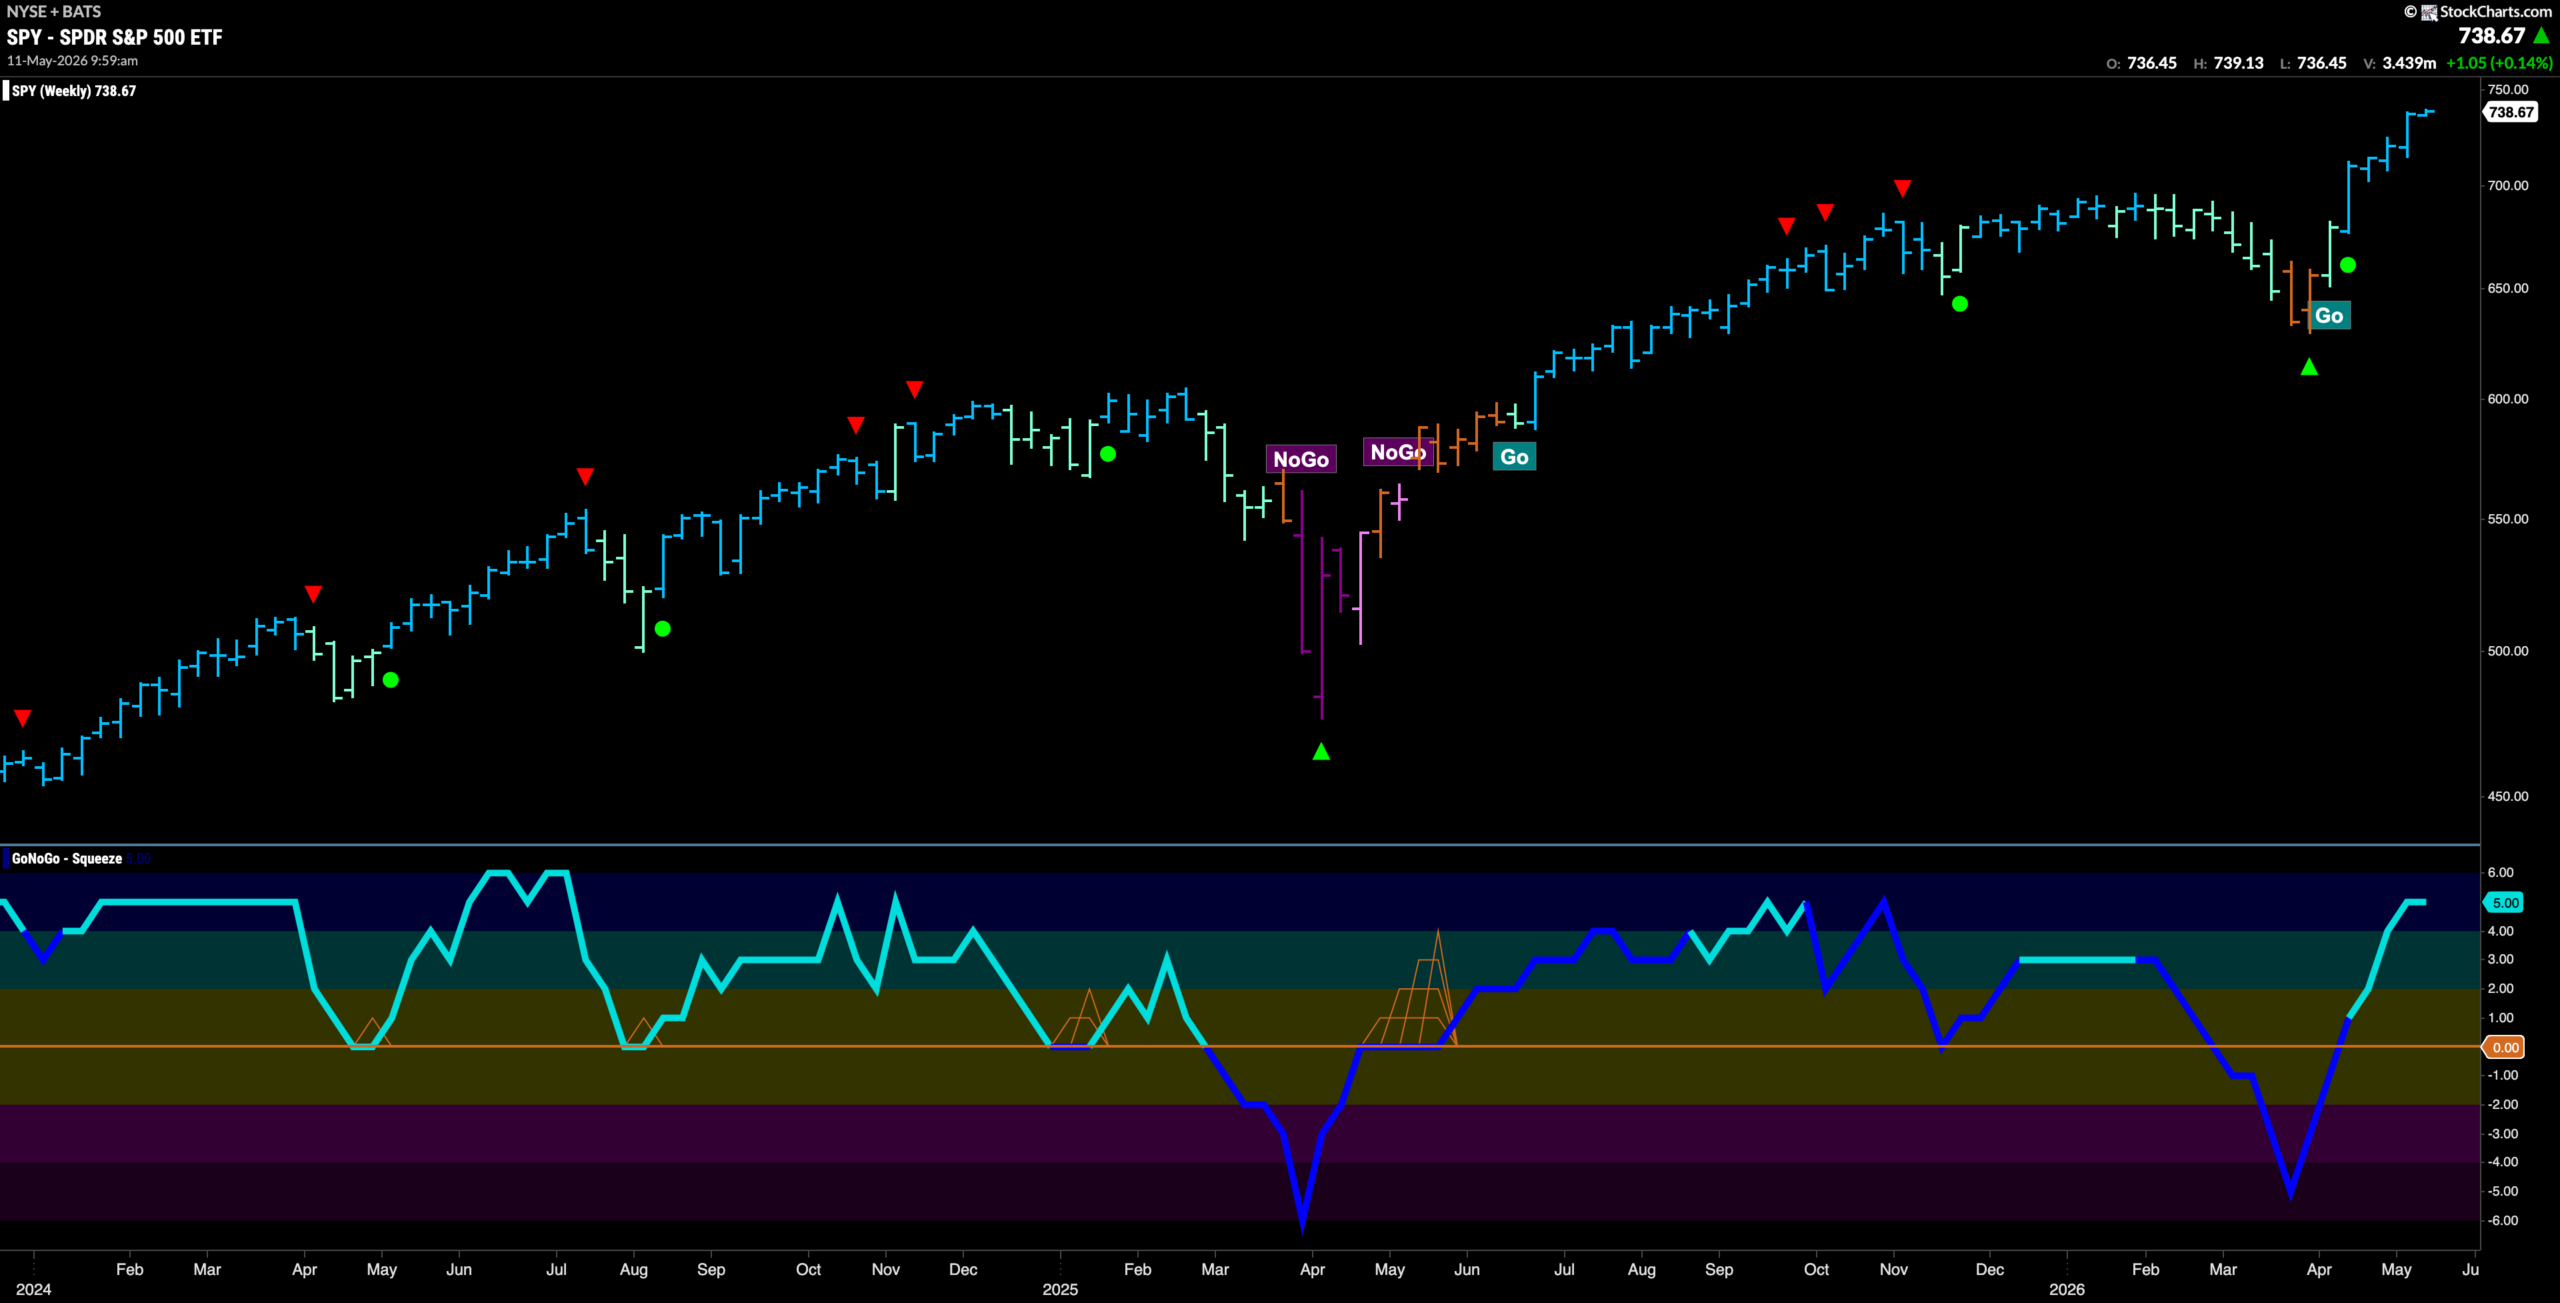
The weekly chart shows that the “Go” trend has resumed in full force on the longer time frame and shows no signs of slowing. With another weekly close at a new higher high and momentum now in overbought territory at a value of 5 we know that there is strong market participation. We will watch to see if price can consolidate at these levels in the coming weeks.
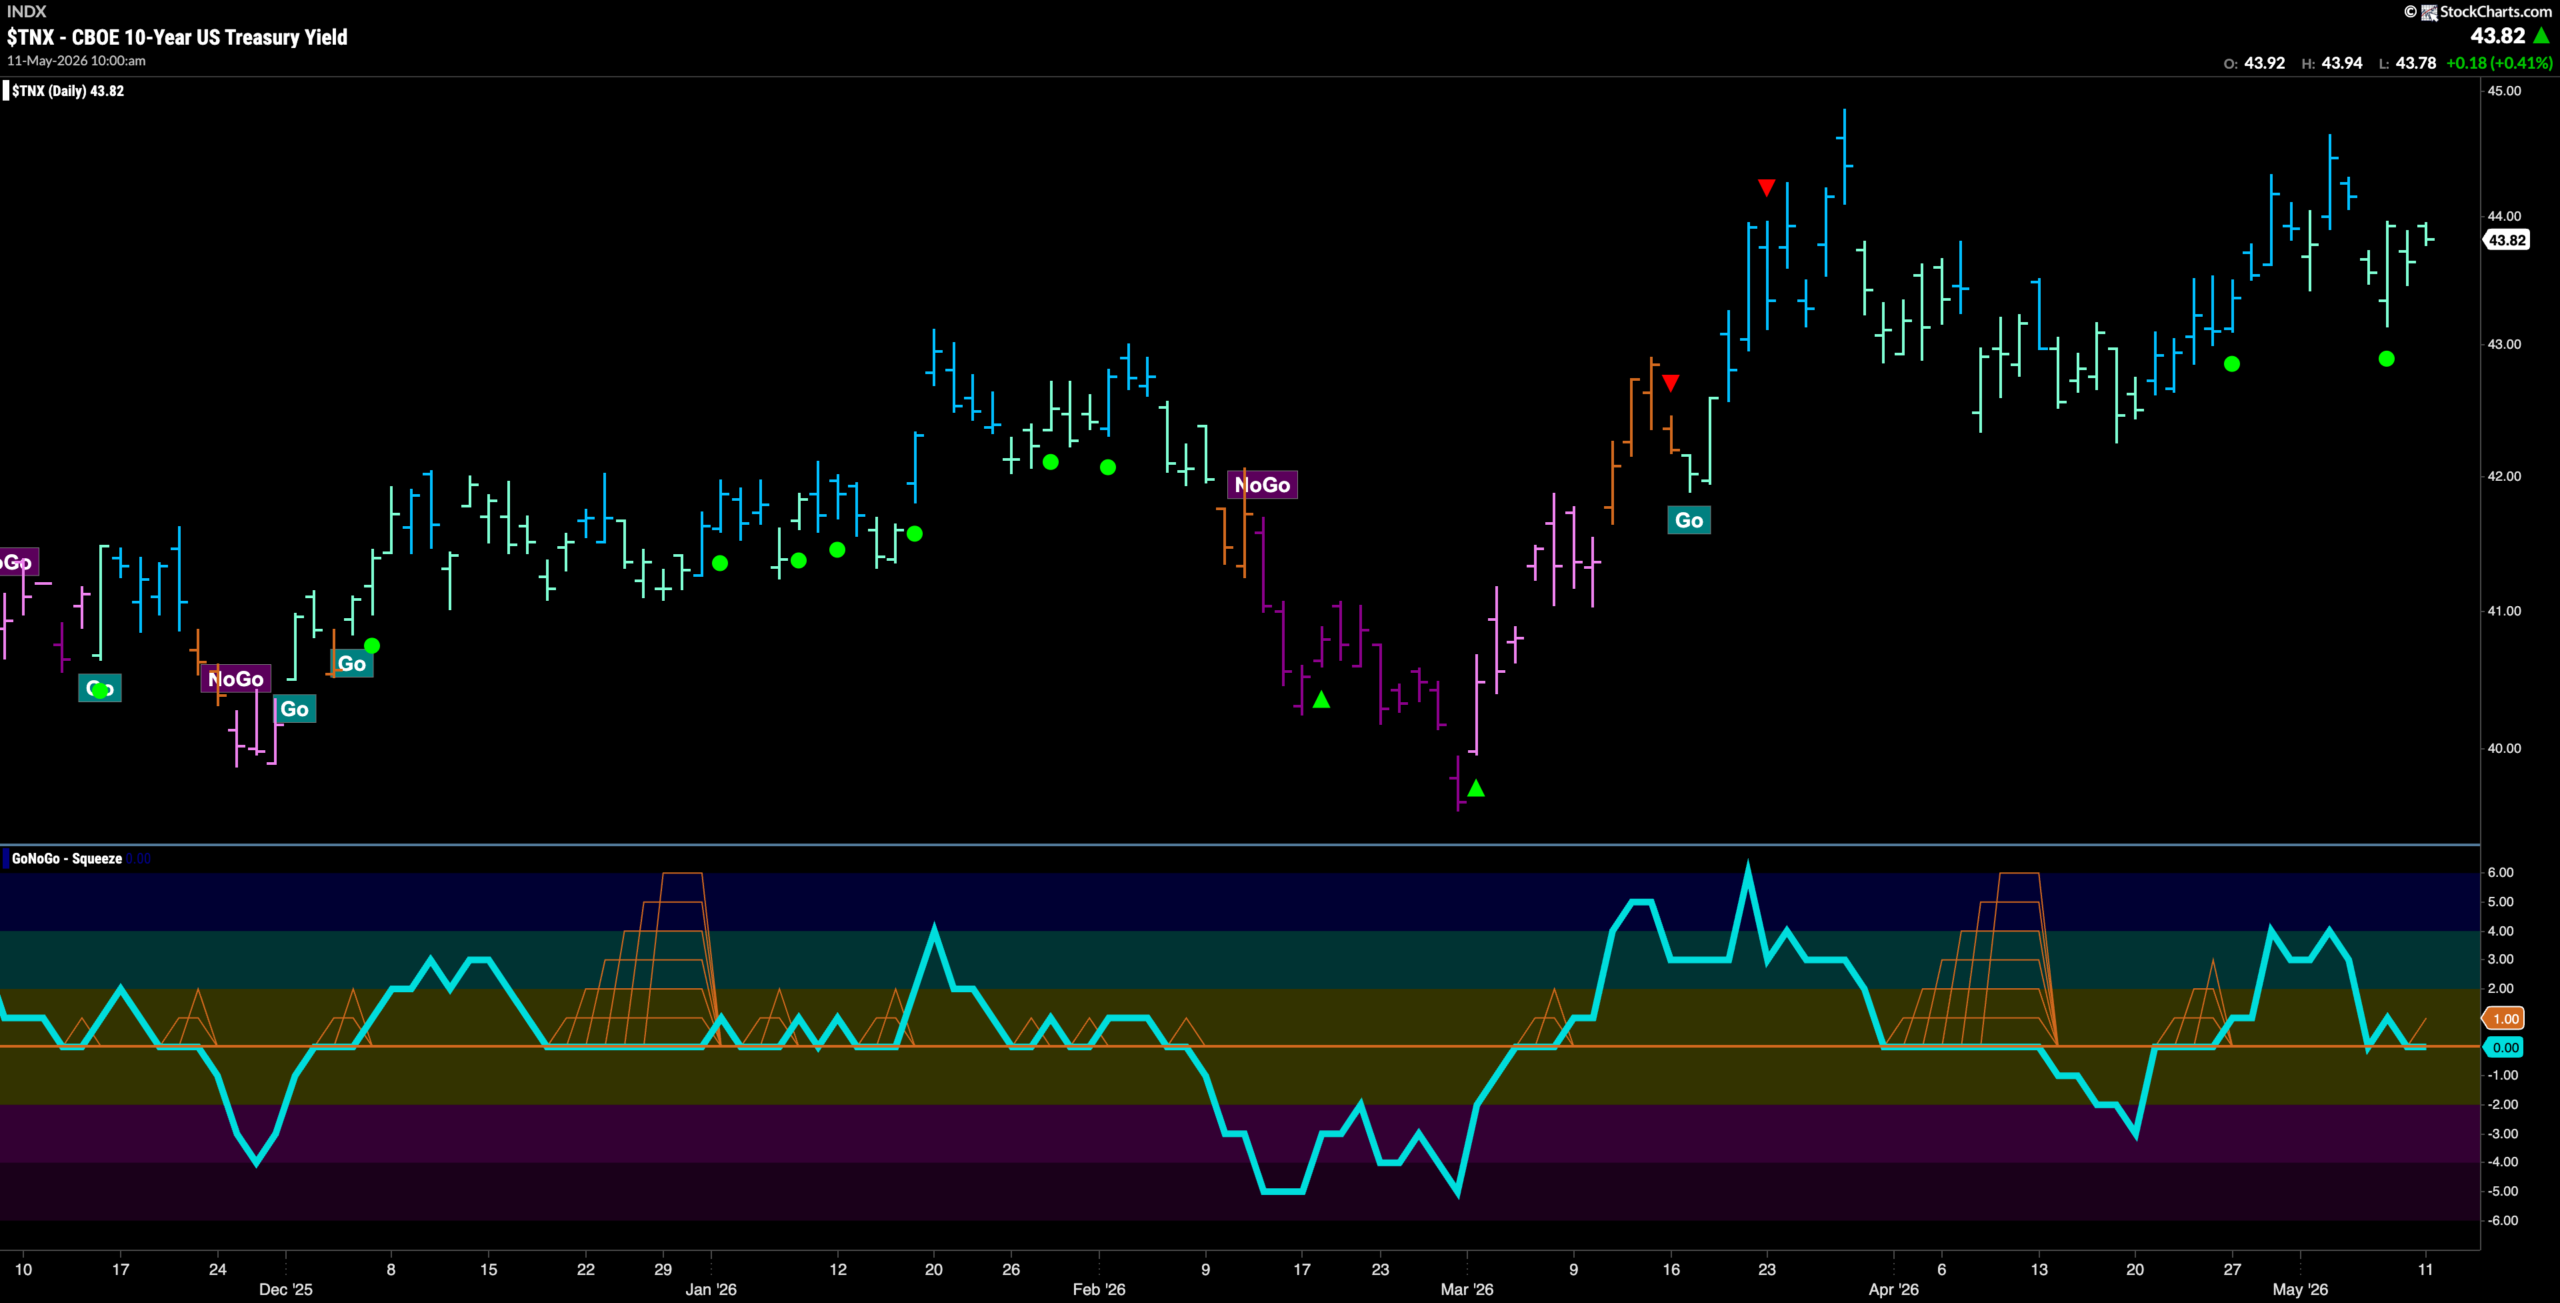
Treasury Rates See Weakness in “Go” Trend
GoNoGo Trend shows that the “Go” trend remains in place for rates but we are seeing weaker aqua bars after a failed attempt at a new higher high. Turning our attention to the lower panel we see that the oscillator has recently found support at the zero line and is testing it once again. Should the oscillator remain at or above zero that tells us that momentum remains in line with the “Go” trend and we would look for rates to maintain the trend and look to challenge for another high.
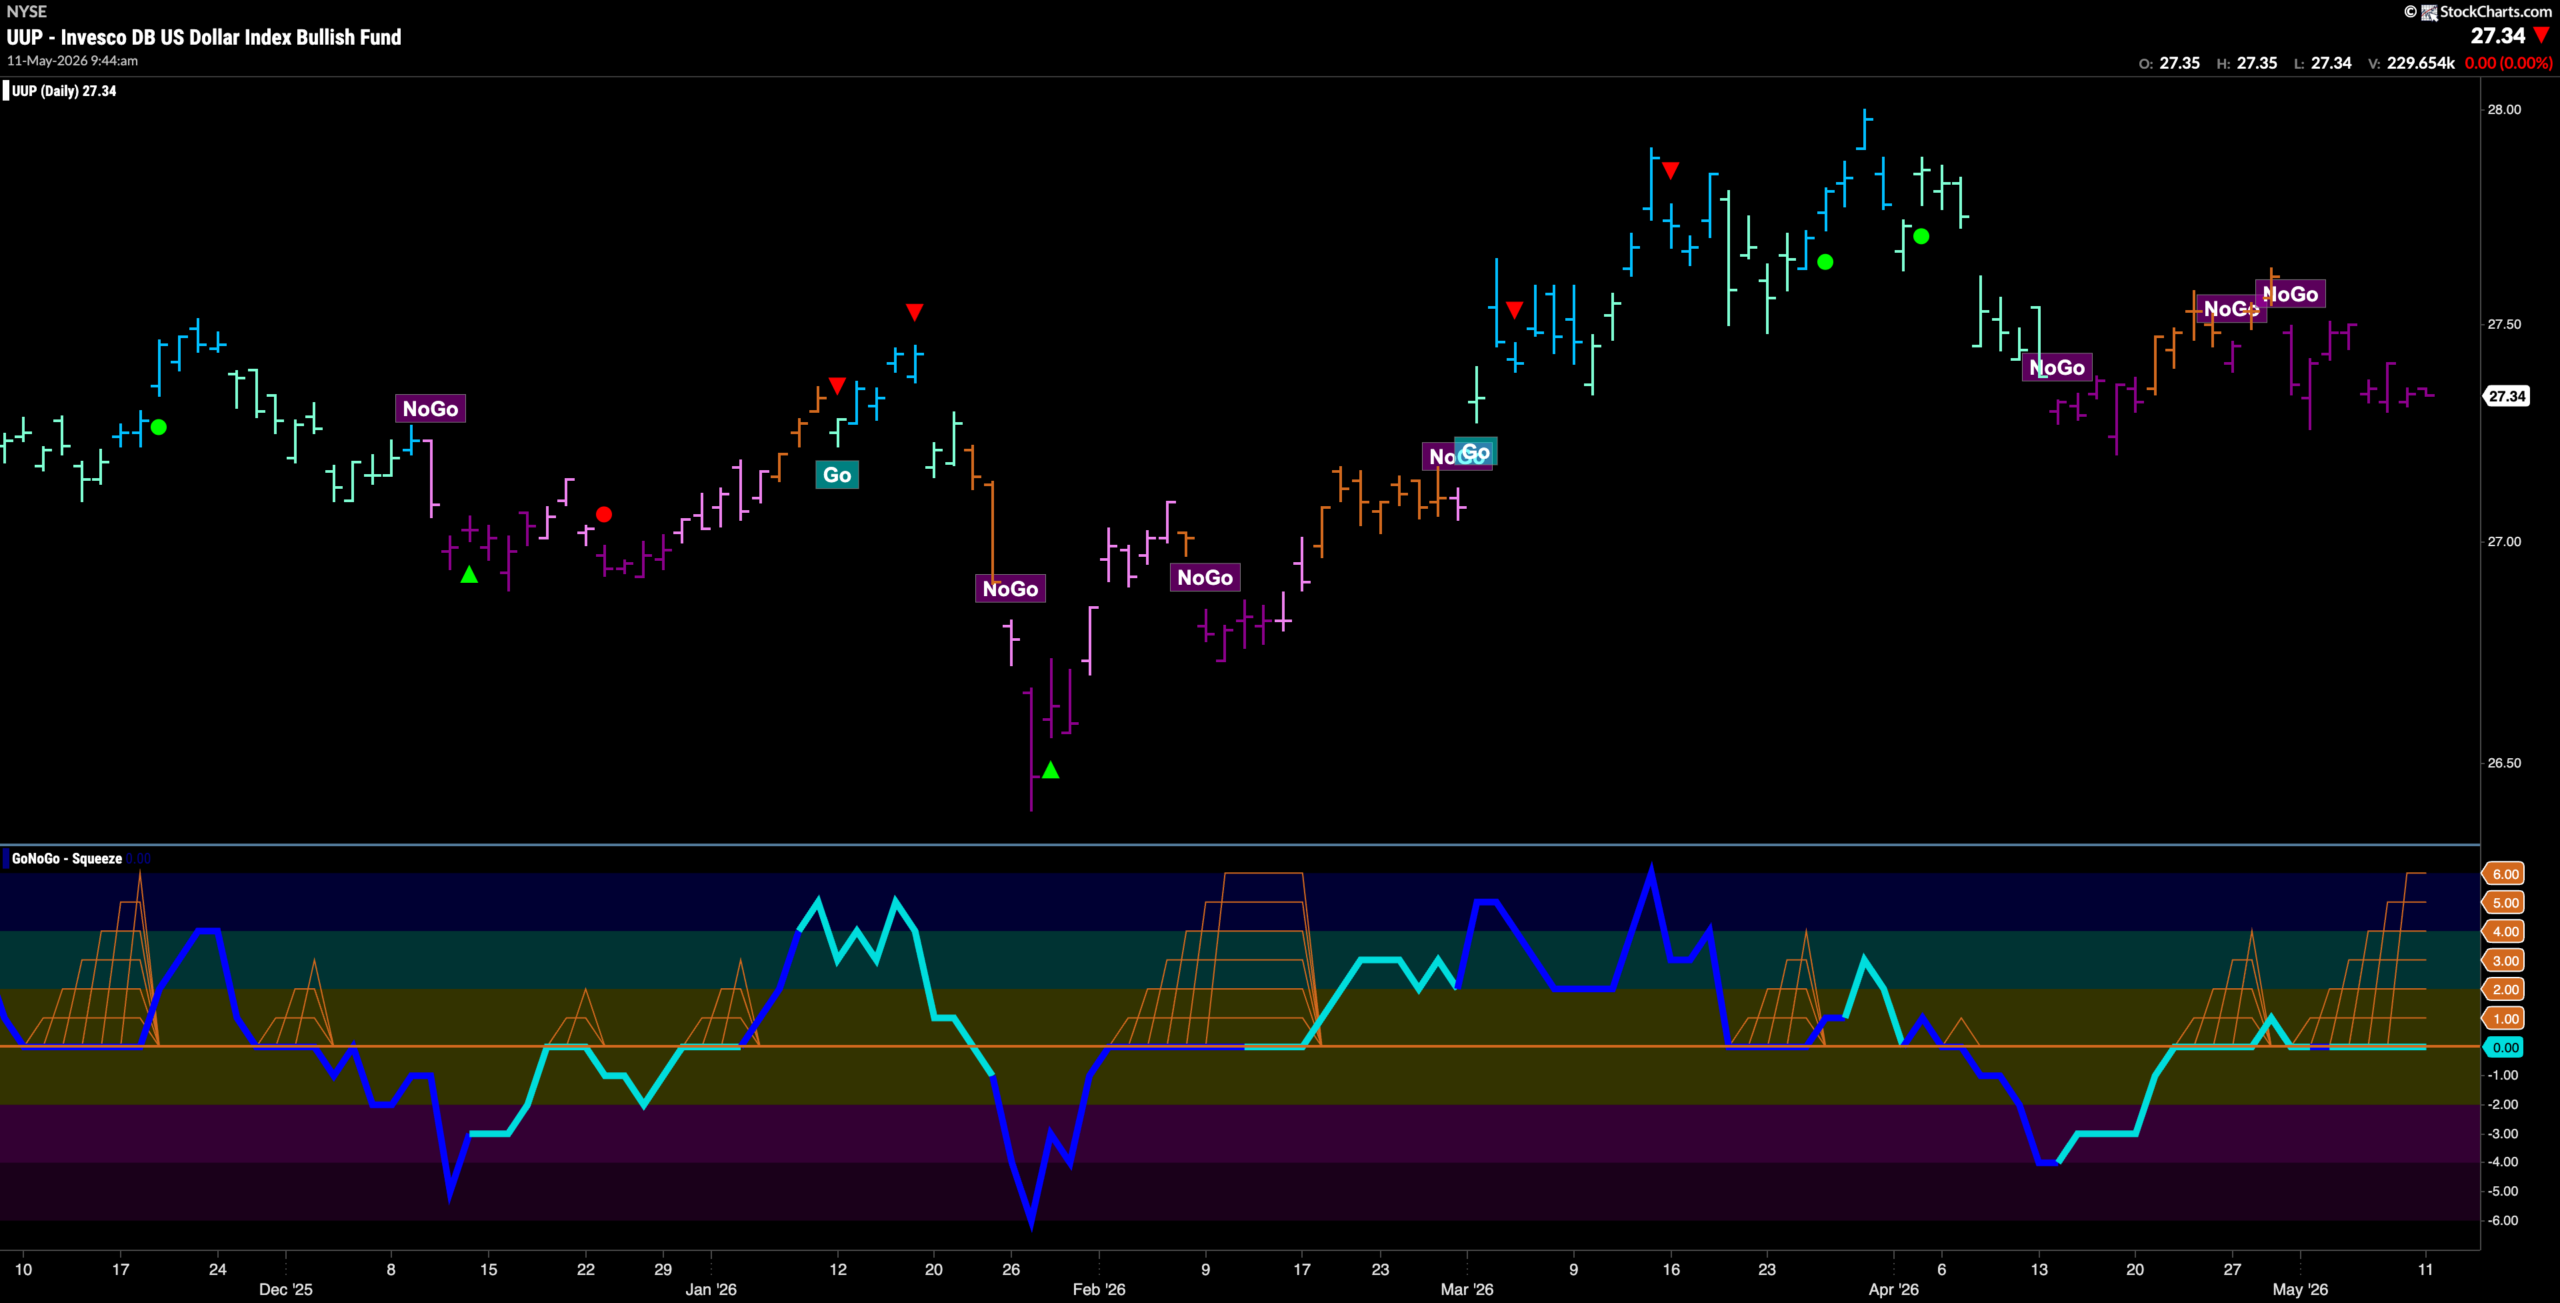
Dollar ($UUP) Remains in Strong “NoGo” Trend
The chart below shows that the trend in the dollar remains bearish as the indicator paints strong purple bars for the entire week. However, we note that it has been unable to set a new lower low. We look to the lower panel and we see that GoNoGo Oscillator is riding the zero line and we see a Max GoNoGo Squeeze. We will watch for the direction of the break of the Squeeze to give us a hint at price’s next direction. Should the oscillator break out of the Squeeze into negative territory then we would expect more downward pressure on the dollar.
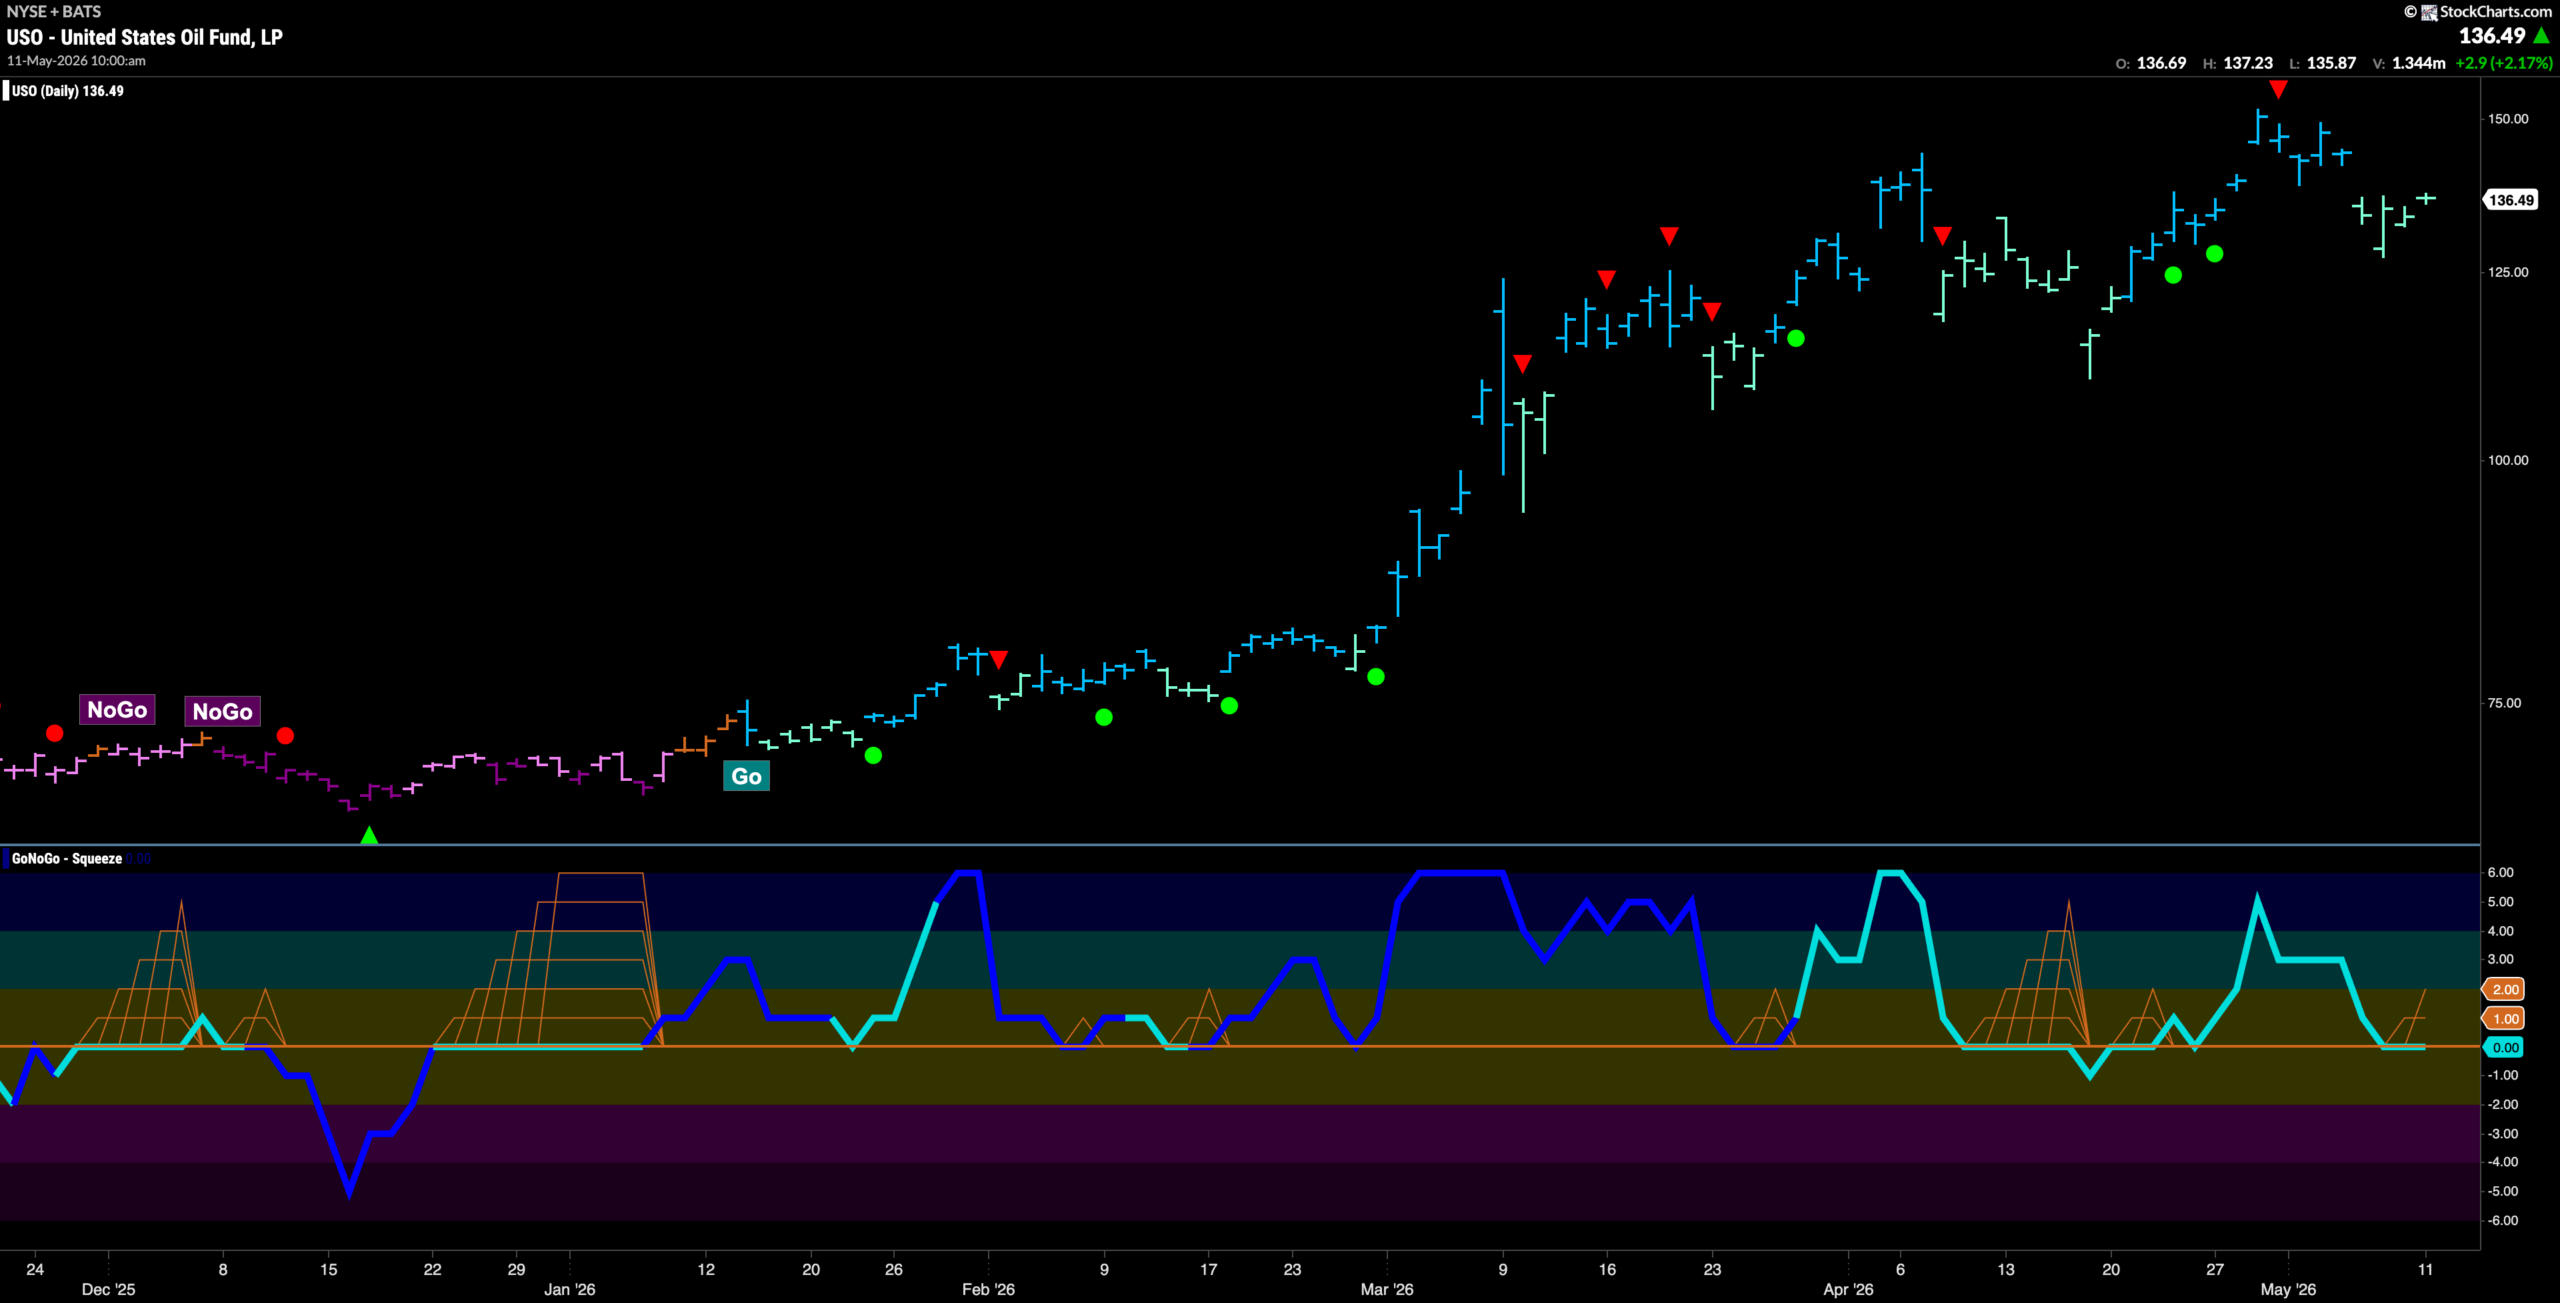
Oil ($USO) Paints Weaker Aqua Bars
GoNoGo Trend shows that the “Go” trend remains in place for oil however we see weaker aqua bars for most of the last week. This comes as price falls from the Go Countertrend Correction Icon (red arrow) that we see at the last higher high. GoNoGo Oscillator fell to the zero line showing the waning momentum and is now at that level for a second bar. As the oscillator finds support at zero it seems that price has set a higher low. We will watch to see if the oscillator can rally off the zero line back into positive territory. If it does, then we would see signs of Go Trend Continuation (green circle) and would expect price to make an attempt at a new higher high in the coming days or weeks.
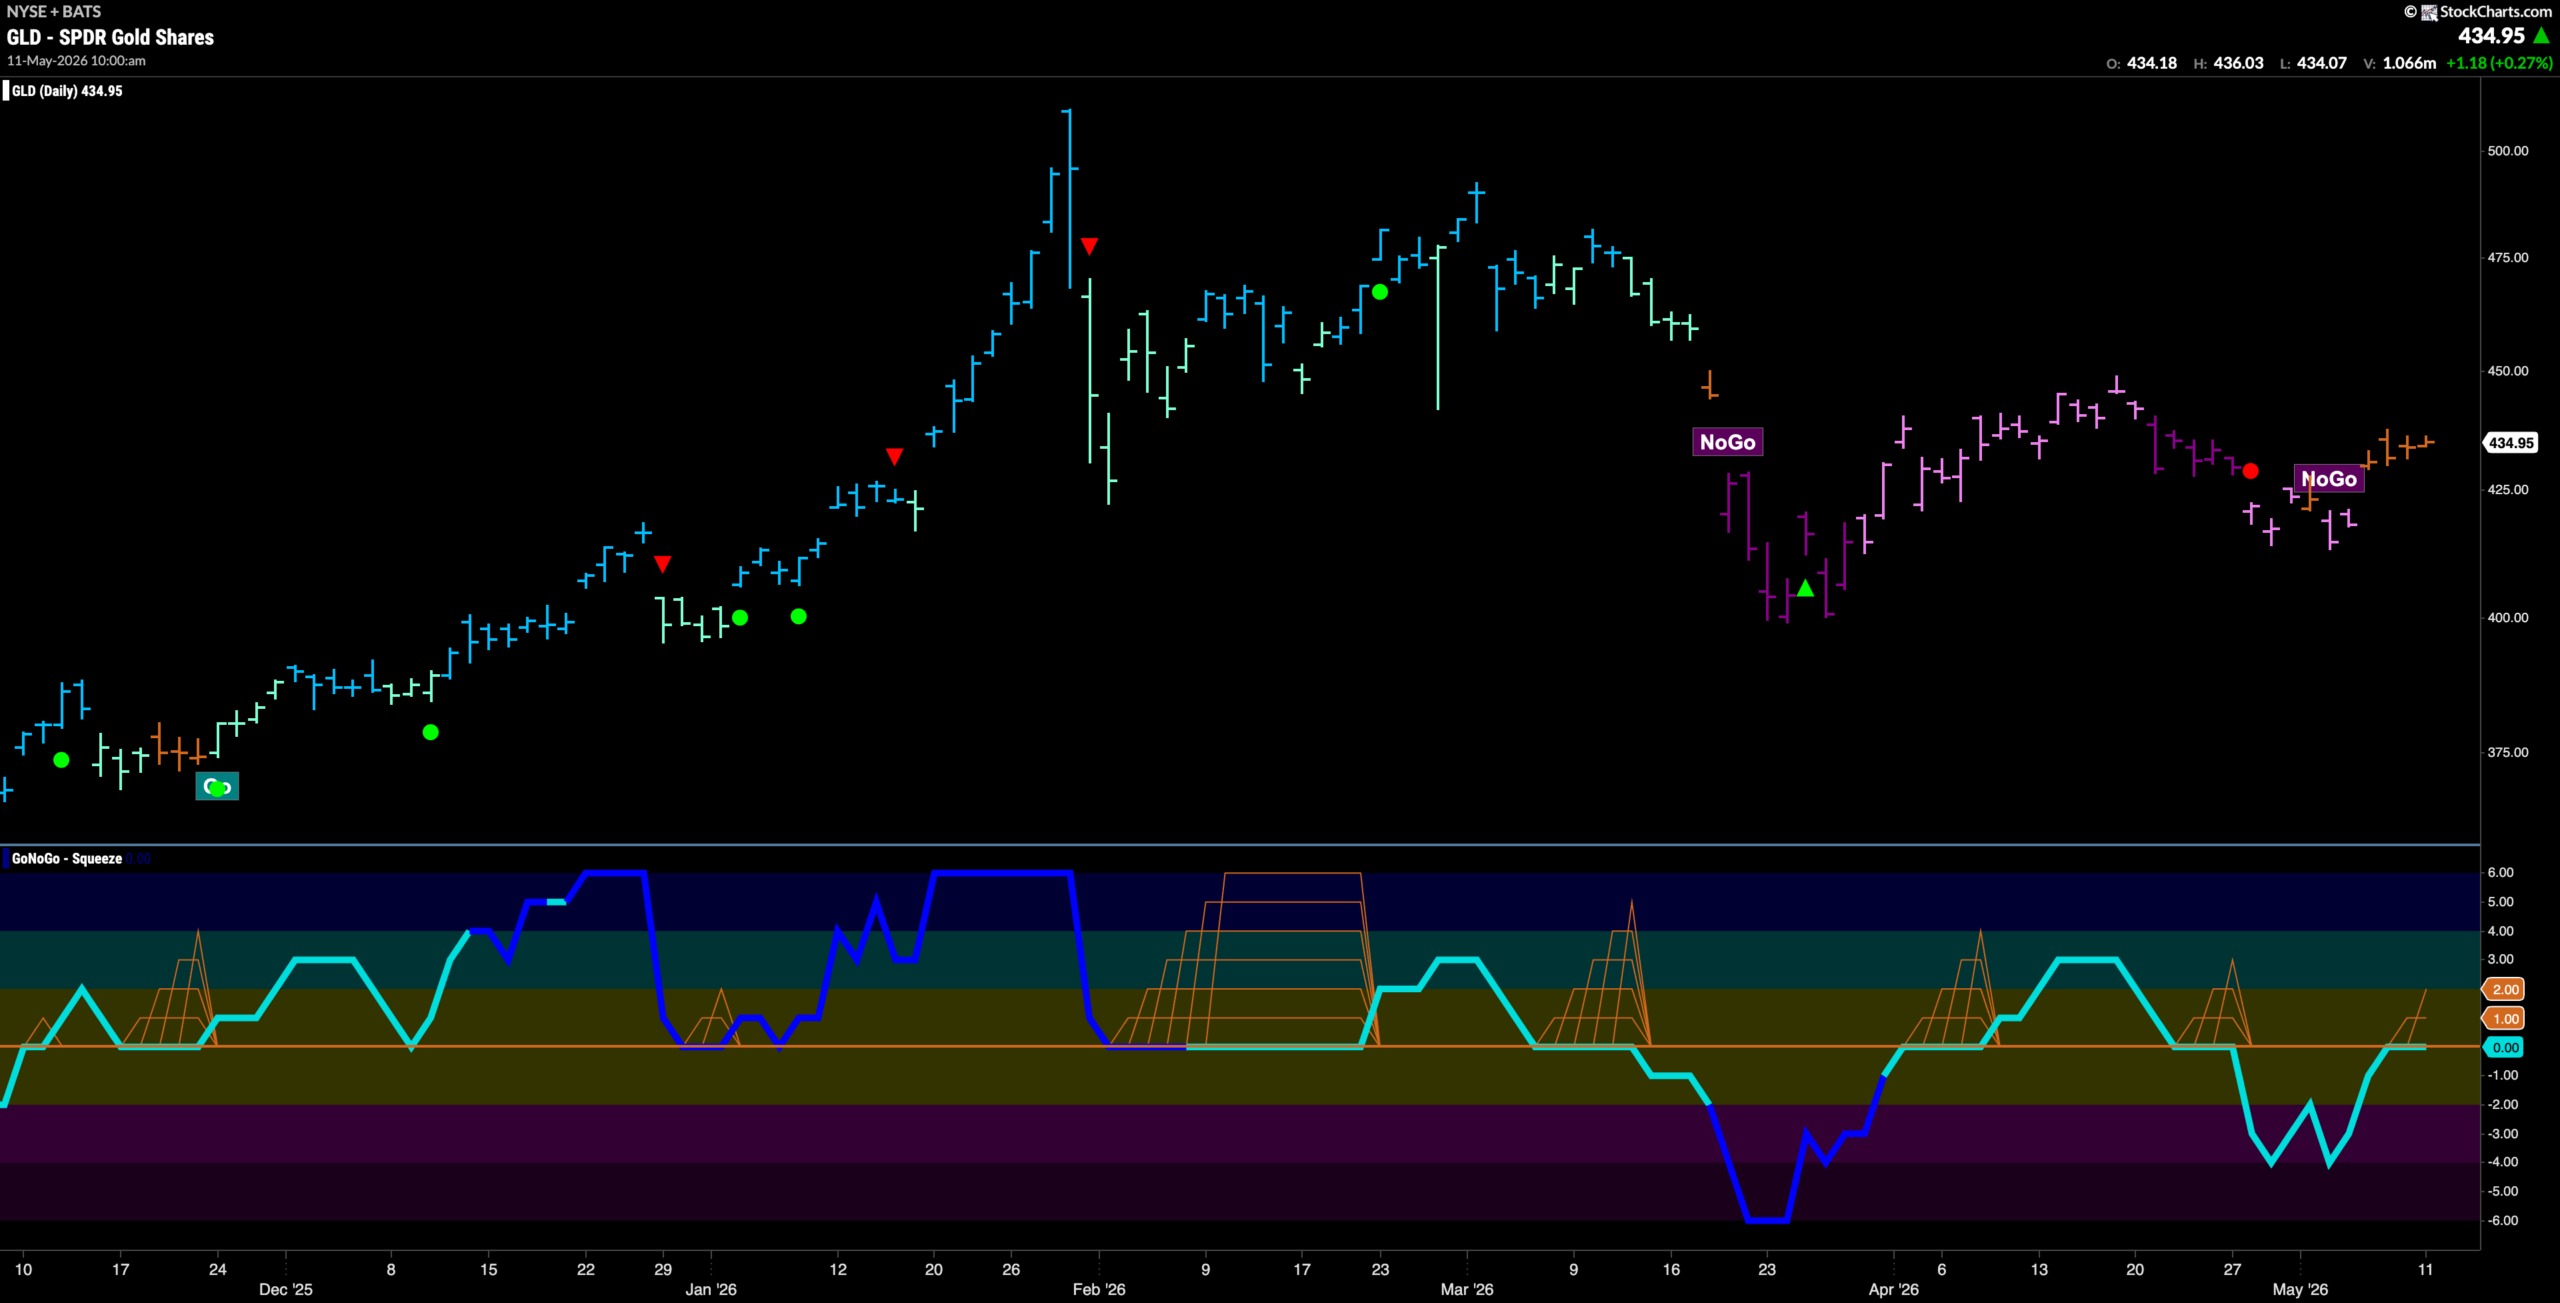
Gold ($GLD) Shows Market Uncertainty
GoNoGo Trend paints a string of amber “Go Fish” bars of uncertainty. This tells us that the market is uncertain about the trend in the precious metal. Not enough criteria are being met in either the “Go” or “NoGo” direction to identify a trend. GoNoGo Oscillator is testing the zero line from below. We will watch to see if it finds resistance here or if it can break back into positive territory. This would help determine price’s likely next direction.
Sector RelMap
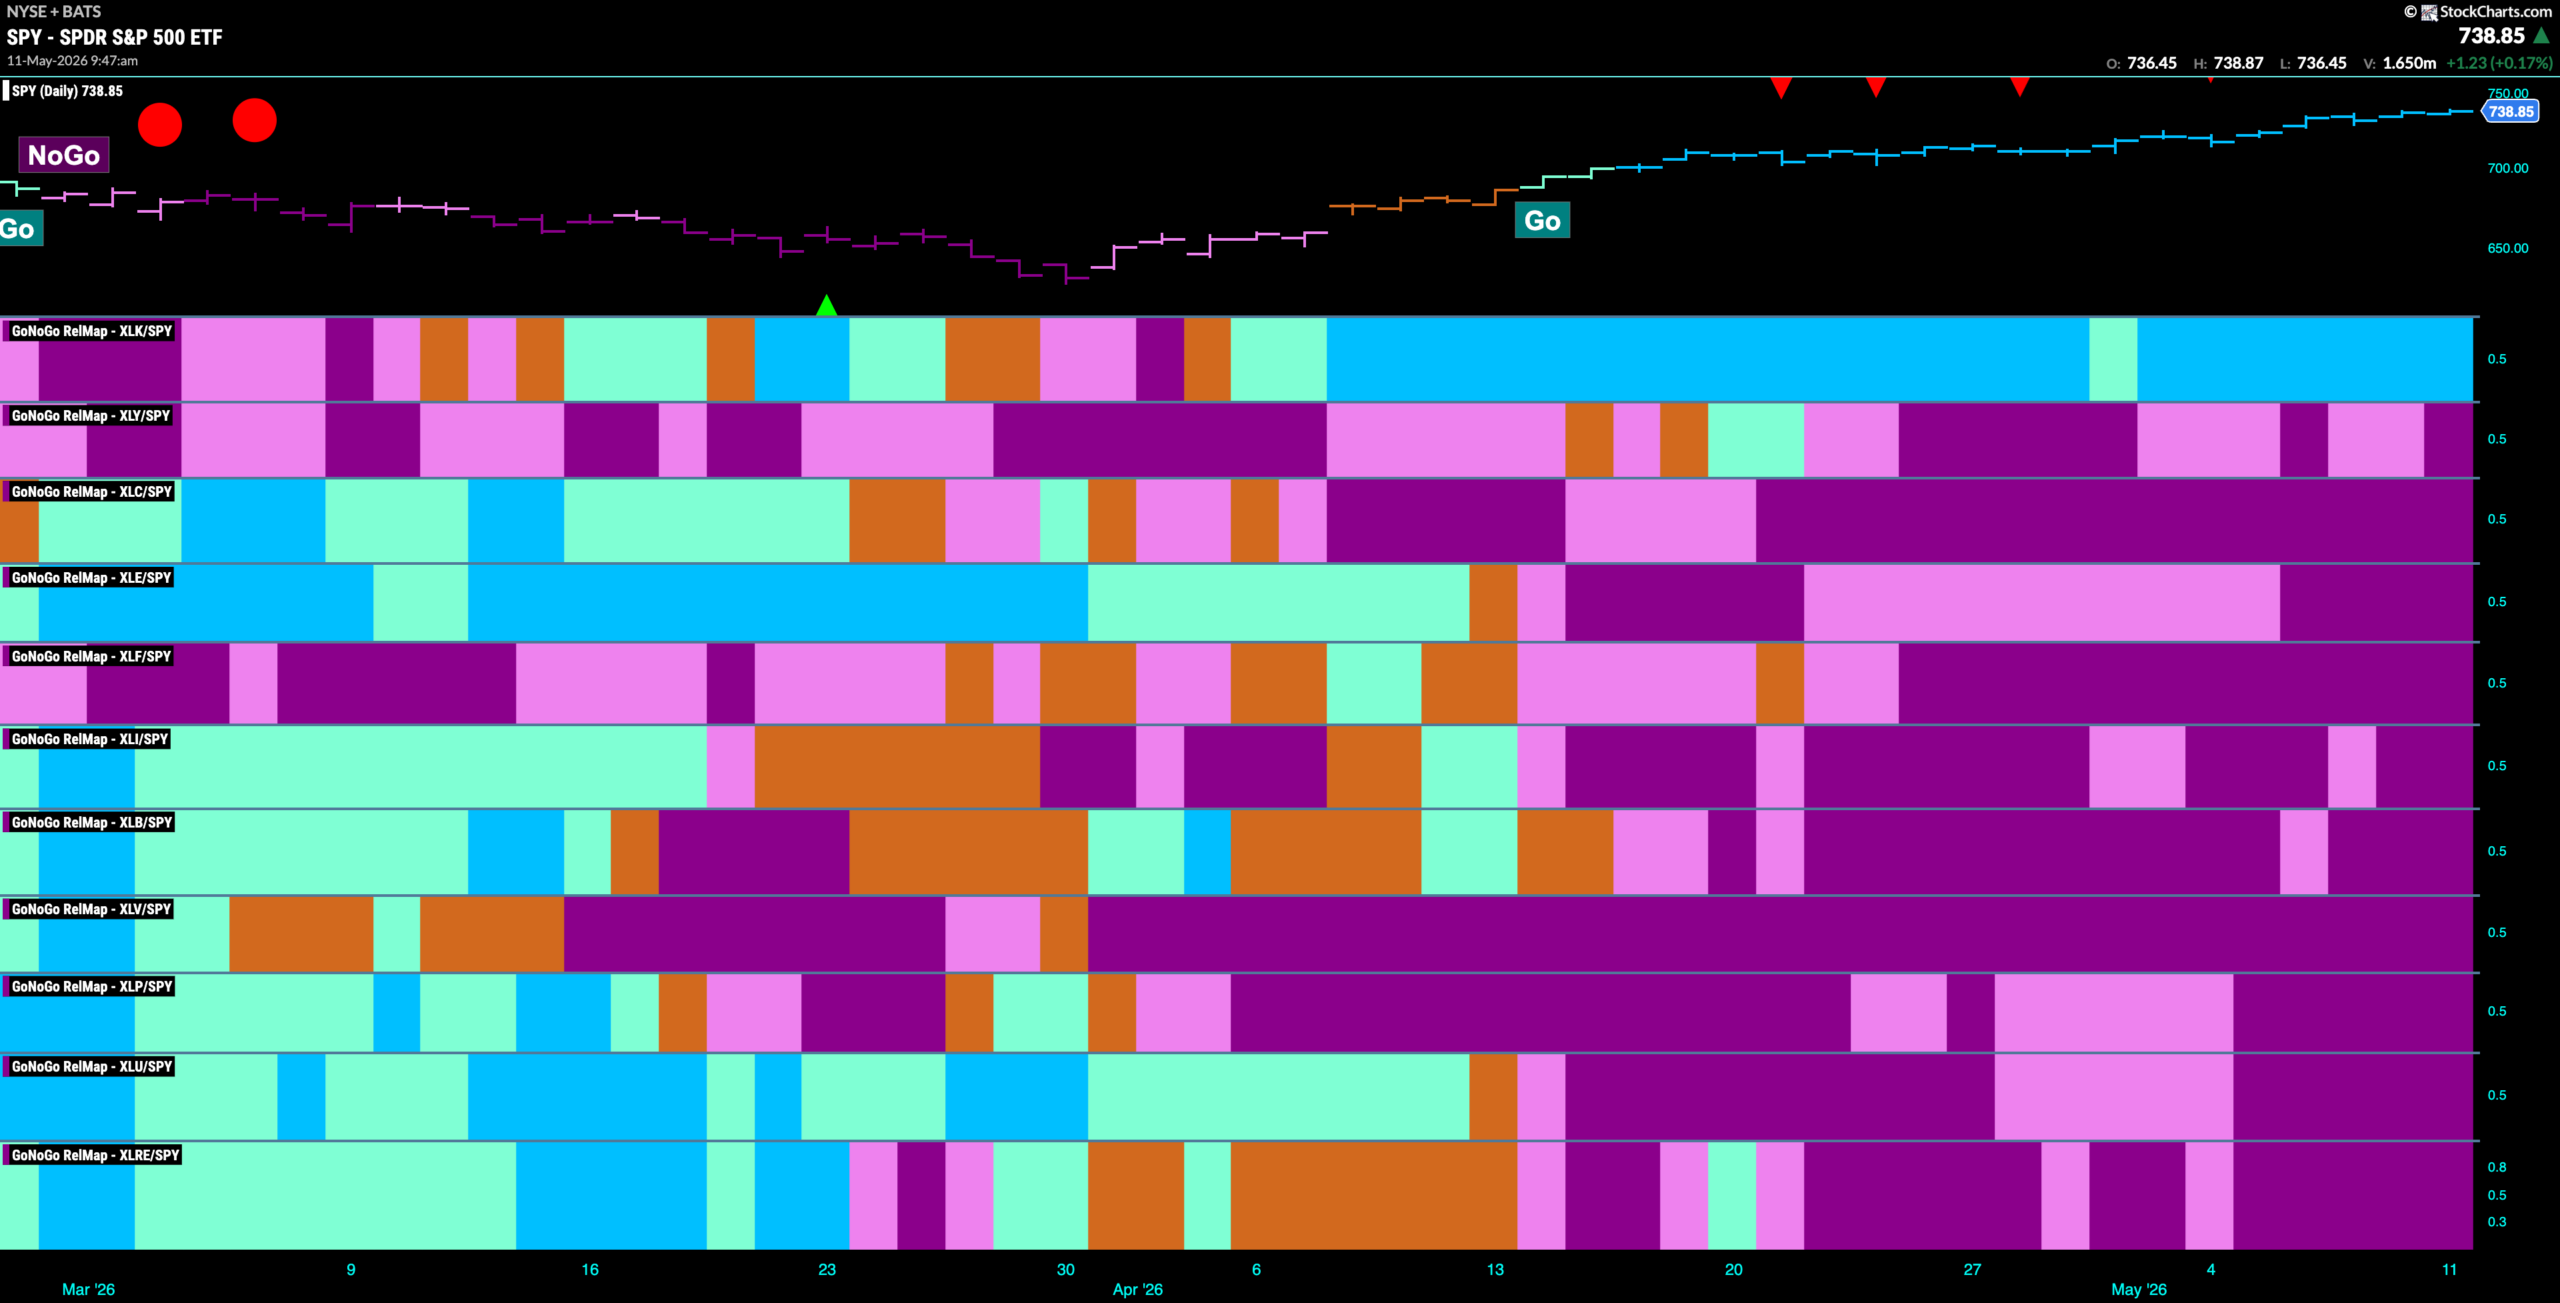
Below is the GoNoGo Sector RelMap. This GoNoGo RelMap applies the GoNoGo Trend to the relative strength ratios of the sectors to the base index. With this view we can get a sense of the relative out performance and relative underperformance of the sectors. 1 sector is in a relative “Go” trend. $XLK, is painting relative “Go” bars.
Sector HeatMap
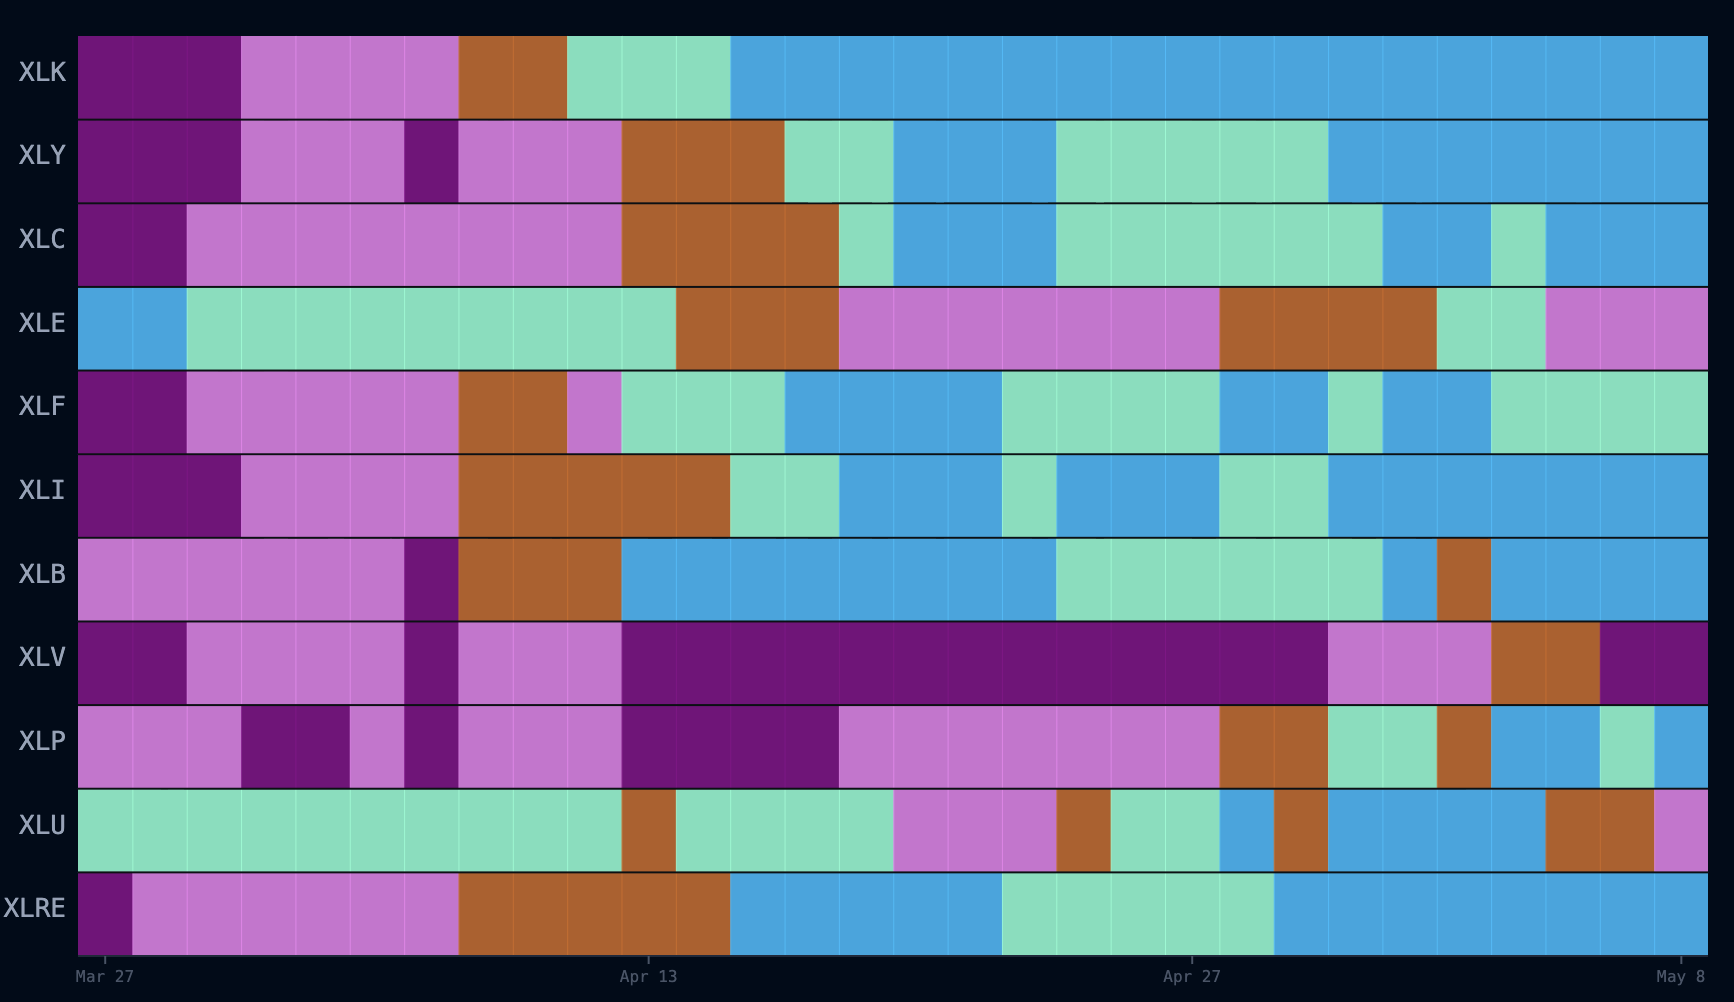
The chart below shows the absolute GoNoGo Trend HeatMap for the sectors. Above we saw that relative to the S&P 500 only the technology sector is outperforming the broad index. However, we can see from the heat map below that the majority of sectors are in “Go” trends! We can see from the top three panels that ALL of the growht sectors are in strong “Go” trends. Below we will look at the sub industry map of the communications sector.
Communications Sub-Group RelMap
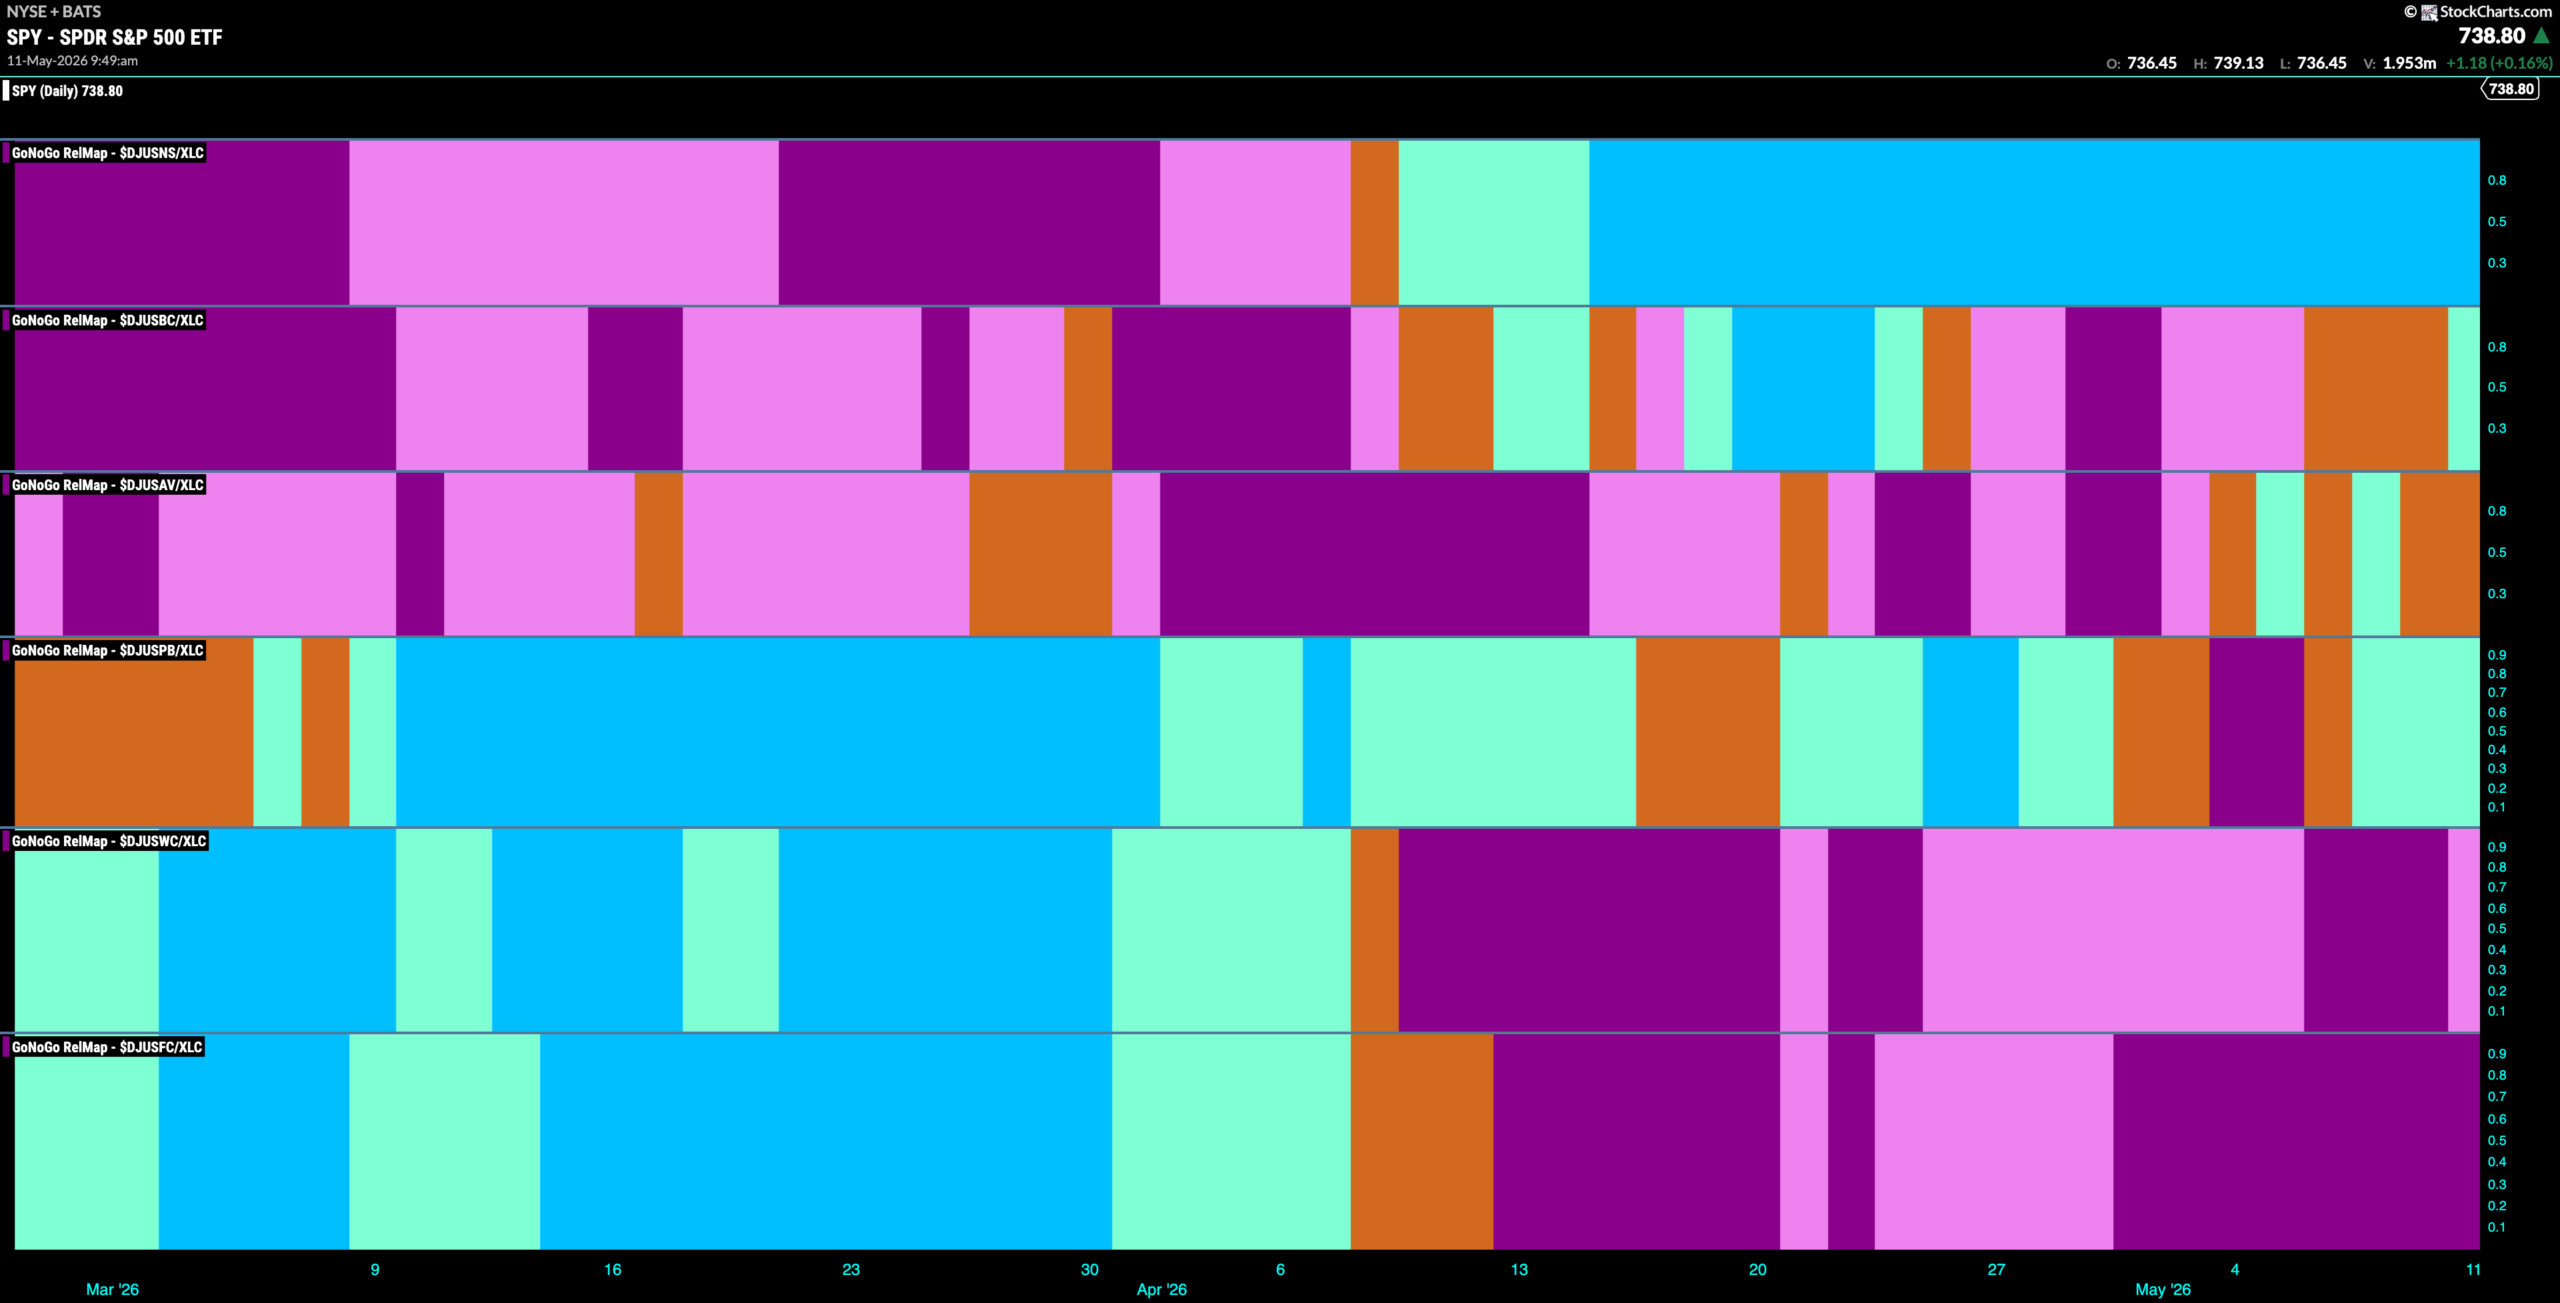
The chart below shows a relative trend breakdown of the sub groups within the communications sector this week. The Sub-Group RelMap plots the GoNoGo Trend of each sub index to the $XLC. We saw in the above GoNoGo Sector HeatMap that $XLC continues to perform well and paints strong “Go” bars. When we look at the below RelMap we can see that the internet index in the top panel continues to paint “Go” bars on a relative basis.
$BODI Looks for Support in “Go” Trend
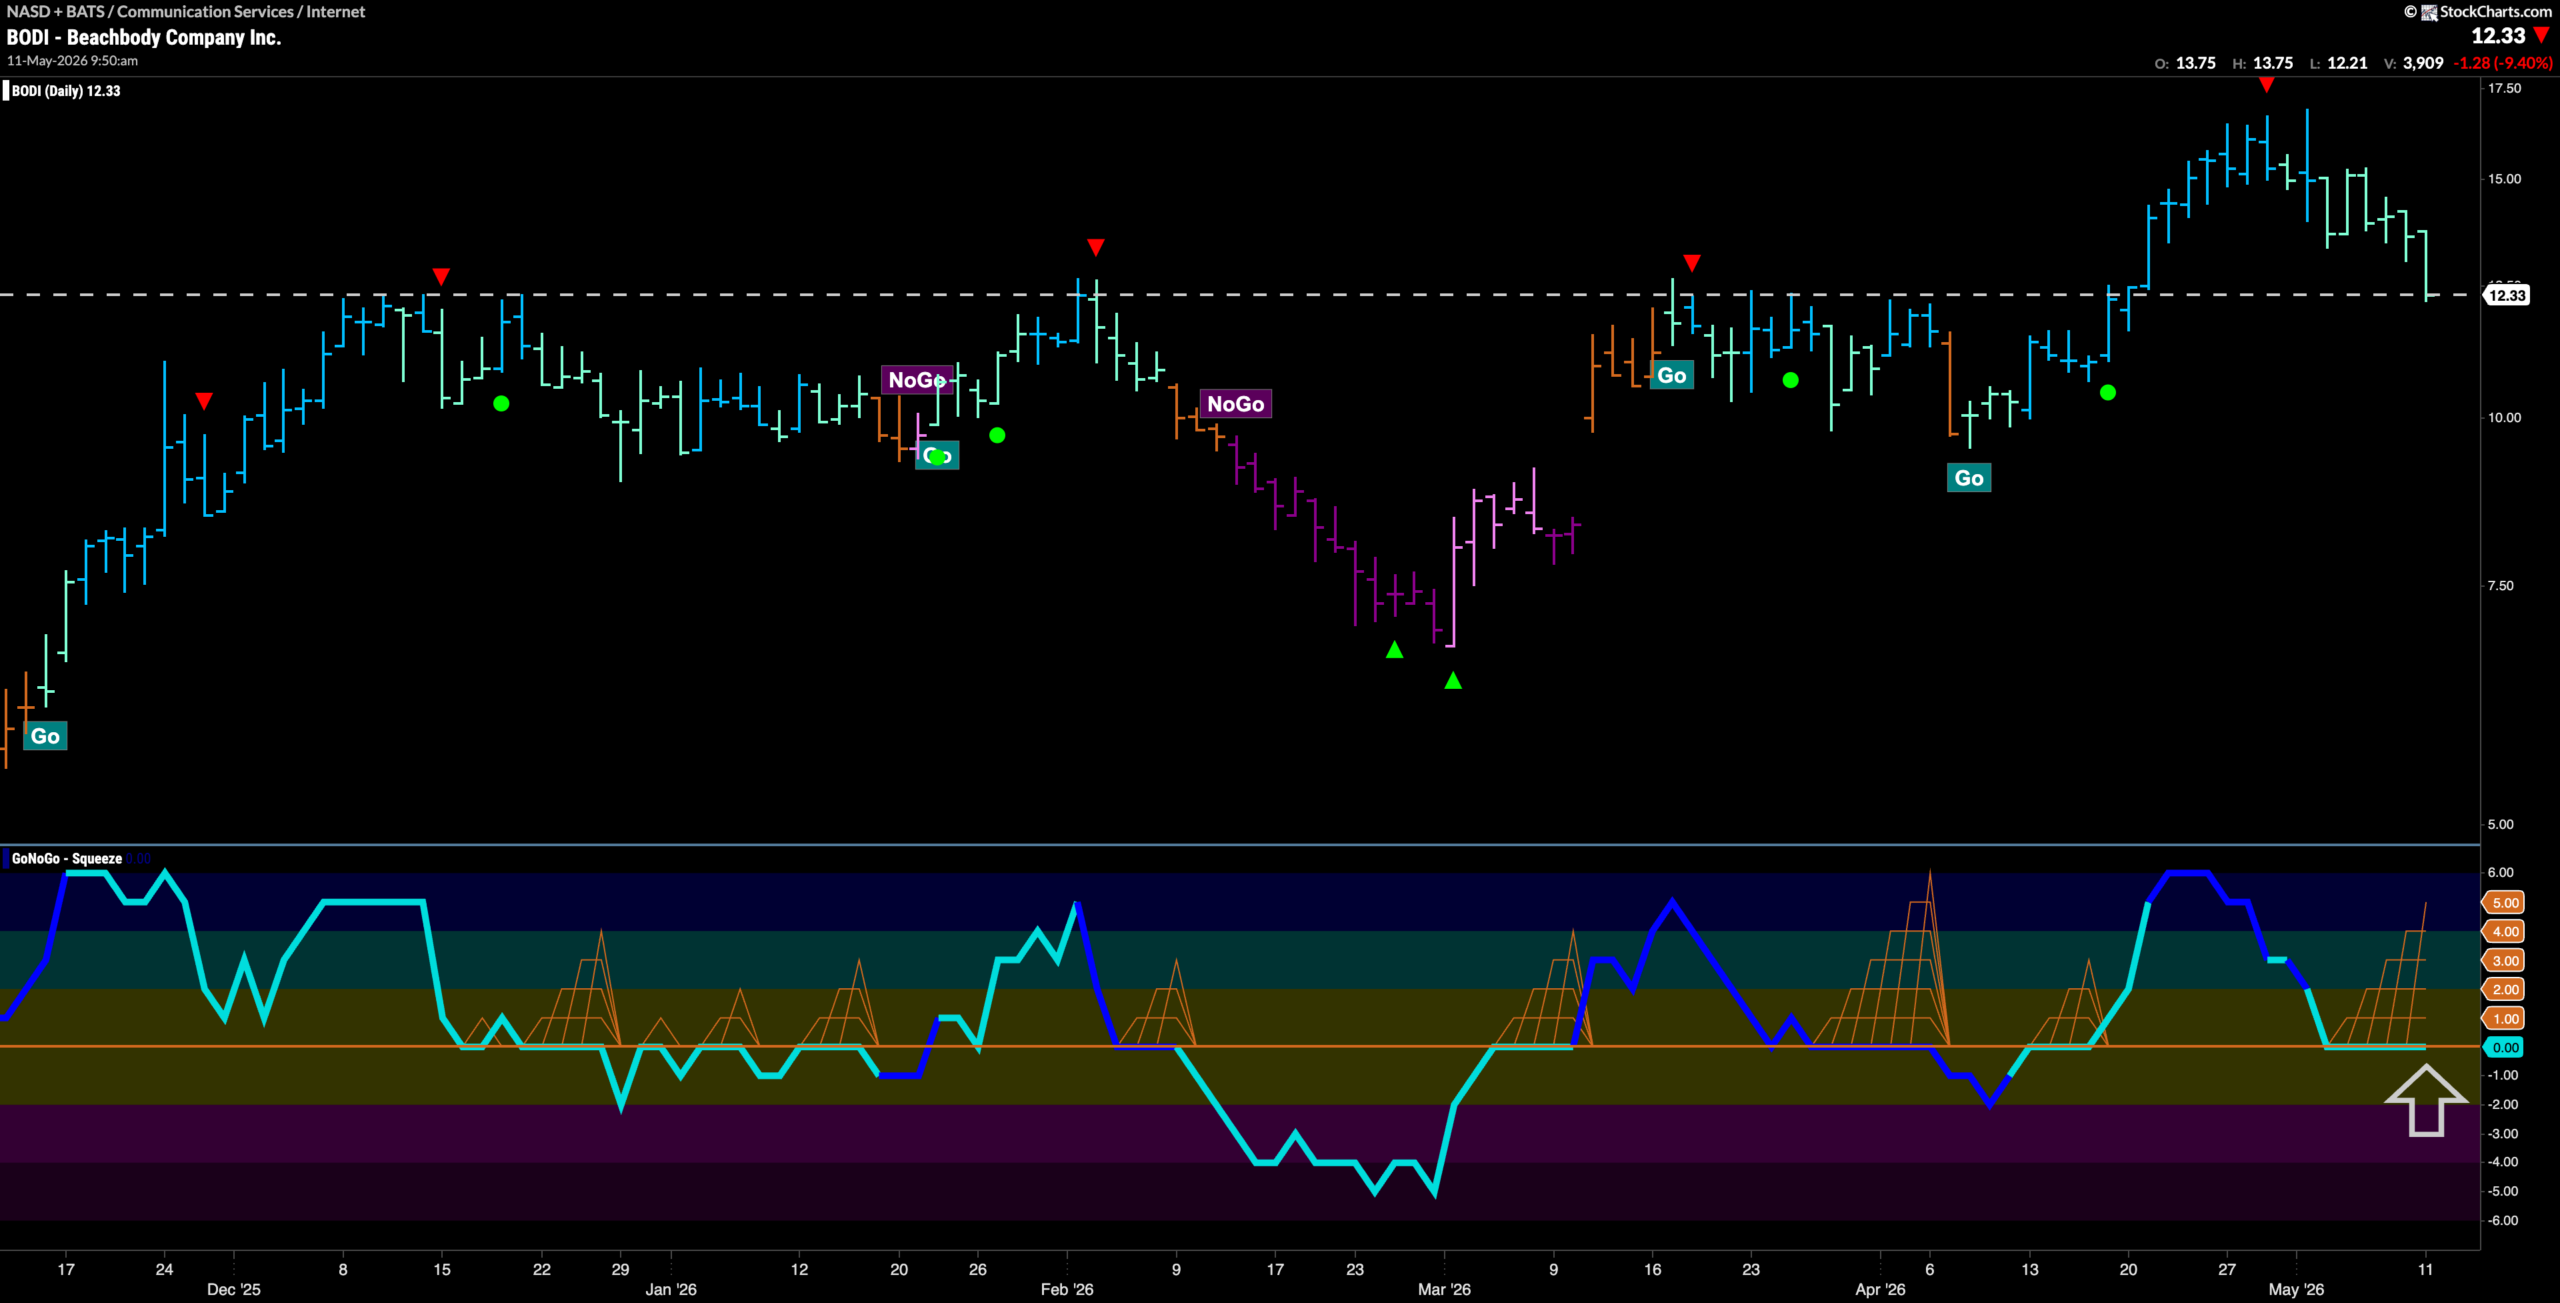
The GoNoGo Chart below shows that after soaring to a new higher high we saw a Go Countertrend Correction Icon (red arrow) indicating that price may struggle to go higher in the short term. Indeed, GoNoGo Trend has painted a string of weaker aqua bars as price has fallen to a horizontal support level. GoNoGo Oscillator is riding the zero line and we see a GoNoGo Squeeze forming. We will watch to see if the oscillator breaks out of the Squeeze into positive territory and if it does then we would likely see price find support at the horizontal level we see on the chart.
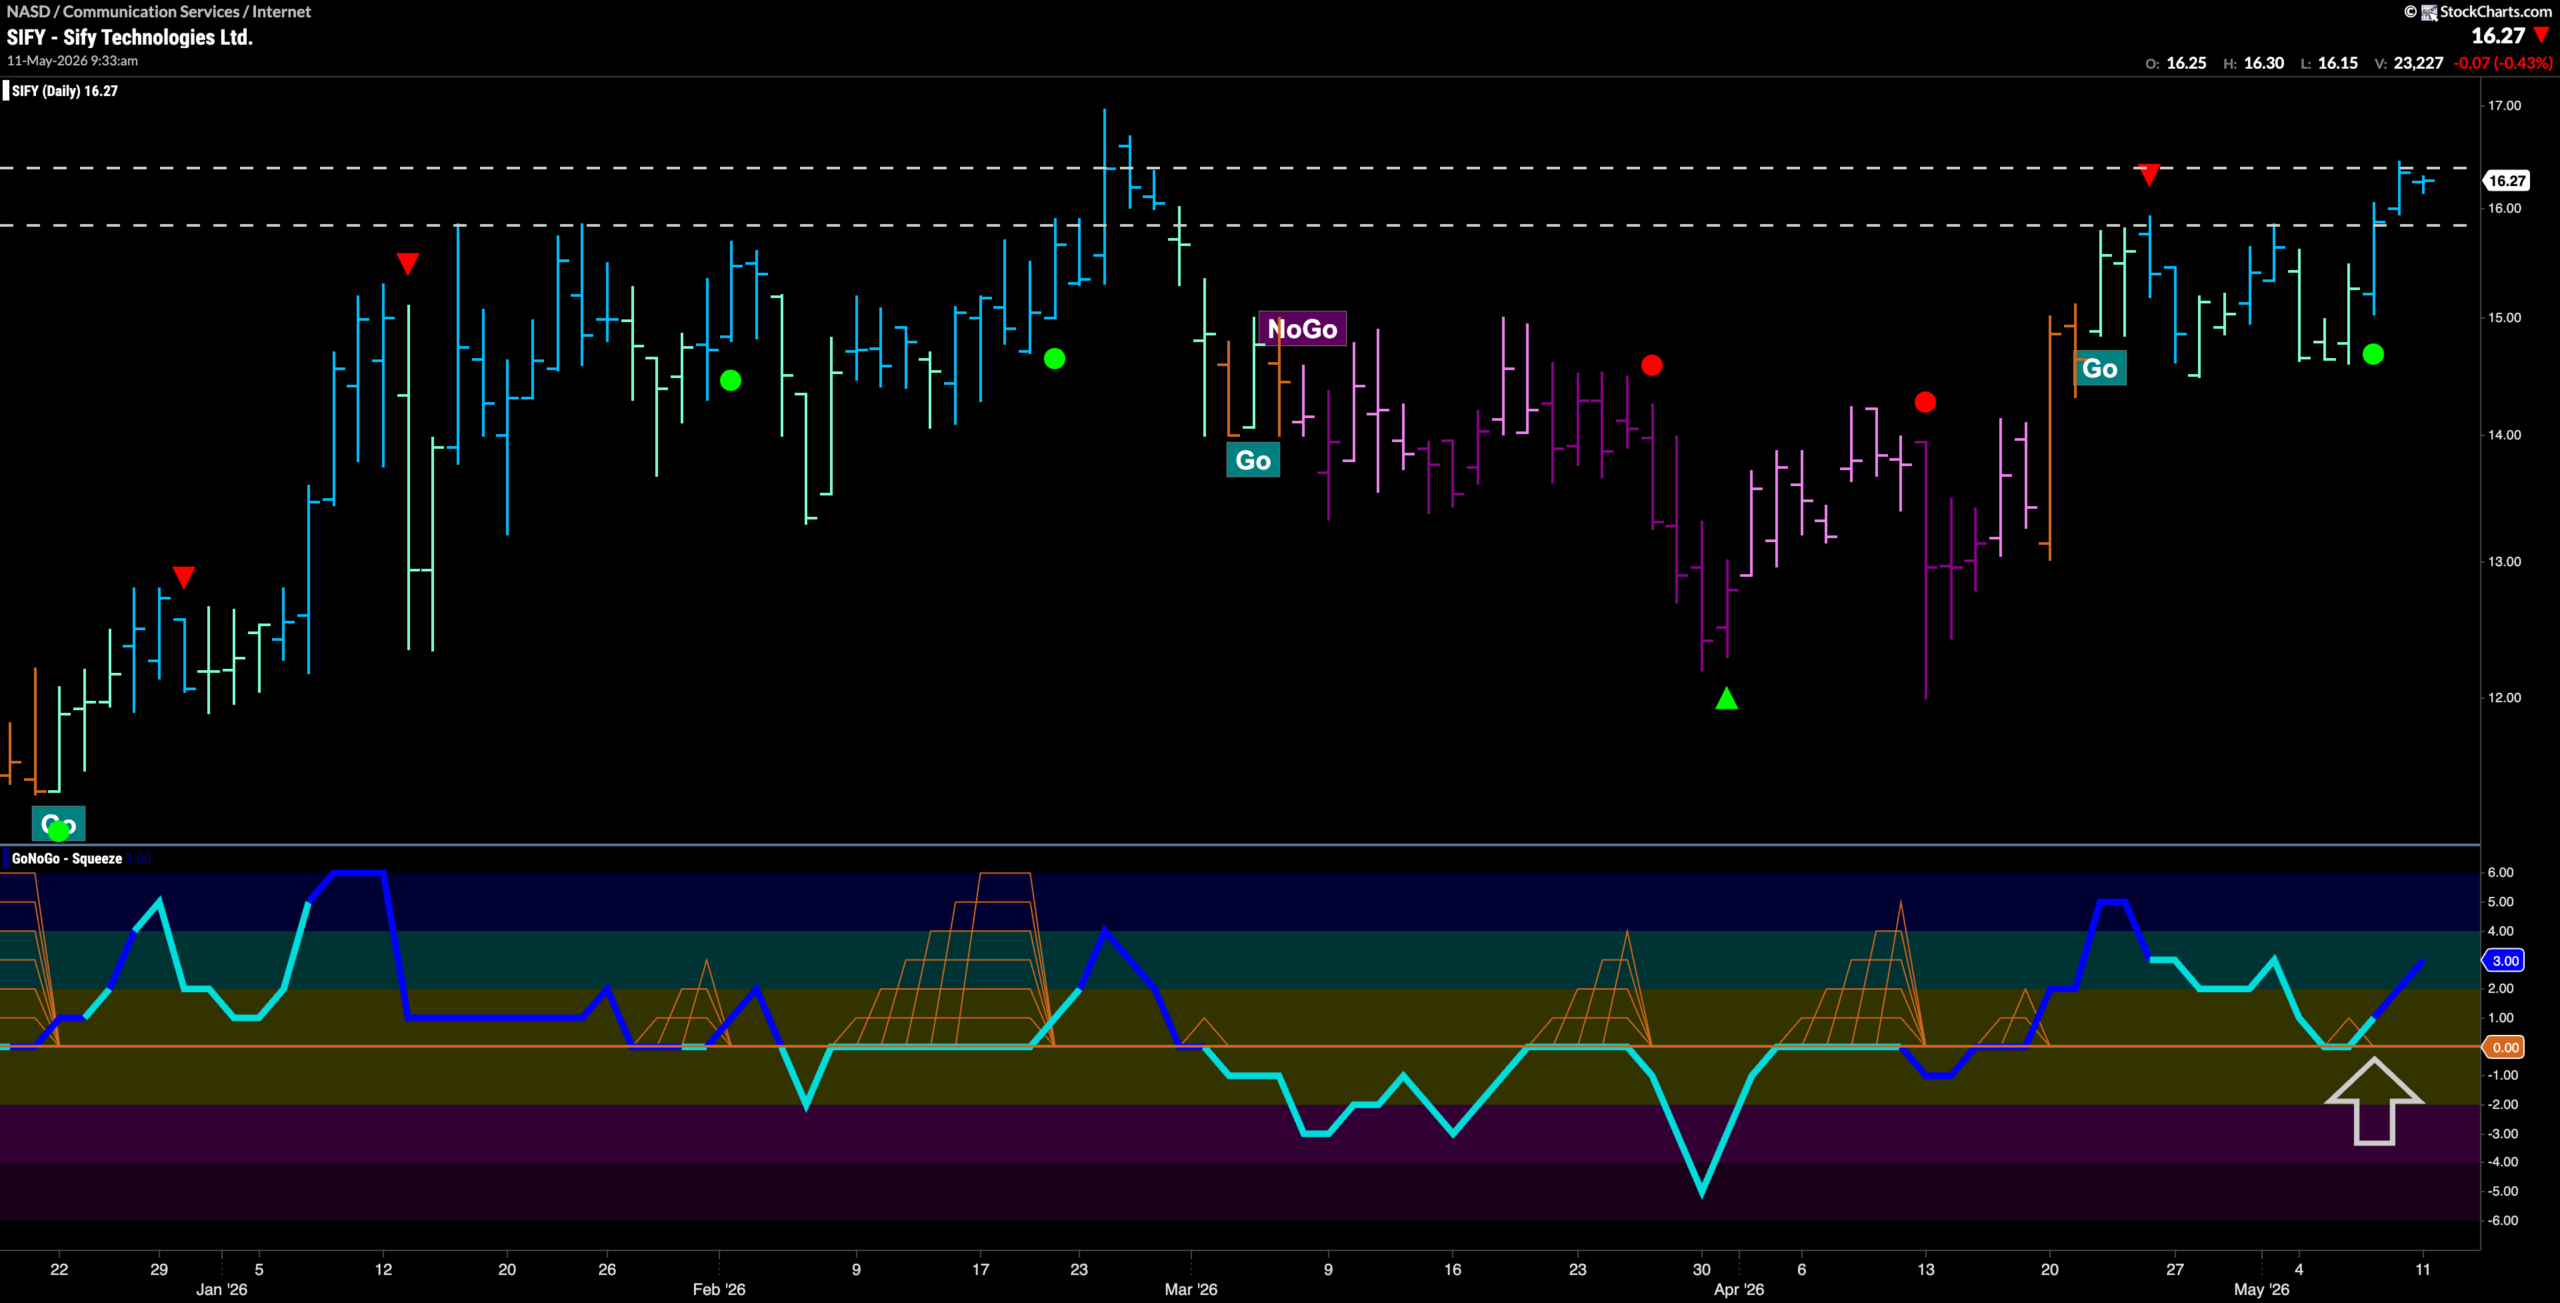
$SIFY Looks for New High
$SIFY is in a new “Go” trend and we see that it is running up against resistance from earlier in the chart. Recently, we saw that GoNoGo Oscillator bounced off the zero line back into positive territory and this triggered a Go Trend Continuation Icon (green circle) under price. We will watch to see if this gives price the boost it needs to climb above the resistance we see on the chart and set a new higher high.