
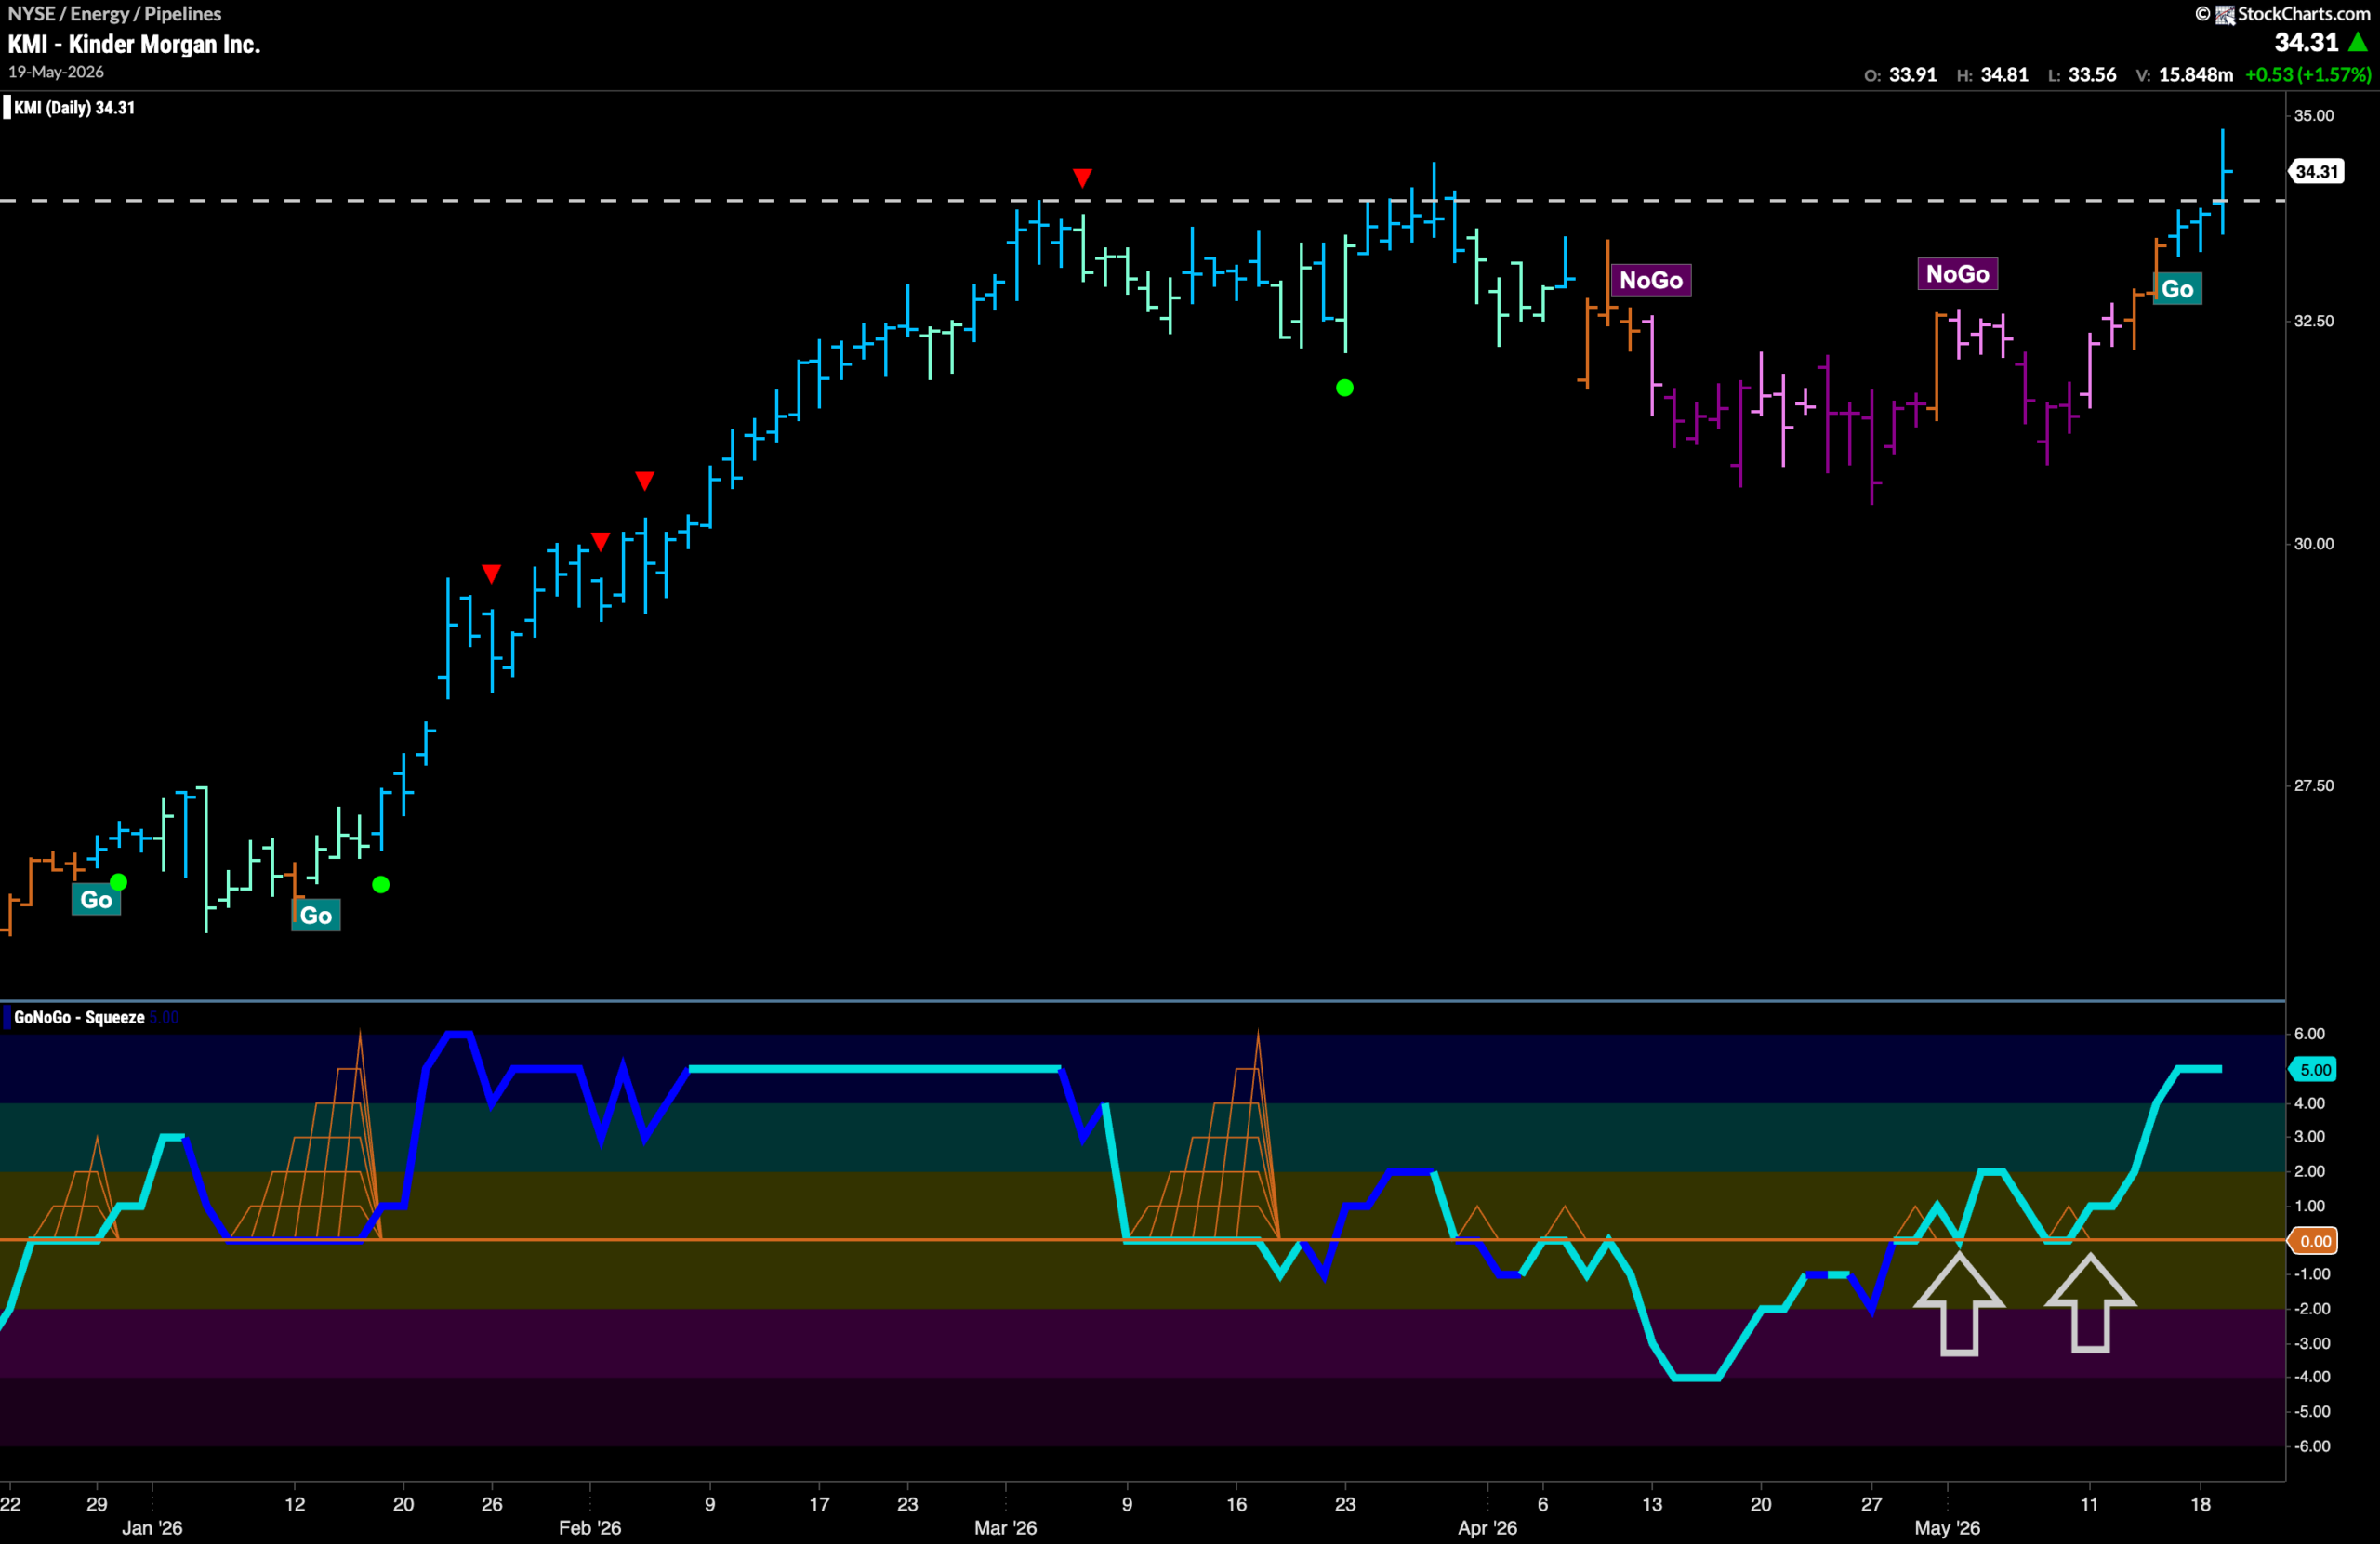

$KMI rode the energy wave to new highs earlier this year.
After a high in March, we saw the trend change, and GoNoGo Trend showed prices entering a “NoGo” trend that push the stock lower through April and early May. During this time, GoNoGo Oscillator was at or below the zero line as momentum was in line with the “NoGo” Trend. So far this month, we have seen momentum rally and GoNoGo break through the zero line into positive territory and begin to find support at that level. This upswing in momentum helped price climb from the lows and we saw amber “Go Fish” bars of uncertainty before GoNoGo Trend was able to begin to paint fresh “Go” bars. Now, with the indicator showing strength with bright blue bars, we see that price has broken above the horizontal resistance we see on the chart and moved to a new higher high. We will watch to see if price can consolidate at these elevated levels and potentially climb further in the coming days.





