
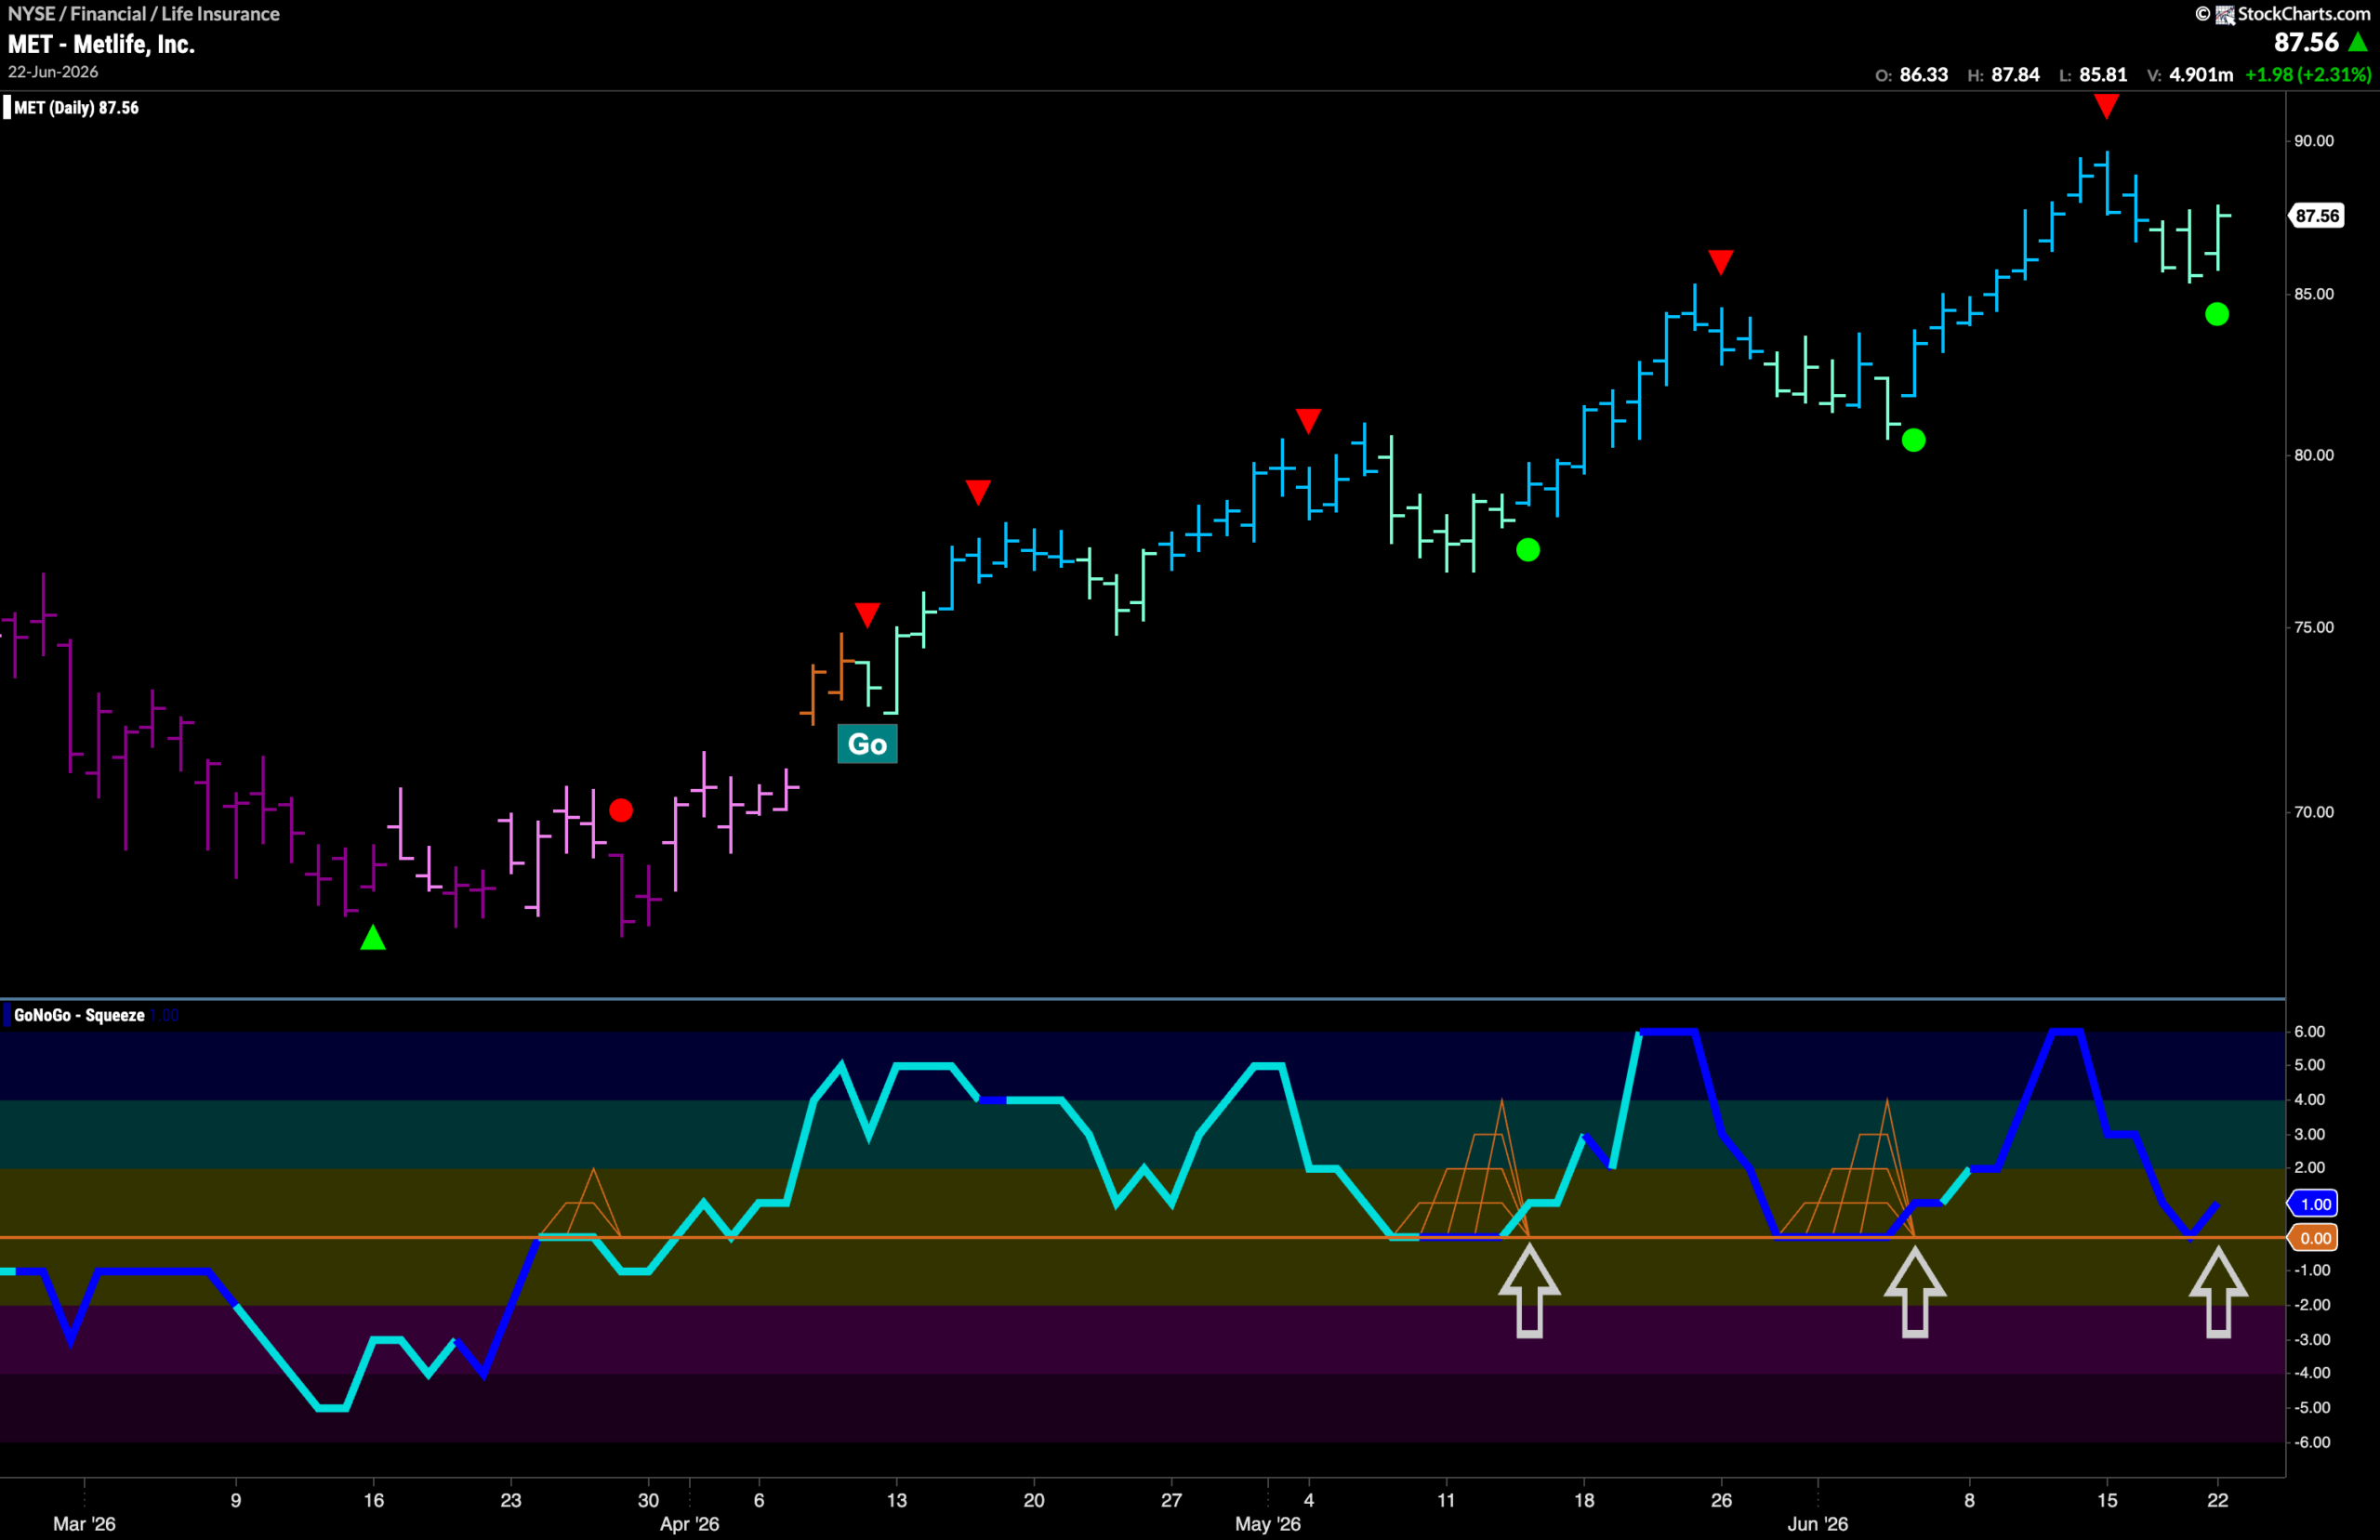

$MET has been in a “Go” trend since early April.
Since then, we have seen a series of higher highs and higher lows as price has climbed to almost $90. We can see that throughout this trend there have been periods of weakness as price falls against the trend after making a new high. Each time this has happened, we can turn our attention to the oscillator panel and note that GoNoGo Oscillator has found support at the zero line. This tells us that momentum has remained in line with the “Go” trend. As price rallies back into positive territory, we see a Go Trend Continuation Icon (green circle) each time, informing us that momentum is resurgent in the direction of the trend. Most recently, we see the same situation playing out. After the last high, we saw a Go Countertrend Correction Icon (red arrow) and as price fell on weaker aqua bars, GoNoGo Oscillator again tested the zero level. It has quickly found support, and we see another Go Trend Continuation Icon (green circle) under the price bar. We know therefore that momentum is again surging in the direction of the trend, and we will watch to see if this gives price the boost it needs to attack another higher high in the coming days.





