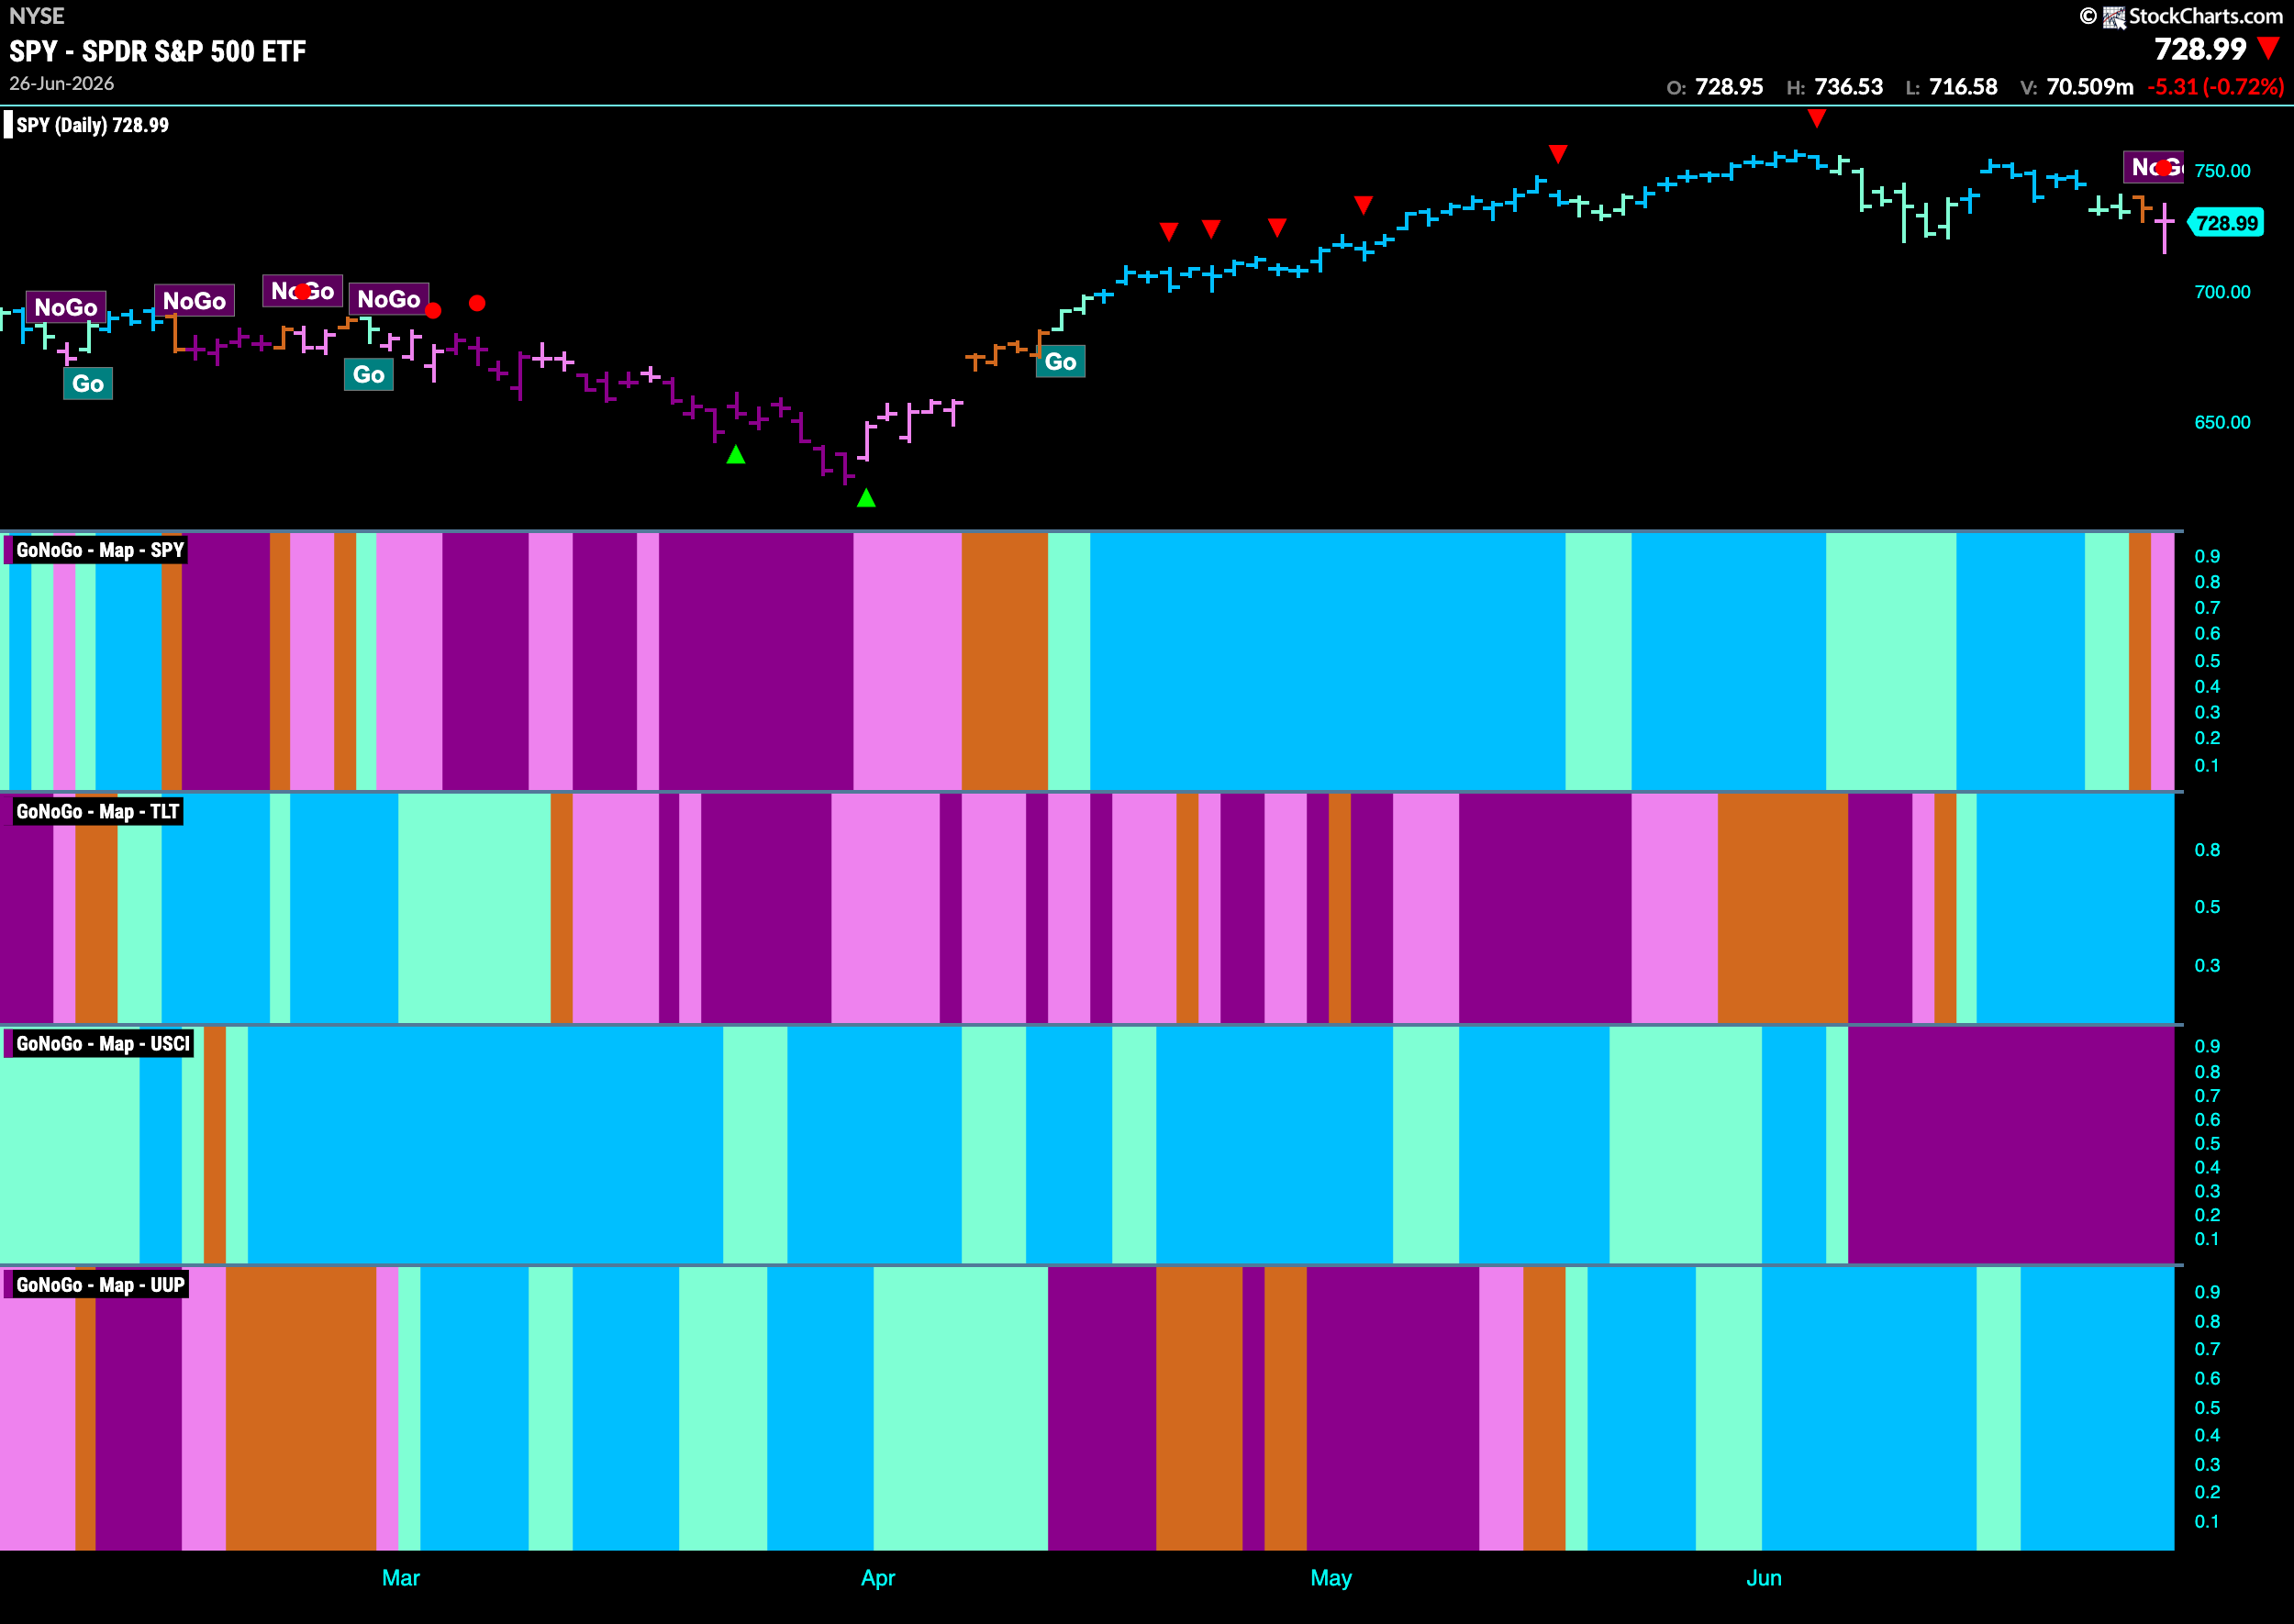
Good morning and welcome to this week’s Flight Path. The equity trend gave way to first an amber “Go Fish” bar and then a weak pink “NoGo” as the trend in equities changed. Treasury bond prices remained in a strong “Go” trend with a week of uninterrupted bright blue bars. U.S. commodities saw the “NoGo” trend stay strong with a week of purple bars and the dollar went seemingly from strength to strength with bright blue “Go” bars.
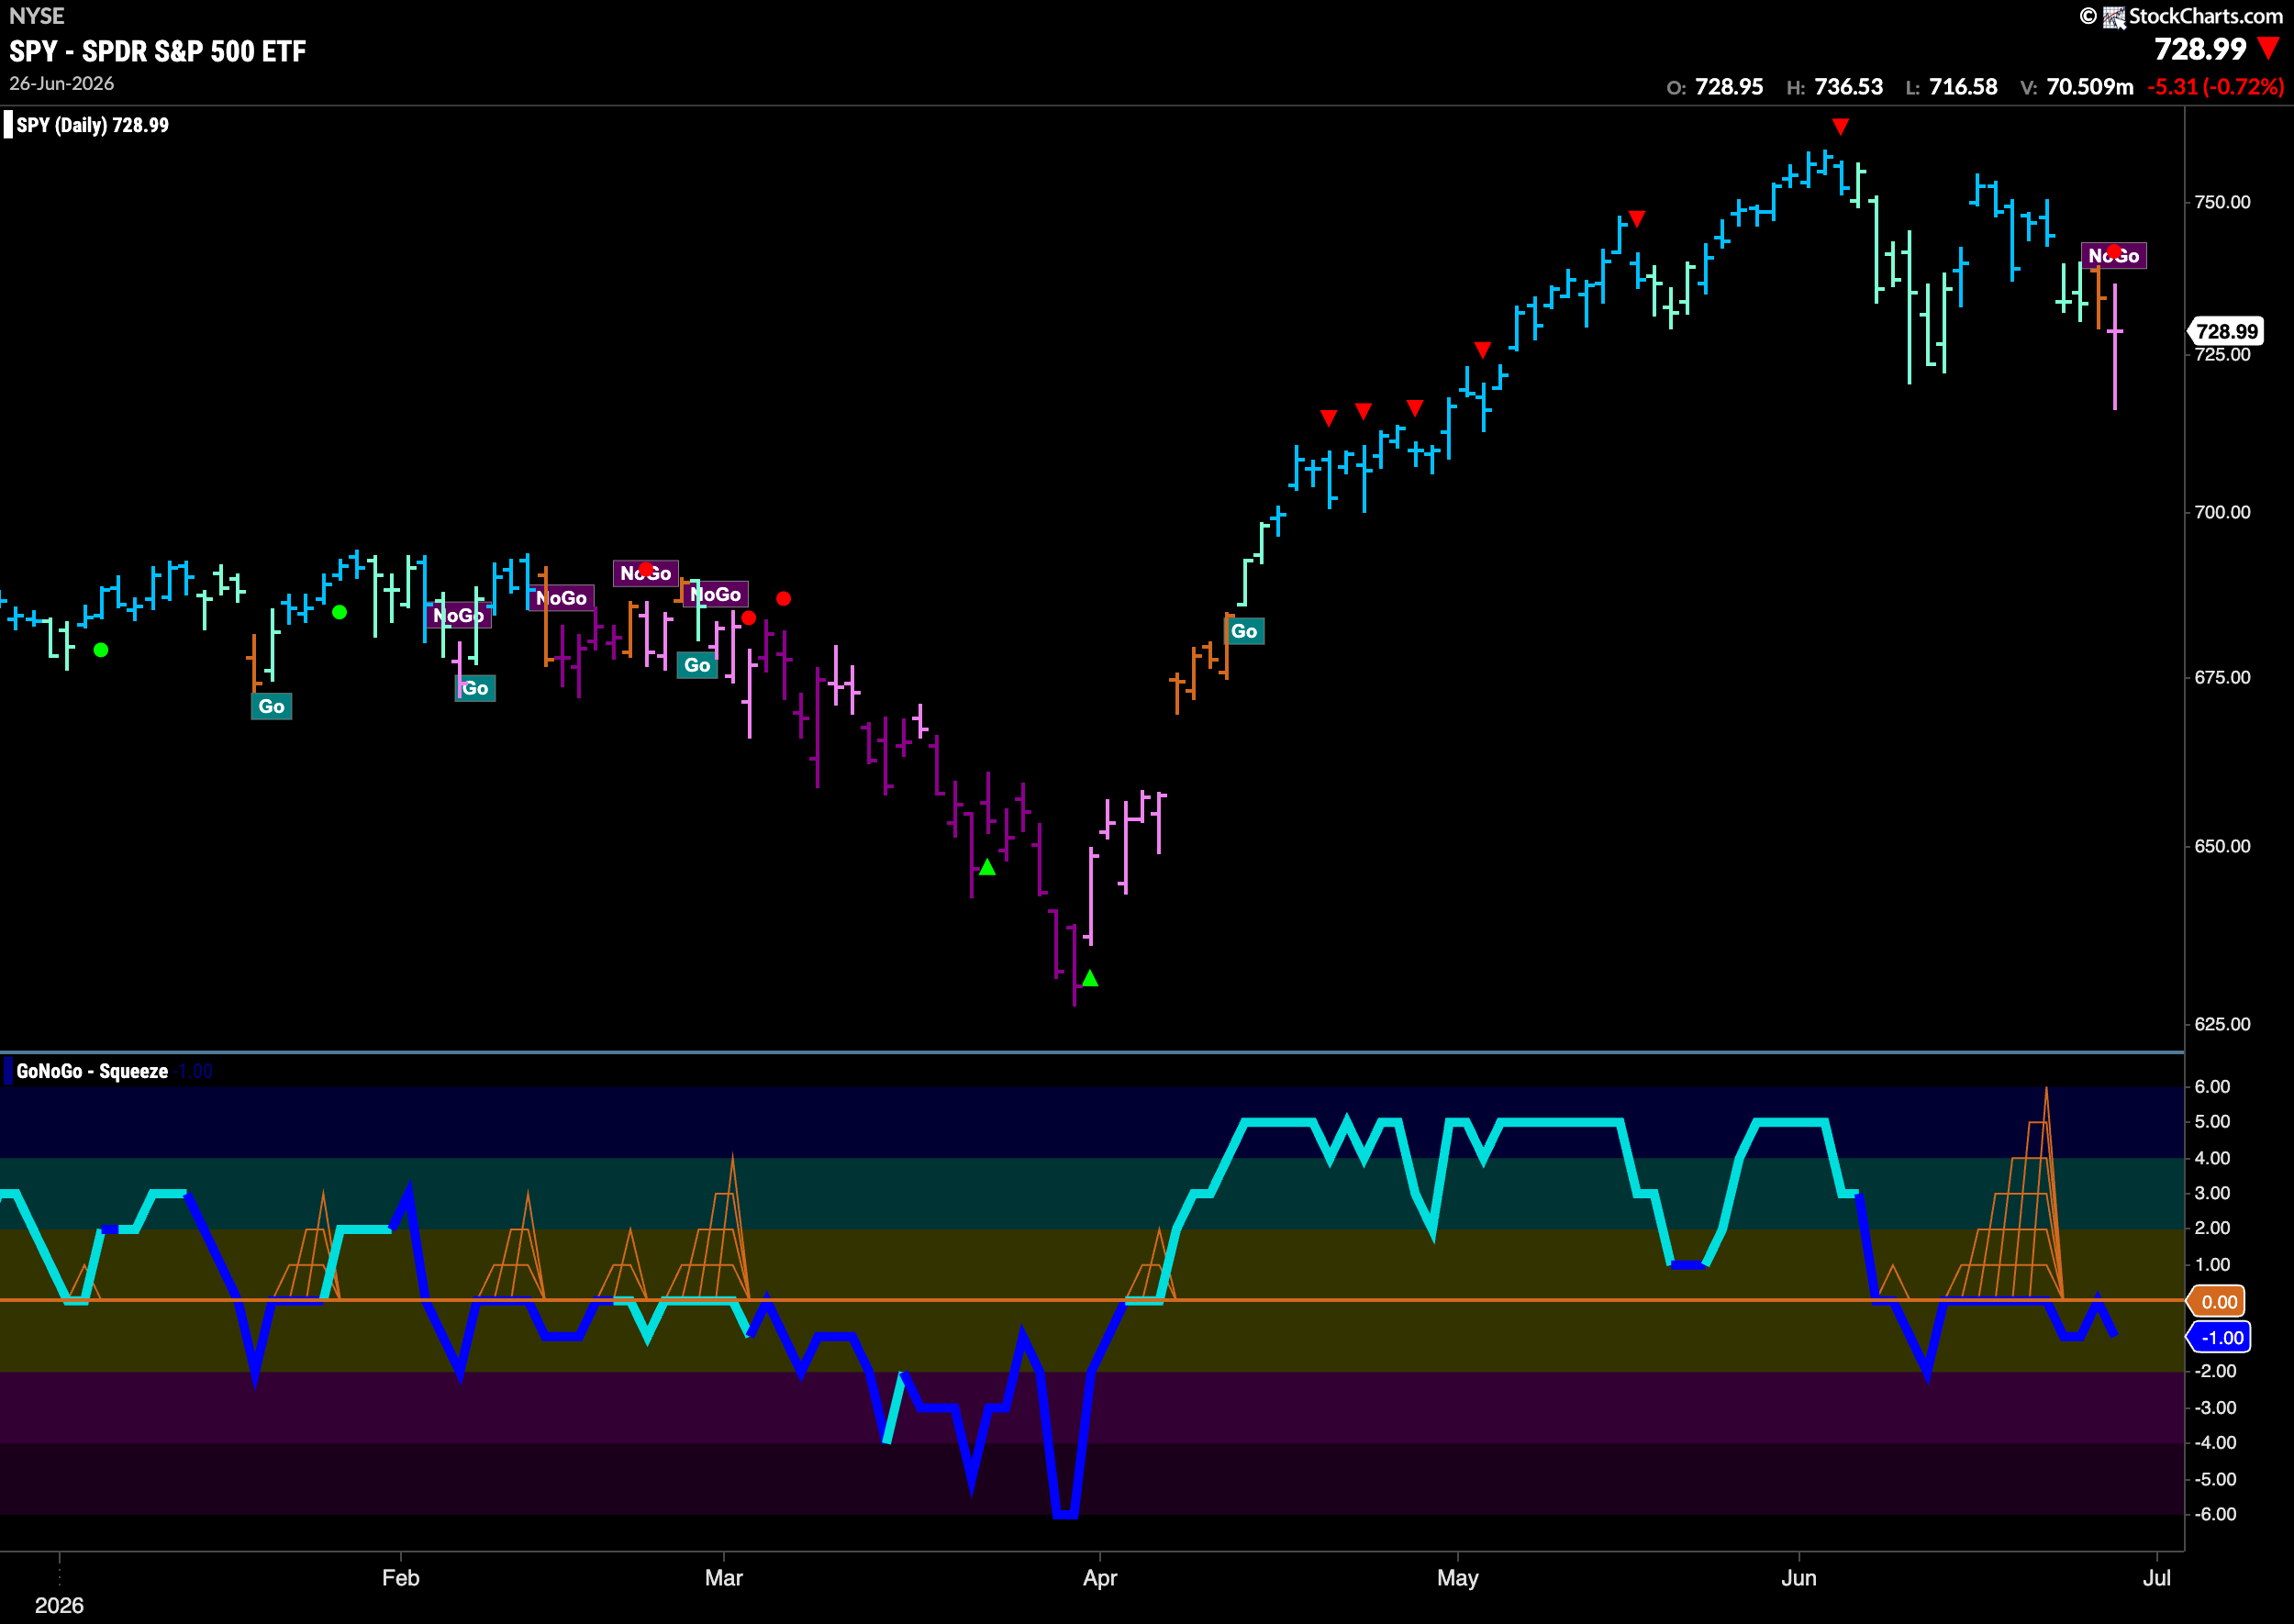
$SPY Falls out of “Go” Trend
The GoNoGo chart below shows that the “Go” trend succumbed to market pressure this past week. First, after failing to set a new high, we saw GoNoGo Trend paint weaker aqua bars. Then, an amber “Go Fish” bar reflected market uncertainty before the indicator painted a pink “NoGo”. This came after GoNoGo Oscillator broke out of a Max GoNoGo Squeeze into negative territory. Now, with a “NoGo” in place, we see that momentum is on the side of the new trend at -1.
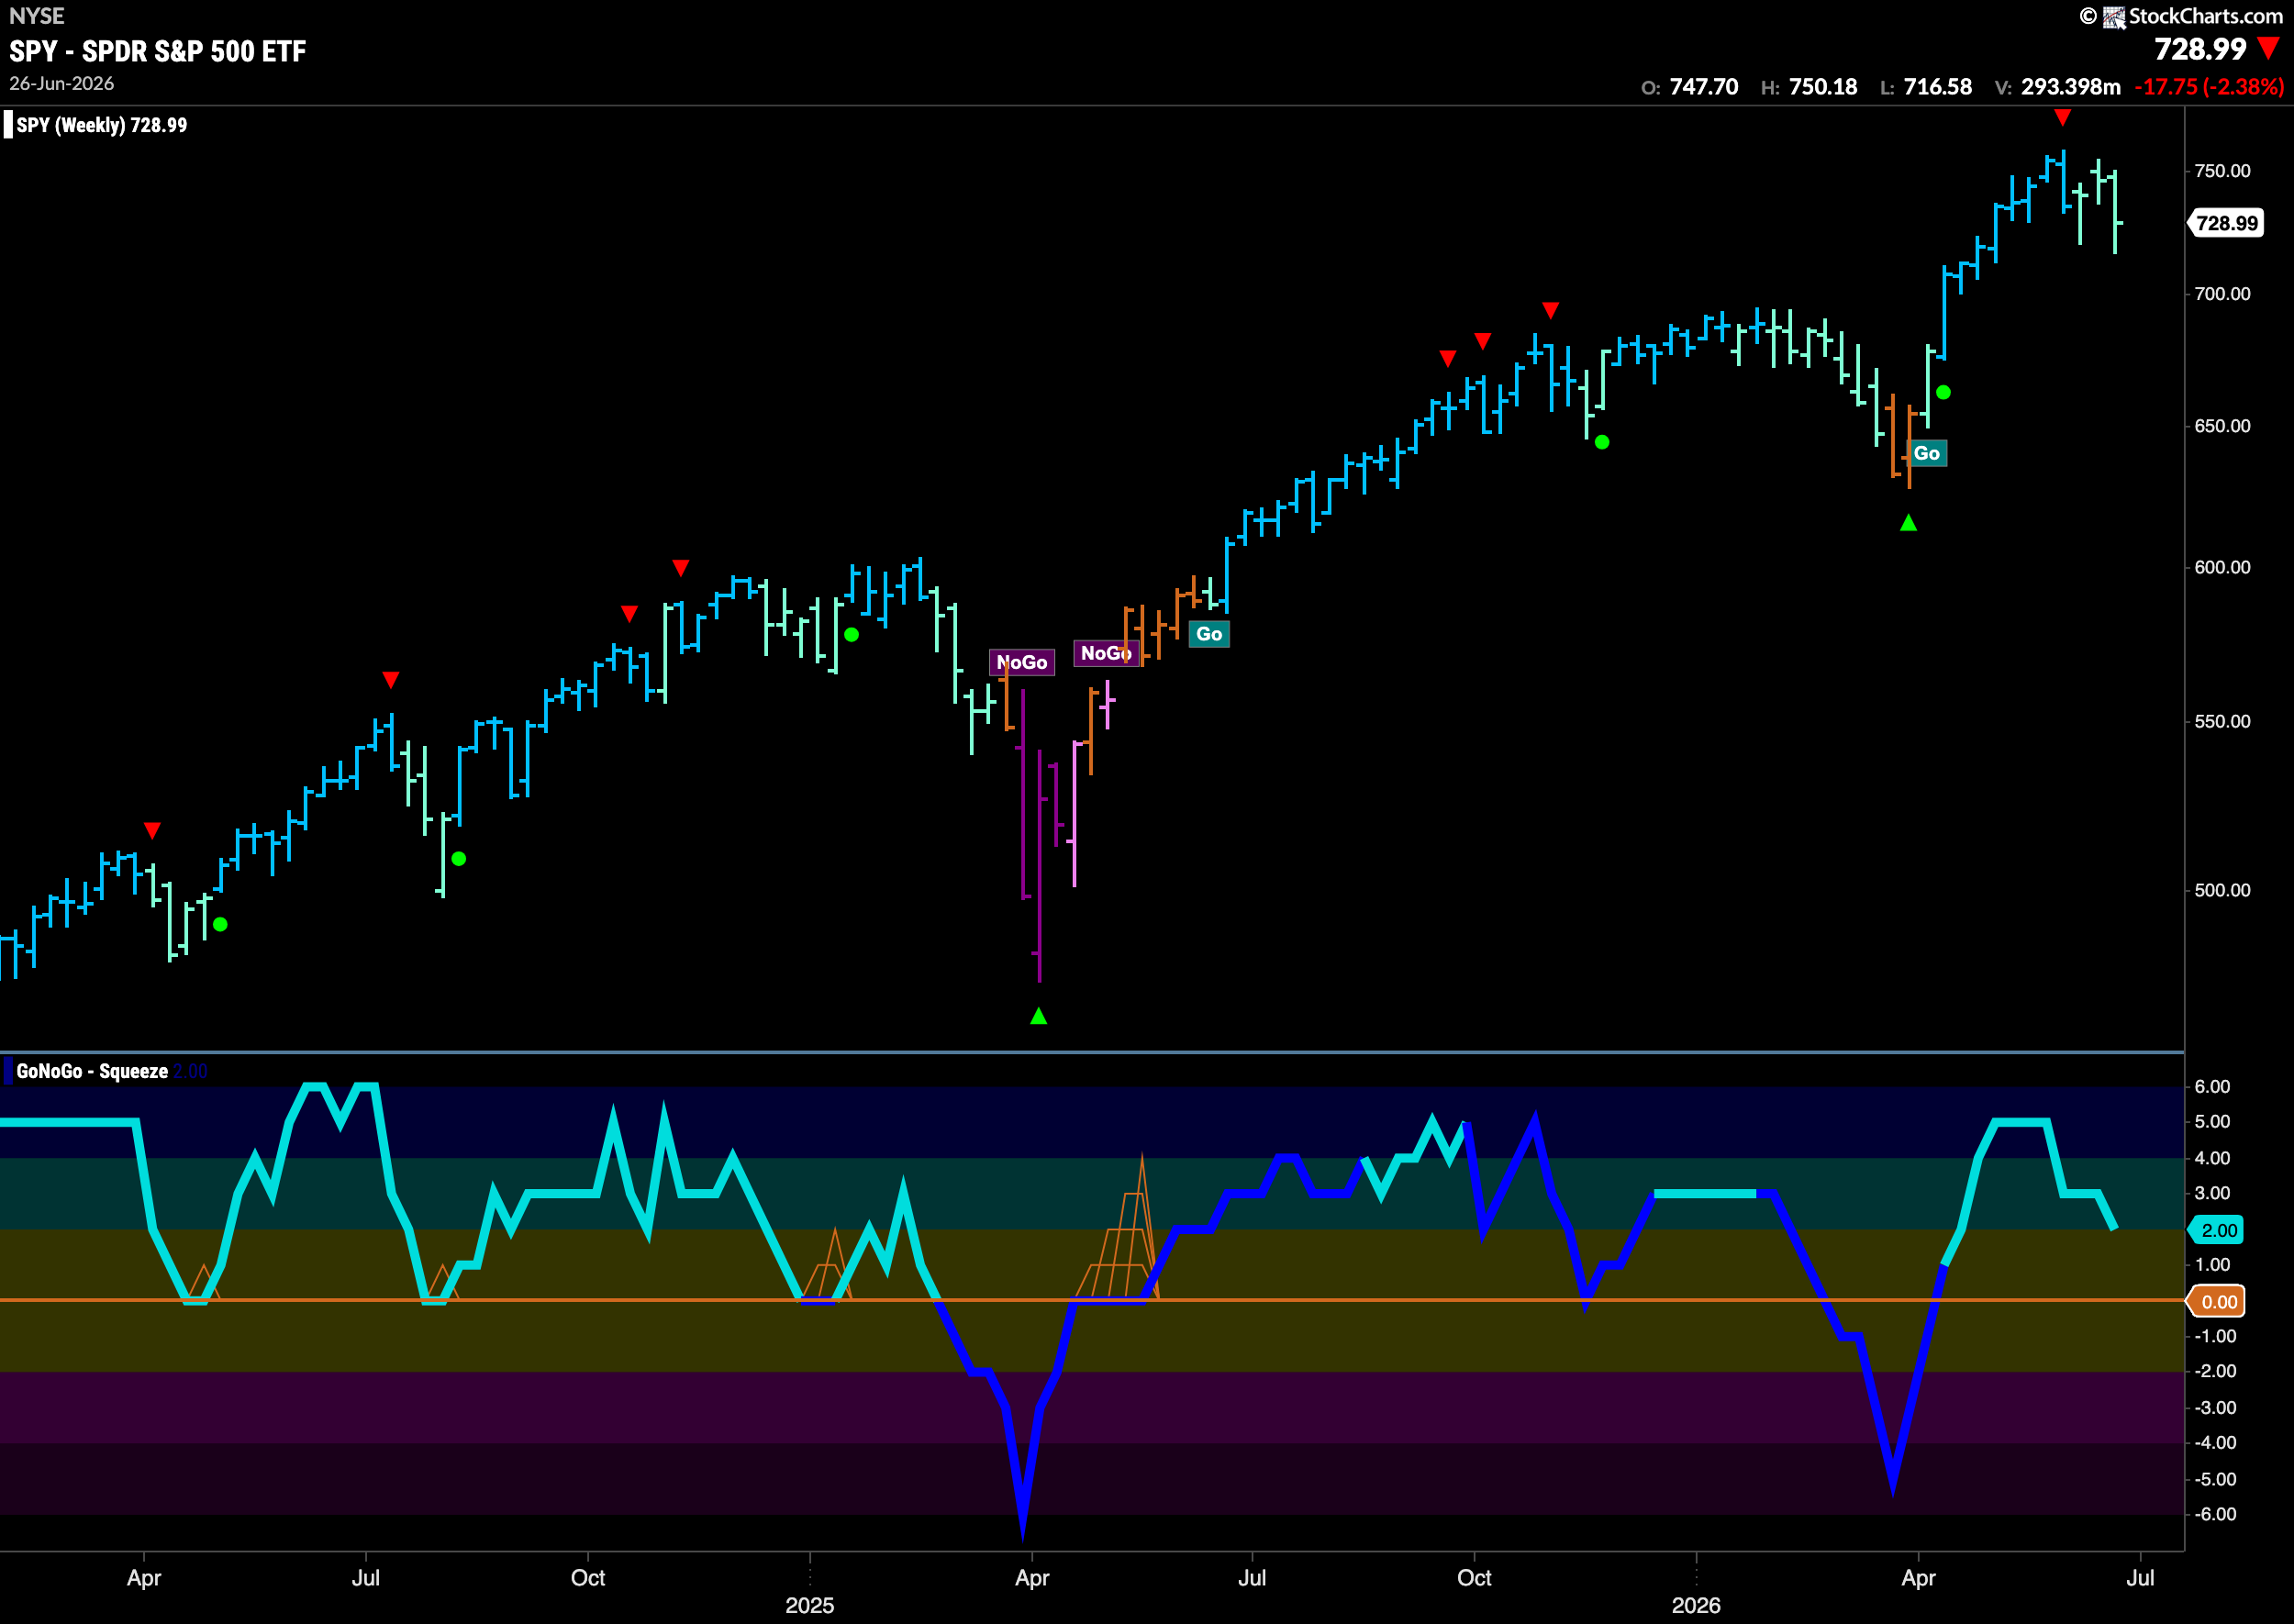
The weekly chart shows that the GoNoGo Trend indicator paints another bar of weakness. This is the third aqua bar in a row and another lower weekly close since the recent high. We saw a Go Countertrend Correction Icon (red arrow) at that high indicating price may struggle in the short term and it has done just that. GoNoGo Oscillator is falling toward the zero line.
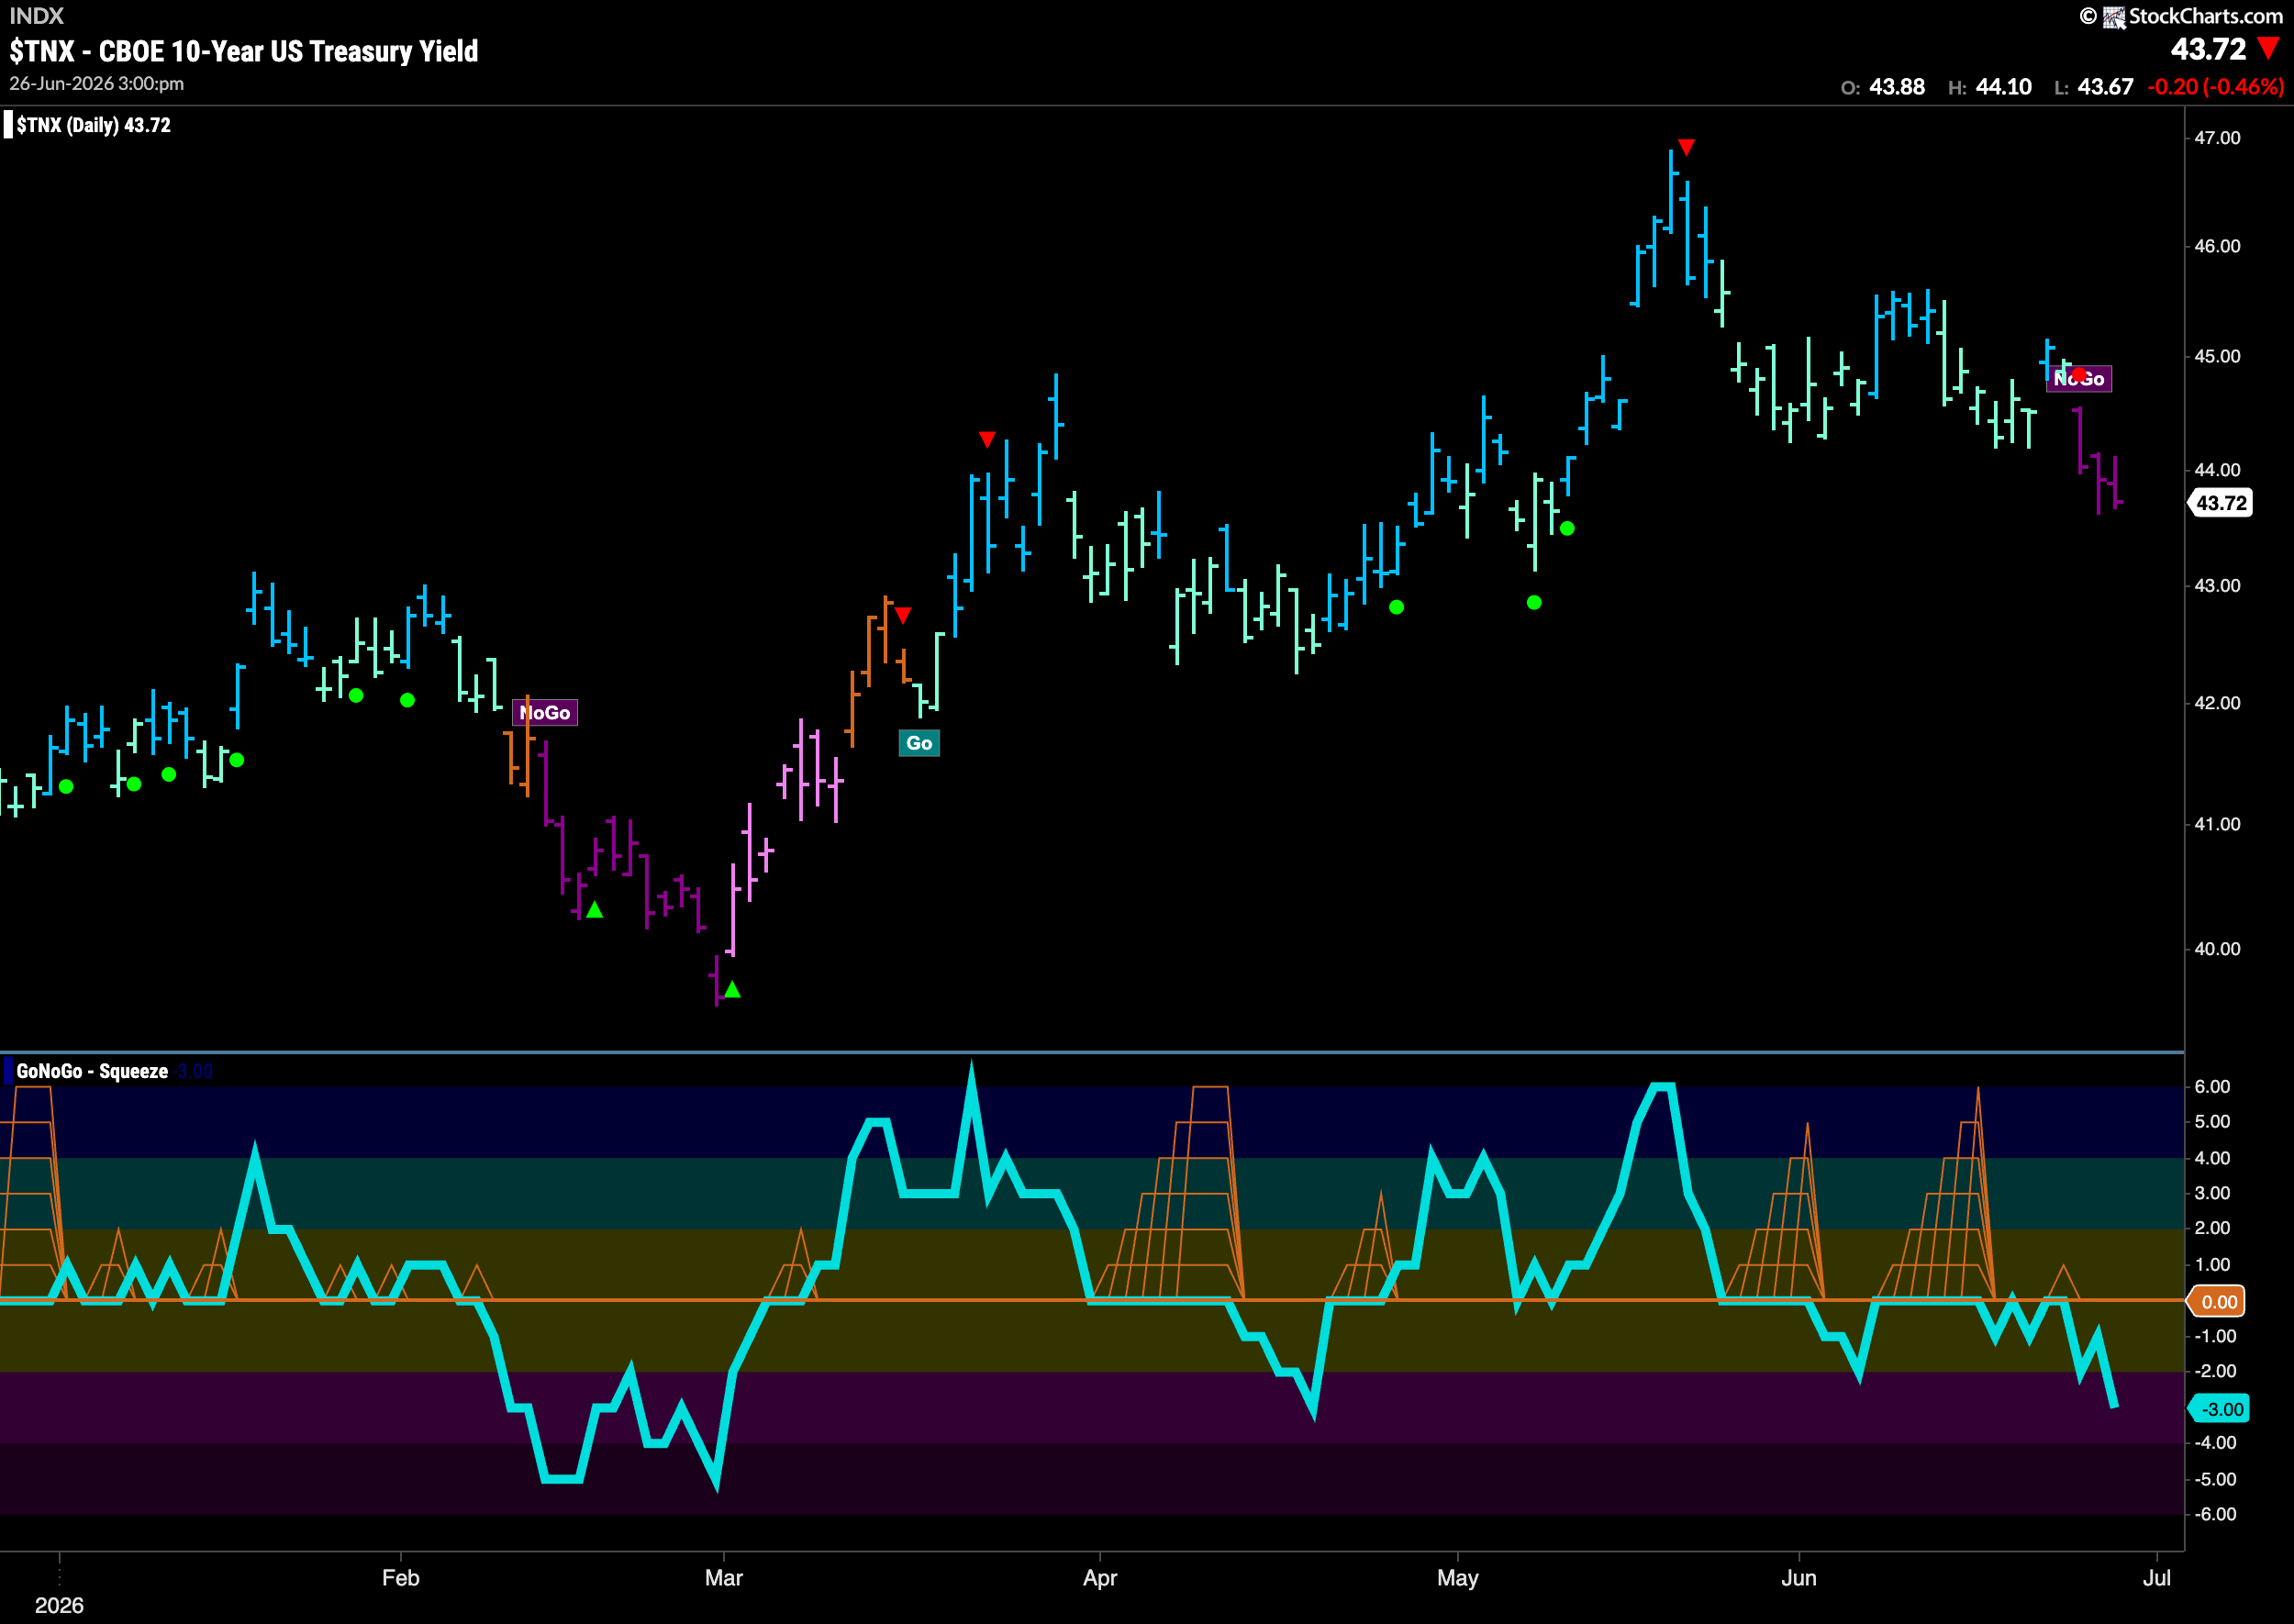
Treasury Rates Stay Enter Strong “NoGo”
GoNoGo Trend shows that there is a new “NoGo” trend in rates. After lower lows and lower highs following the late May high, we saw GoNoGo Trend paint strong purple bars last week on another lower low. This comes after GoNoGo Oscillator has repeatedly been rejected by the zero line and is now falling further into negative territory.
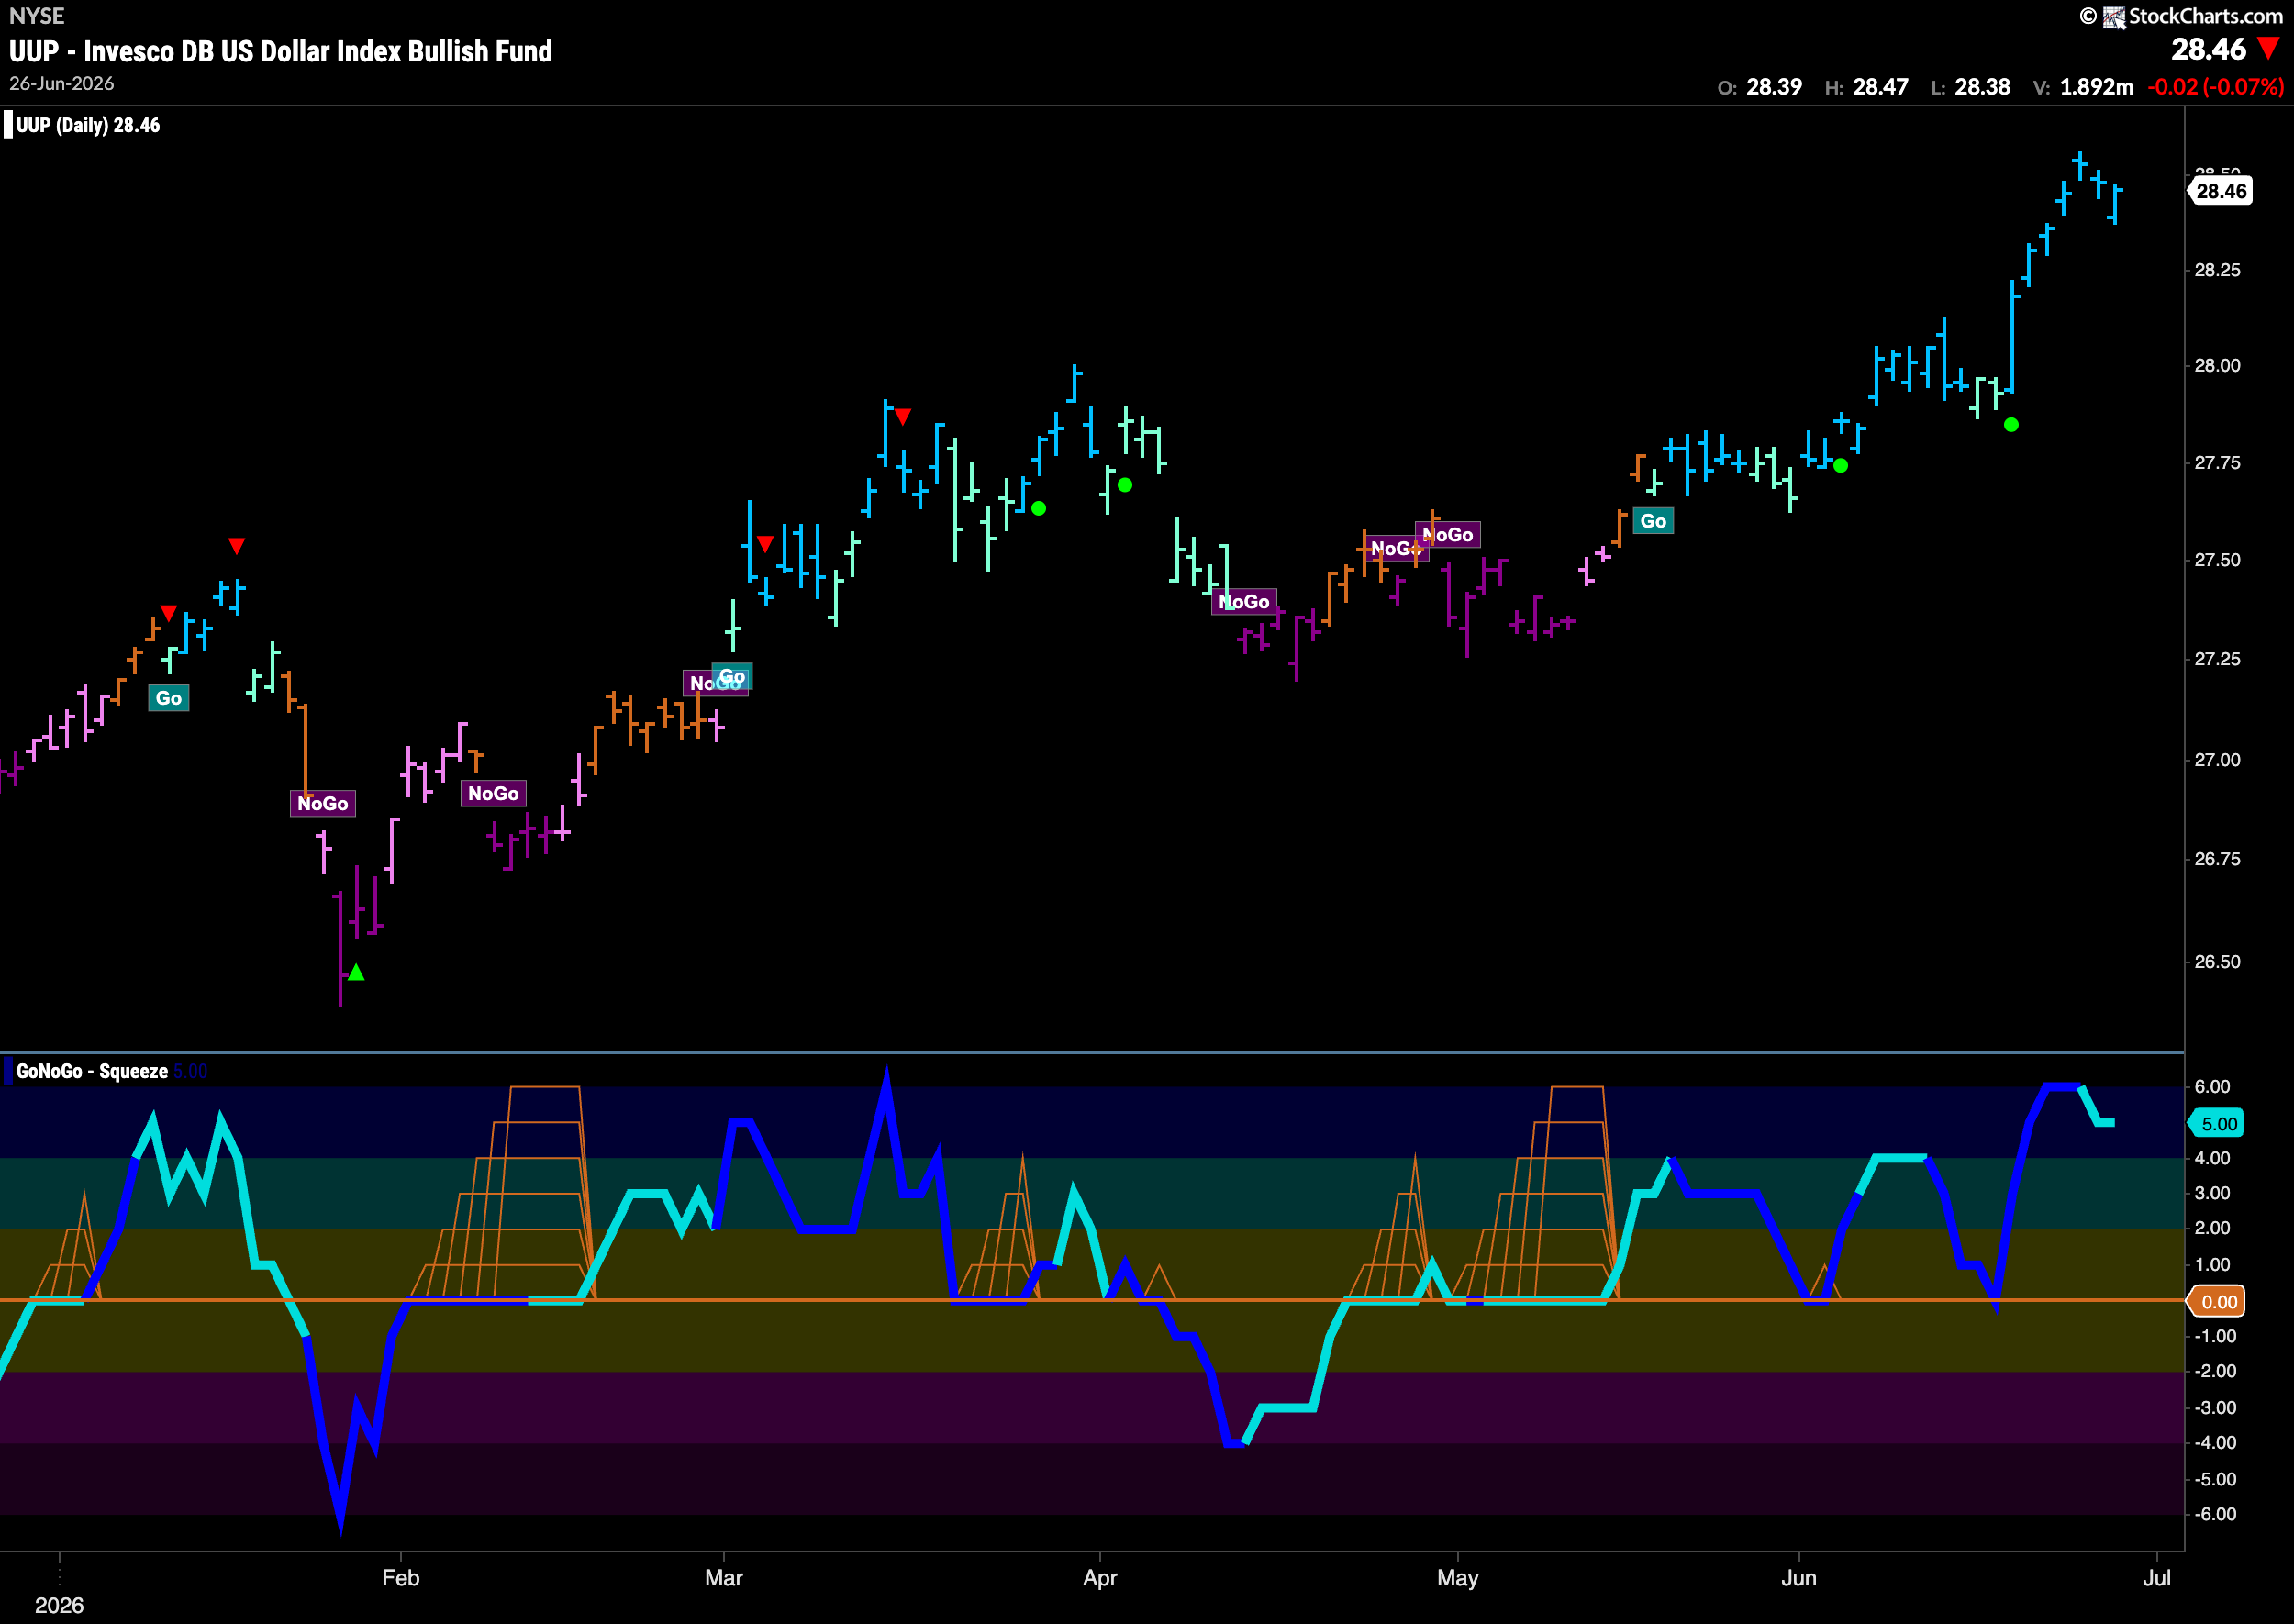
Dollar ($UUP) Hits Another Higher High
The chart below shows that the “Go” trend has gone from strength to strength again this week and we saw price soar to another higher high on strong blue bars. GoNoGo Oscillator remains in overbought territory but has come off from the extreme of 6. We will watch to see if price can consolidate at these higher levels in the coming days.
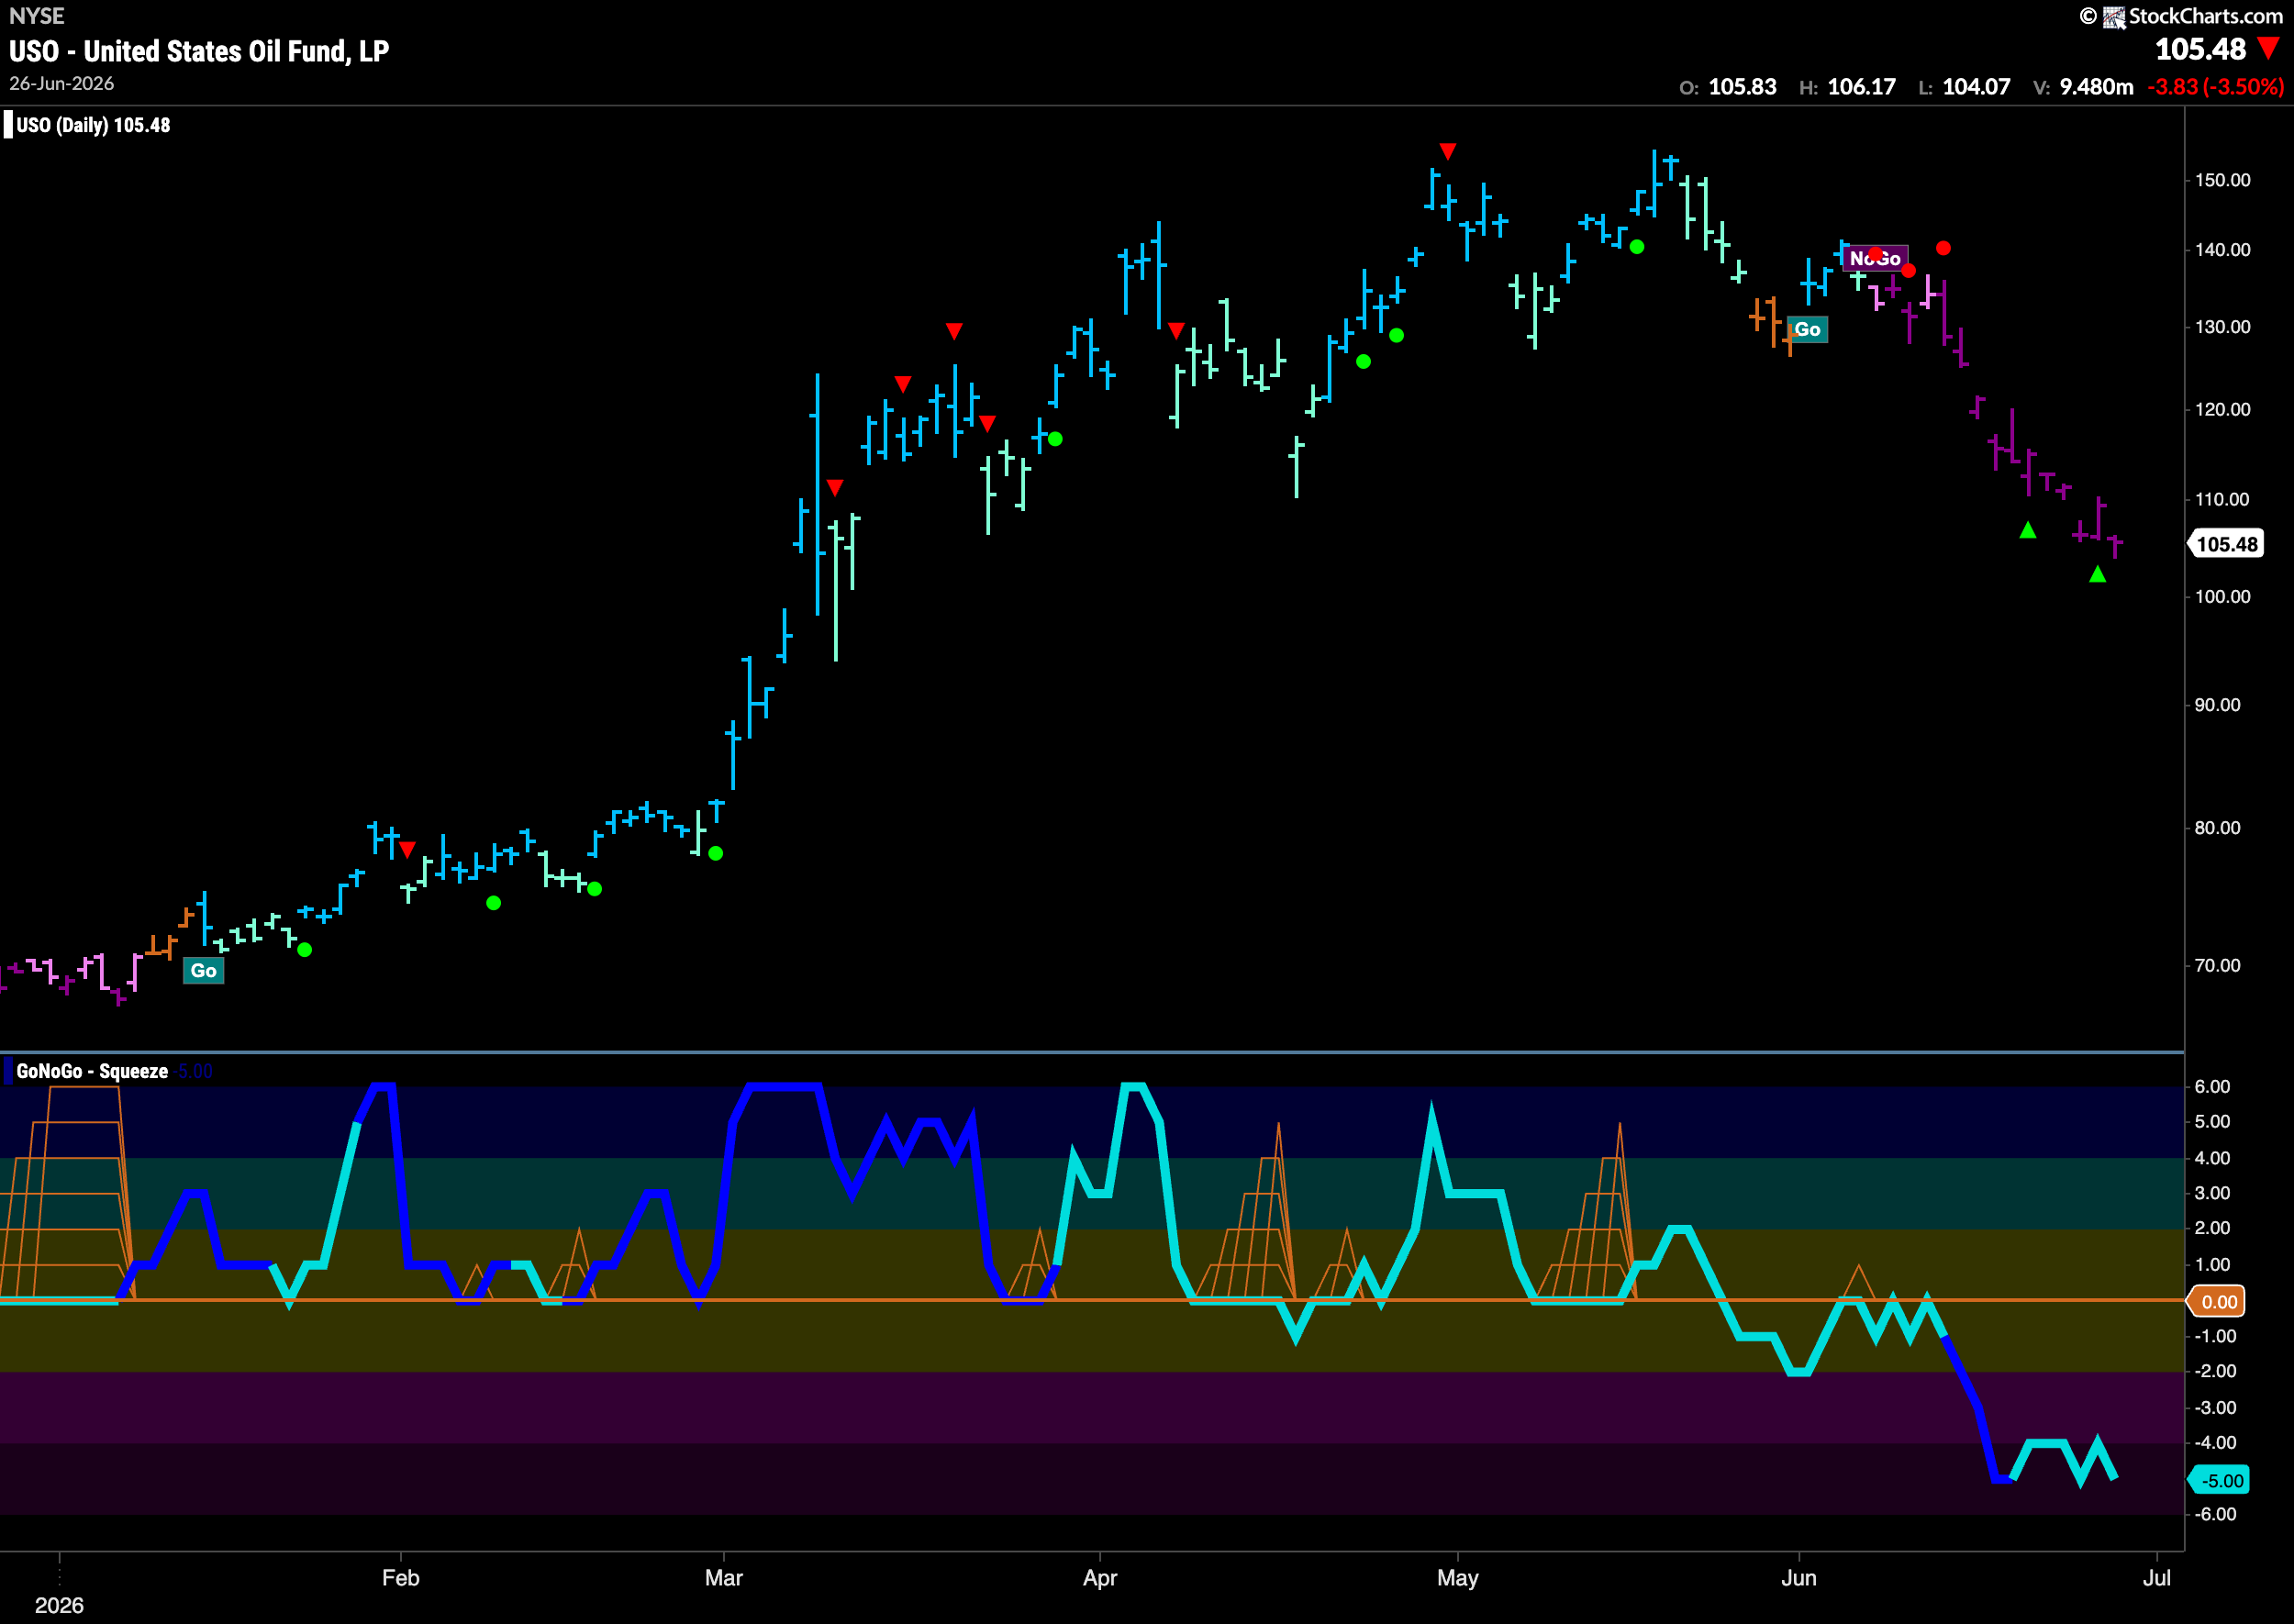
Oil ($USO) Continues its Slide
GoNoGo Trend shows that the “NoGo” trend continues this week and we saw price fall each day on strong purple bars. With price at a new longer term low and GoNoGo Oscillator remaining deep in negative territory there seems to be no respite on the horizon for oil.
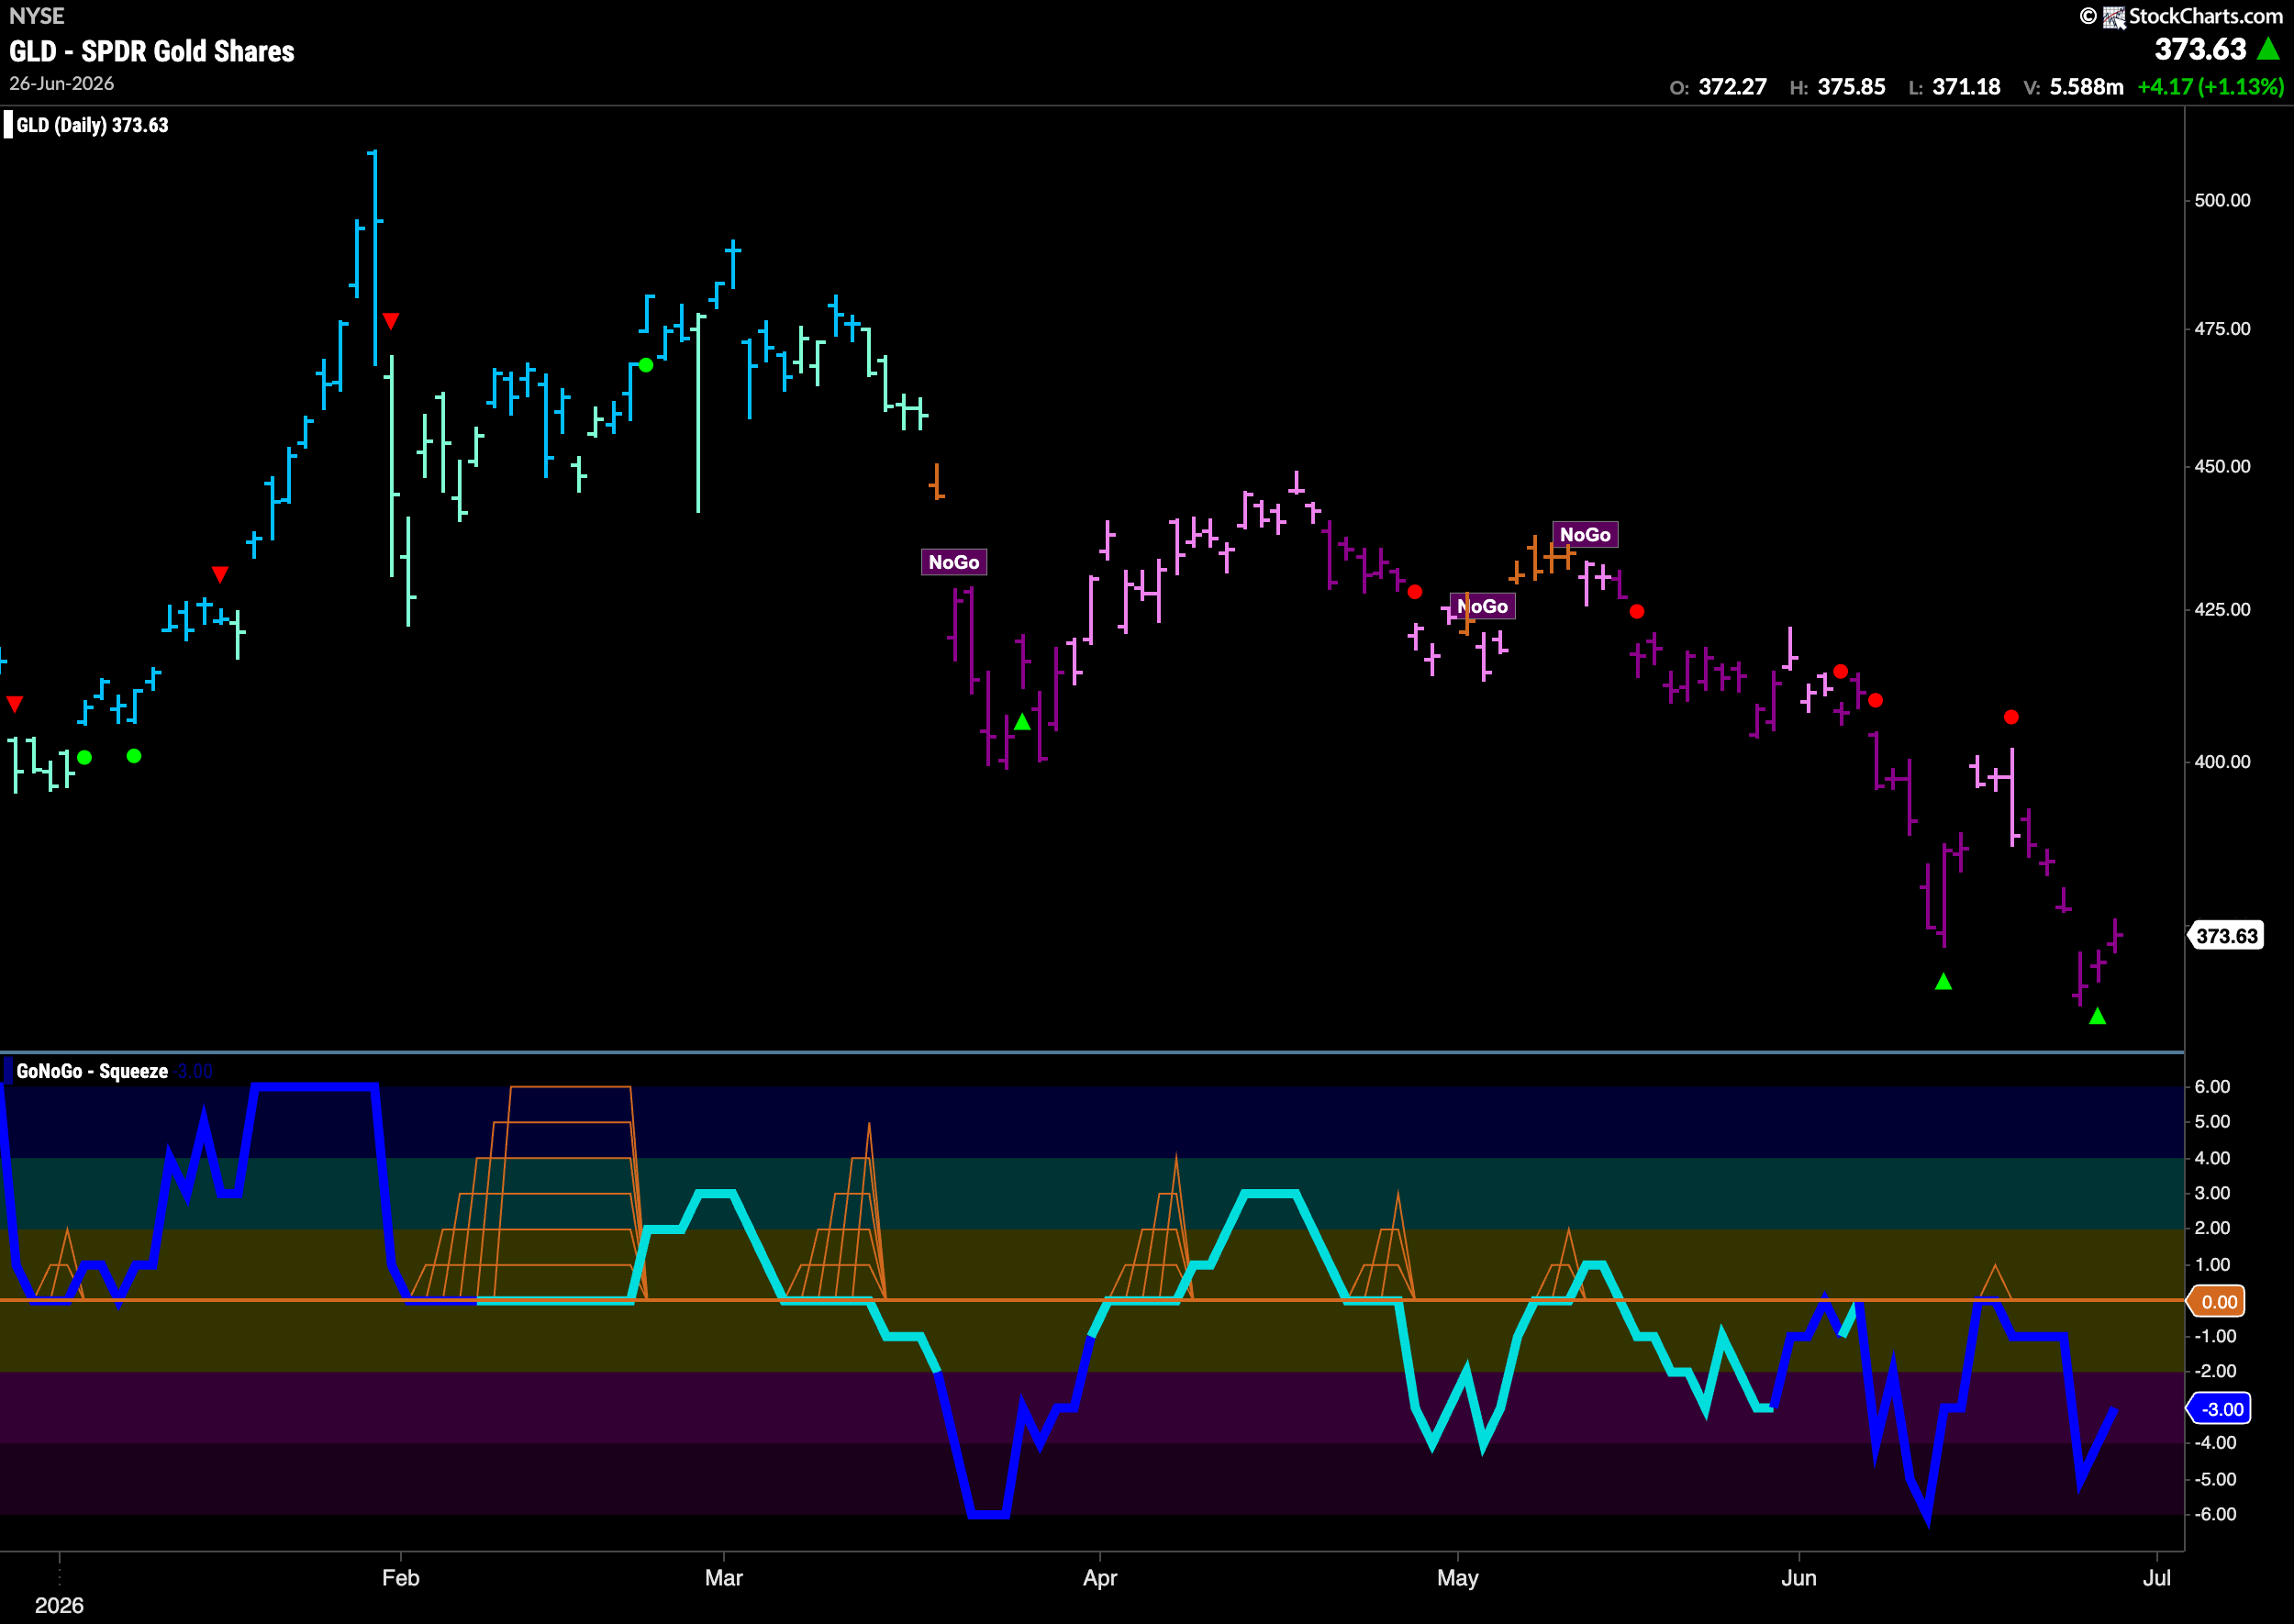
Gold ($GLD) “NoGo” Trend Stays Strong
The “NoGo” trend continues for gold this week and we saw a string of strong purple bars as price set a new lower low. At the low, we do see a NoGo Countertrend Correction Icon (green arrow) indicating that price may struggle to go lower in the short term and indeed that was followed by price edging higher. GoNoGo Oscillator remains in negative territory on heavy volume but no longer oversold at a value of -3.
Sector RelMap
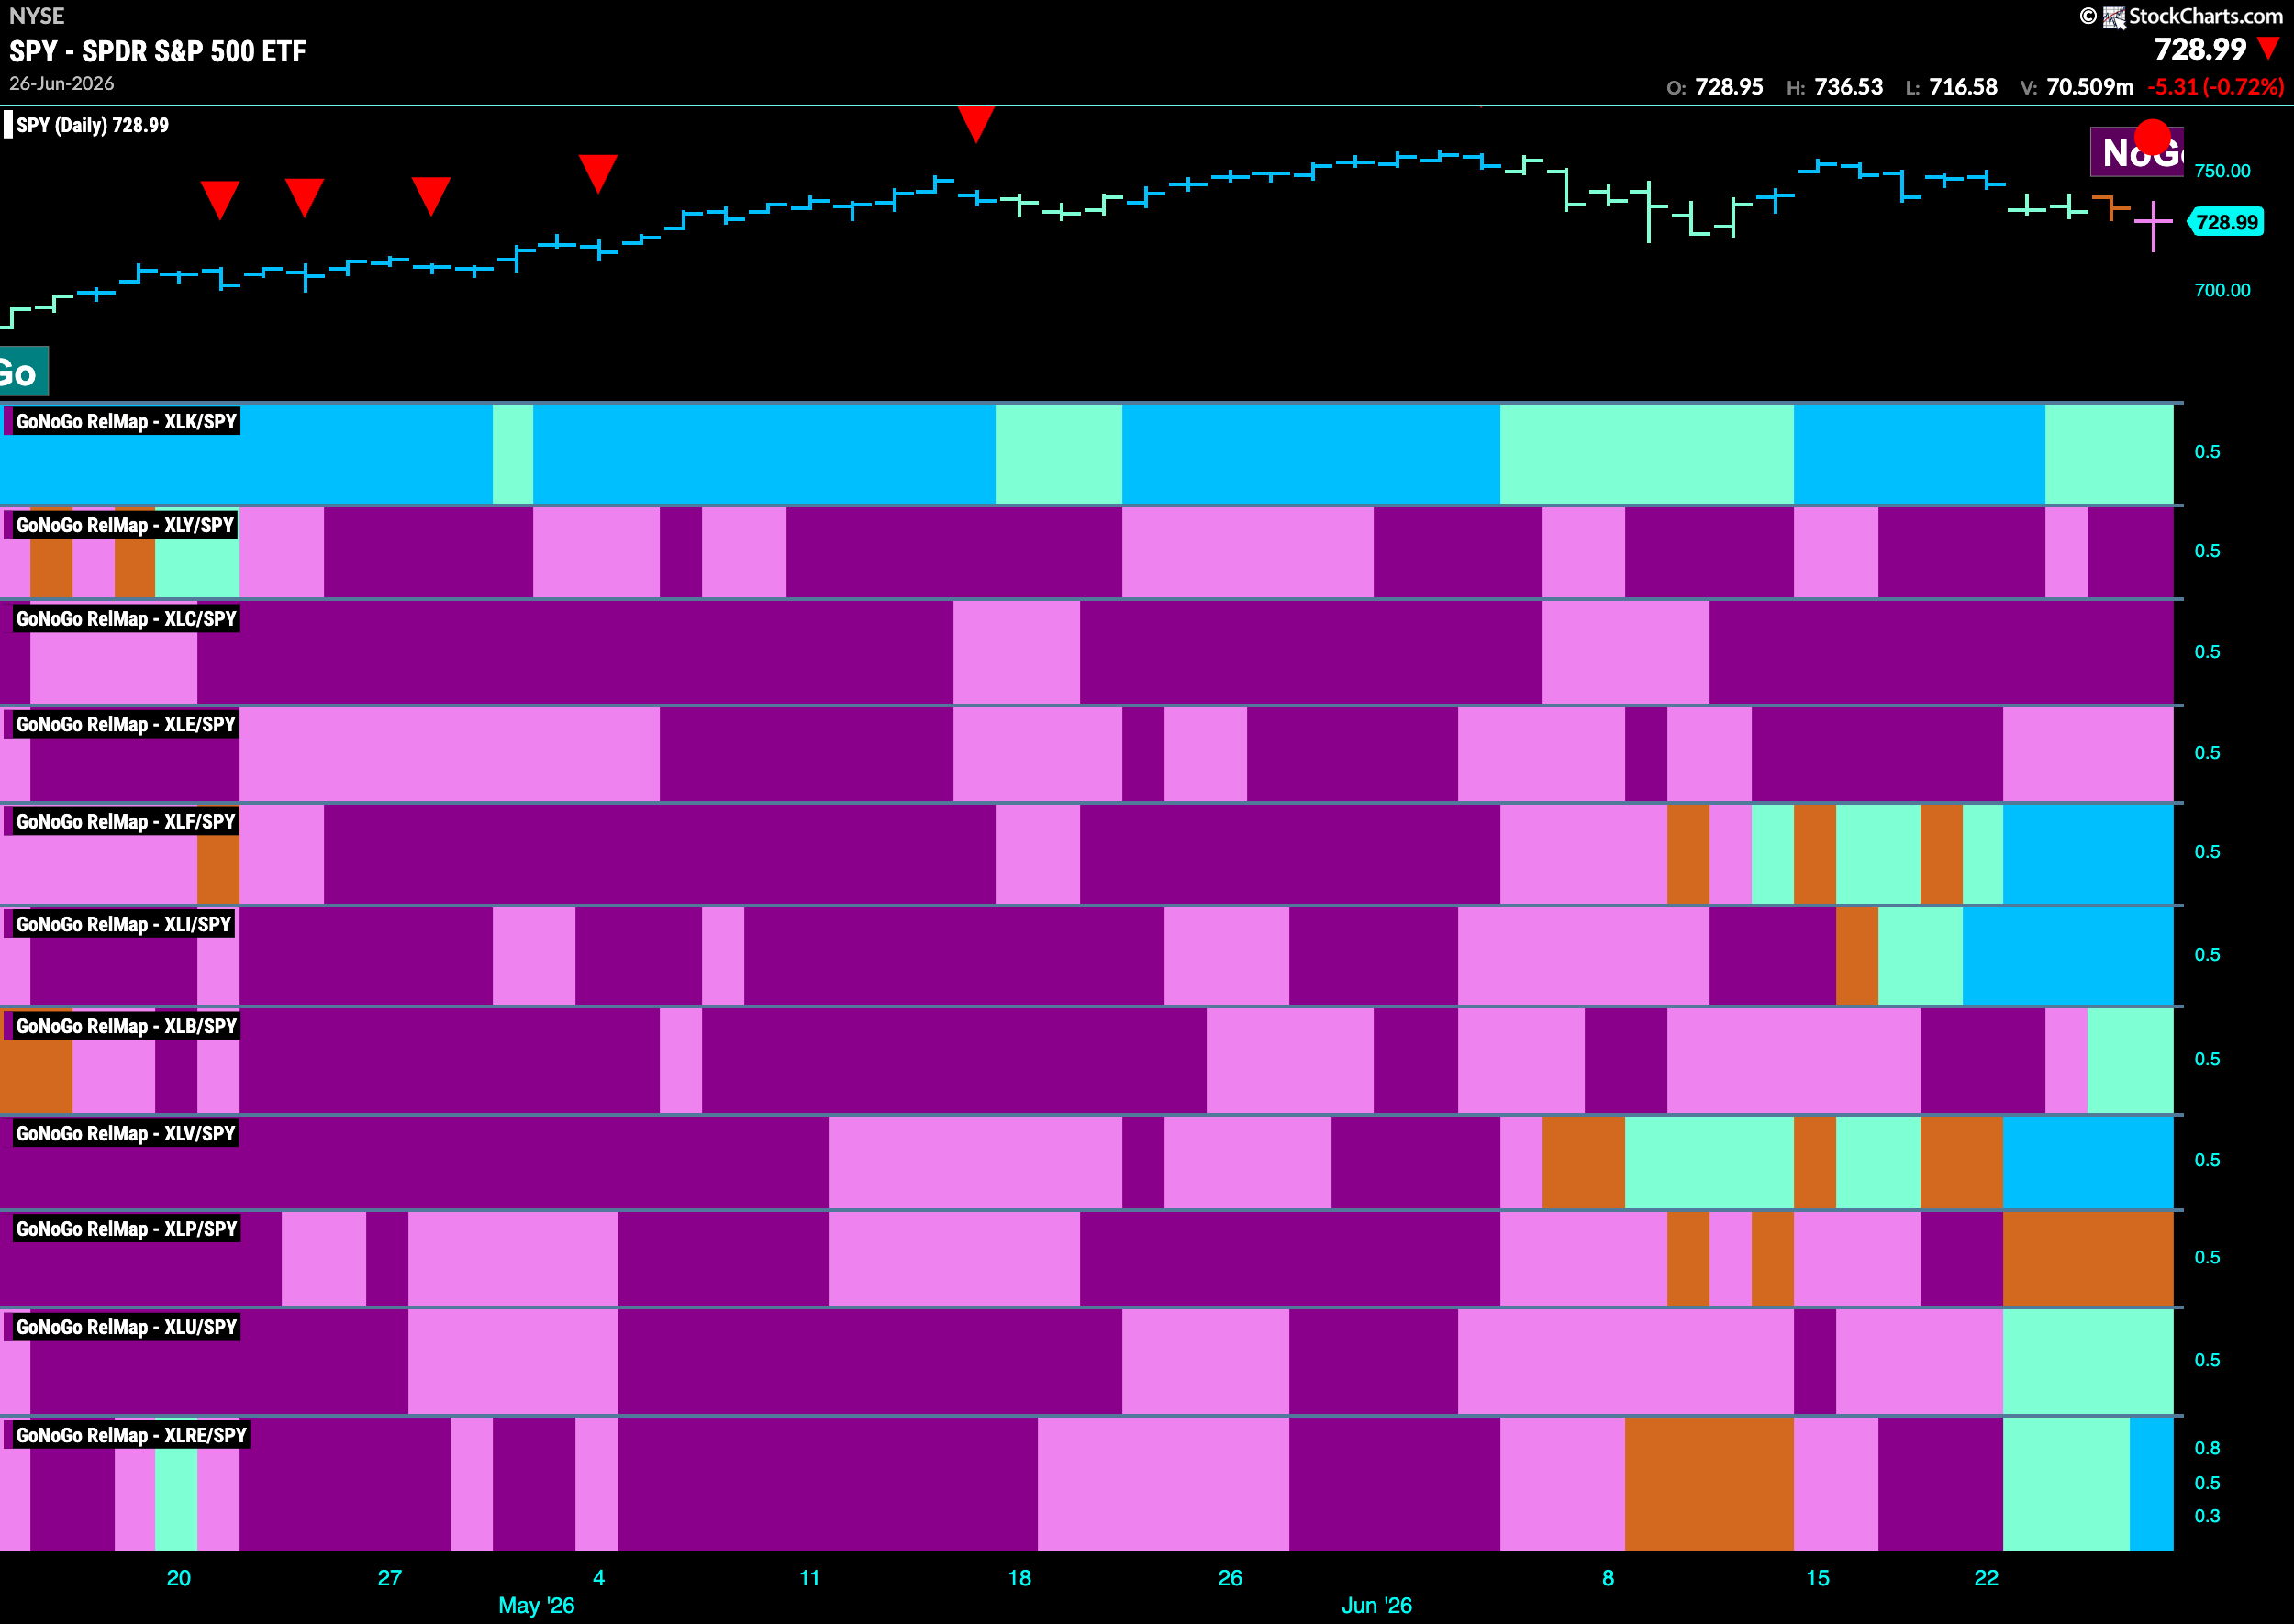
Below is the GoNoGo Sector RelMap. This GoNoGo RelMap applies the GoNoGo Trend to the relative strength ratios of the sectors to the base index. With this view we can get a sense of the relative out performance and relative underperformance of the sectors. 7 sectors are in a relative “Go” trend. $XLK, $XLF, $XLI, $XLB, $XLV, $XlU, and $XLRE are painting relative “Go” bars.
Materials Sub-Group RelMap
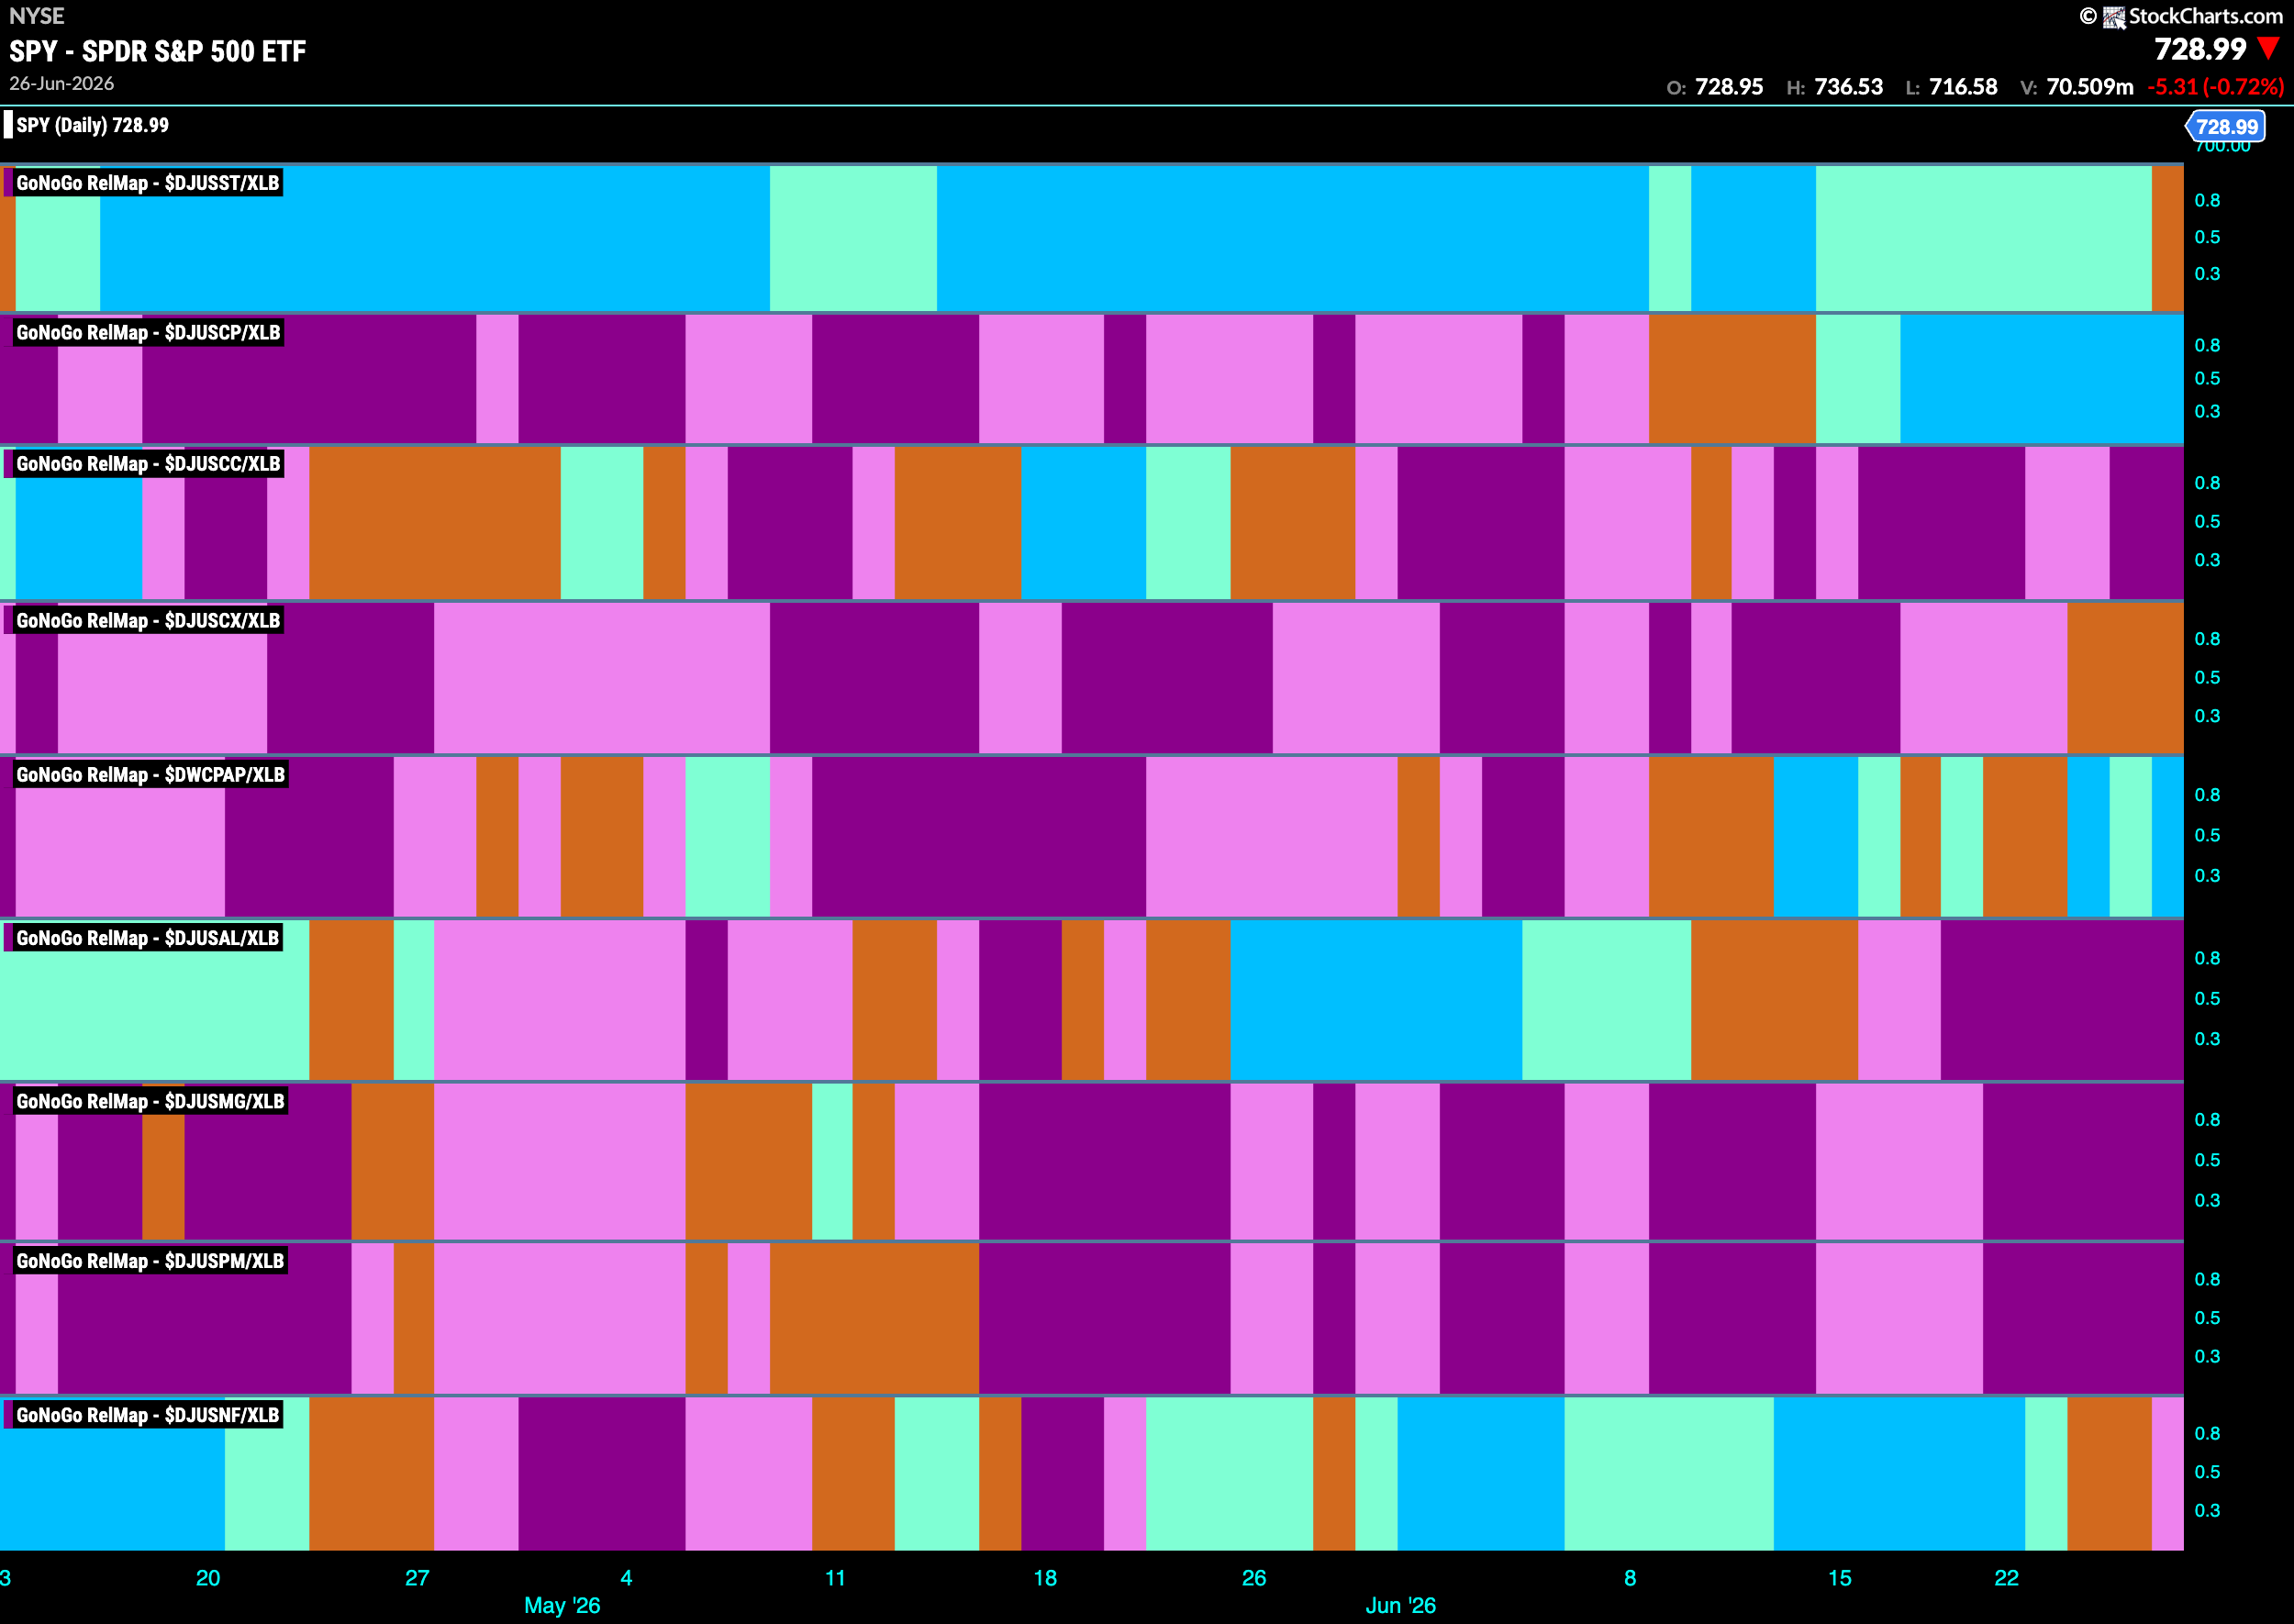
The chart below shows a relative trend breakdown of the sub groups within the materials sector this week. The Sub-Group RelMap plots the GoNoGo Trend of each sub index to the $XLB. We saw in the above GoNoGo Sector HeatMap that $XLB is painting new relative “Go” bars. When we look at the below RelMap we can see that the containers and packaging index in the 2nd panel is painting strong blue “Go” bars on a relative basis.
$GEF/B Paints Strong Blue “Go” Bars at Highs
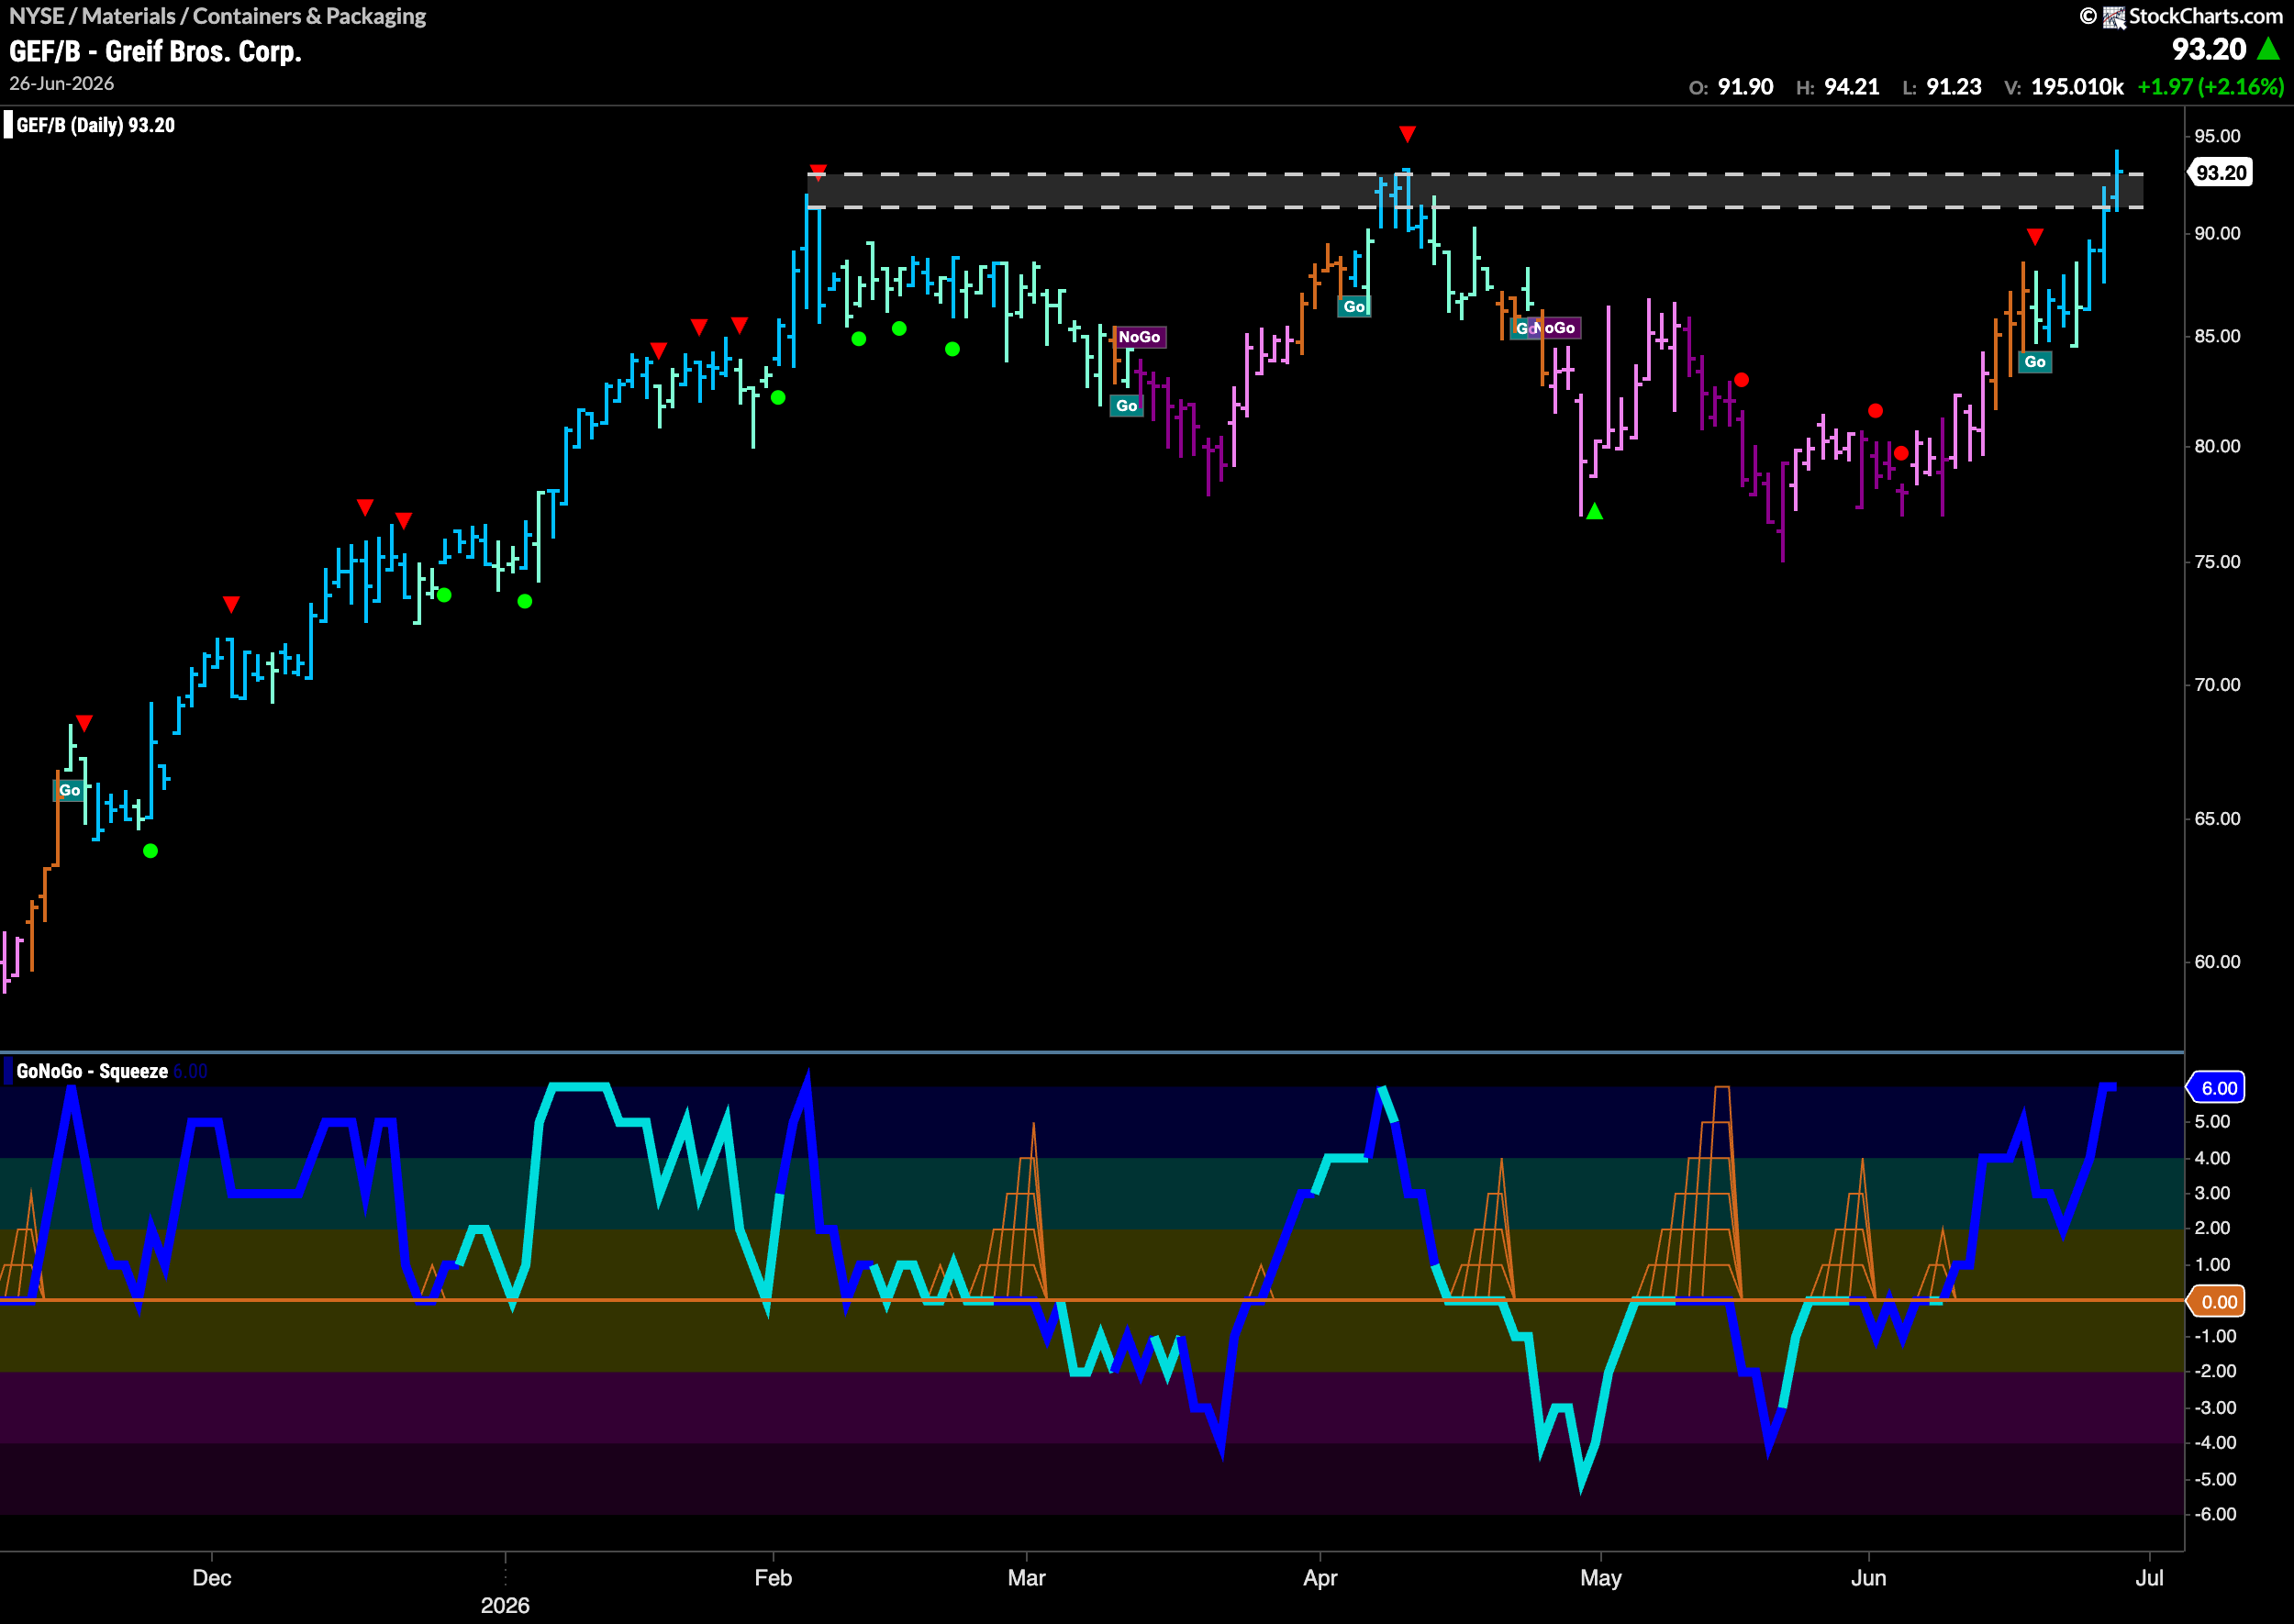
The GoNoGo Chart below shows that the “Go” trend has returned and GoNoGo Trend paints strong blue bars as price challenges the overhead resistance we see on the chart. Having failed at this level before, it will be interesting to watch price action in the coming days and weeks. GoNoGo Oscillator is at an extreme of 6, showing strong market participation and heavy volume. We will watch to see if price can consolidate at these levels and perhaps break higher.
$OI Enters New “Go” Trend
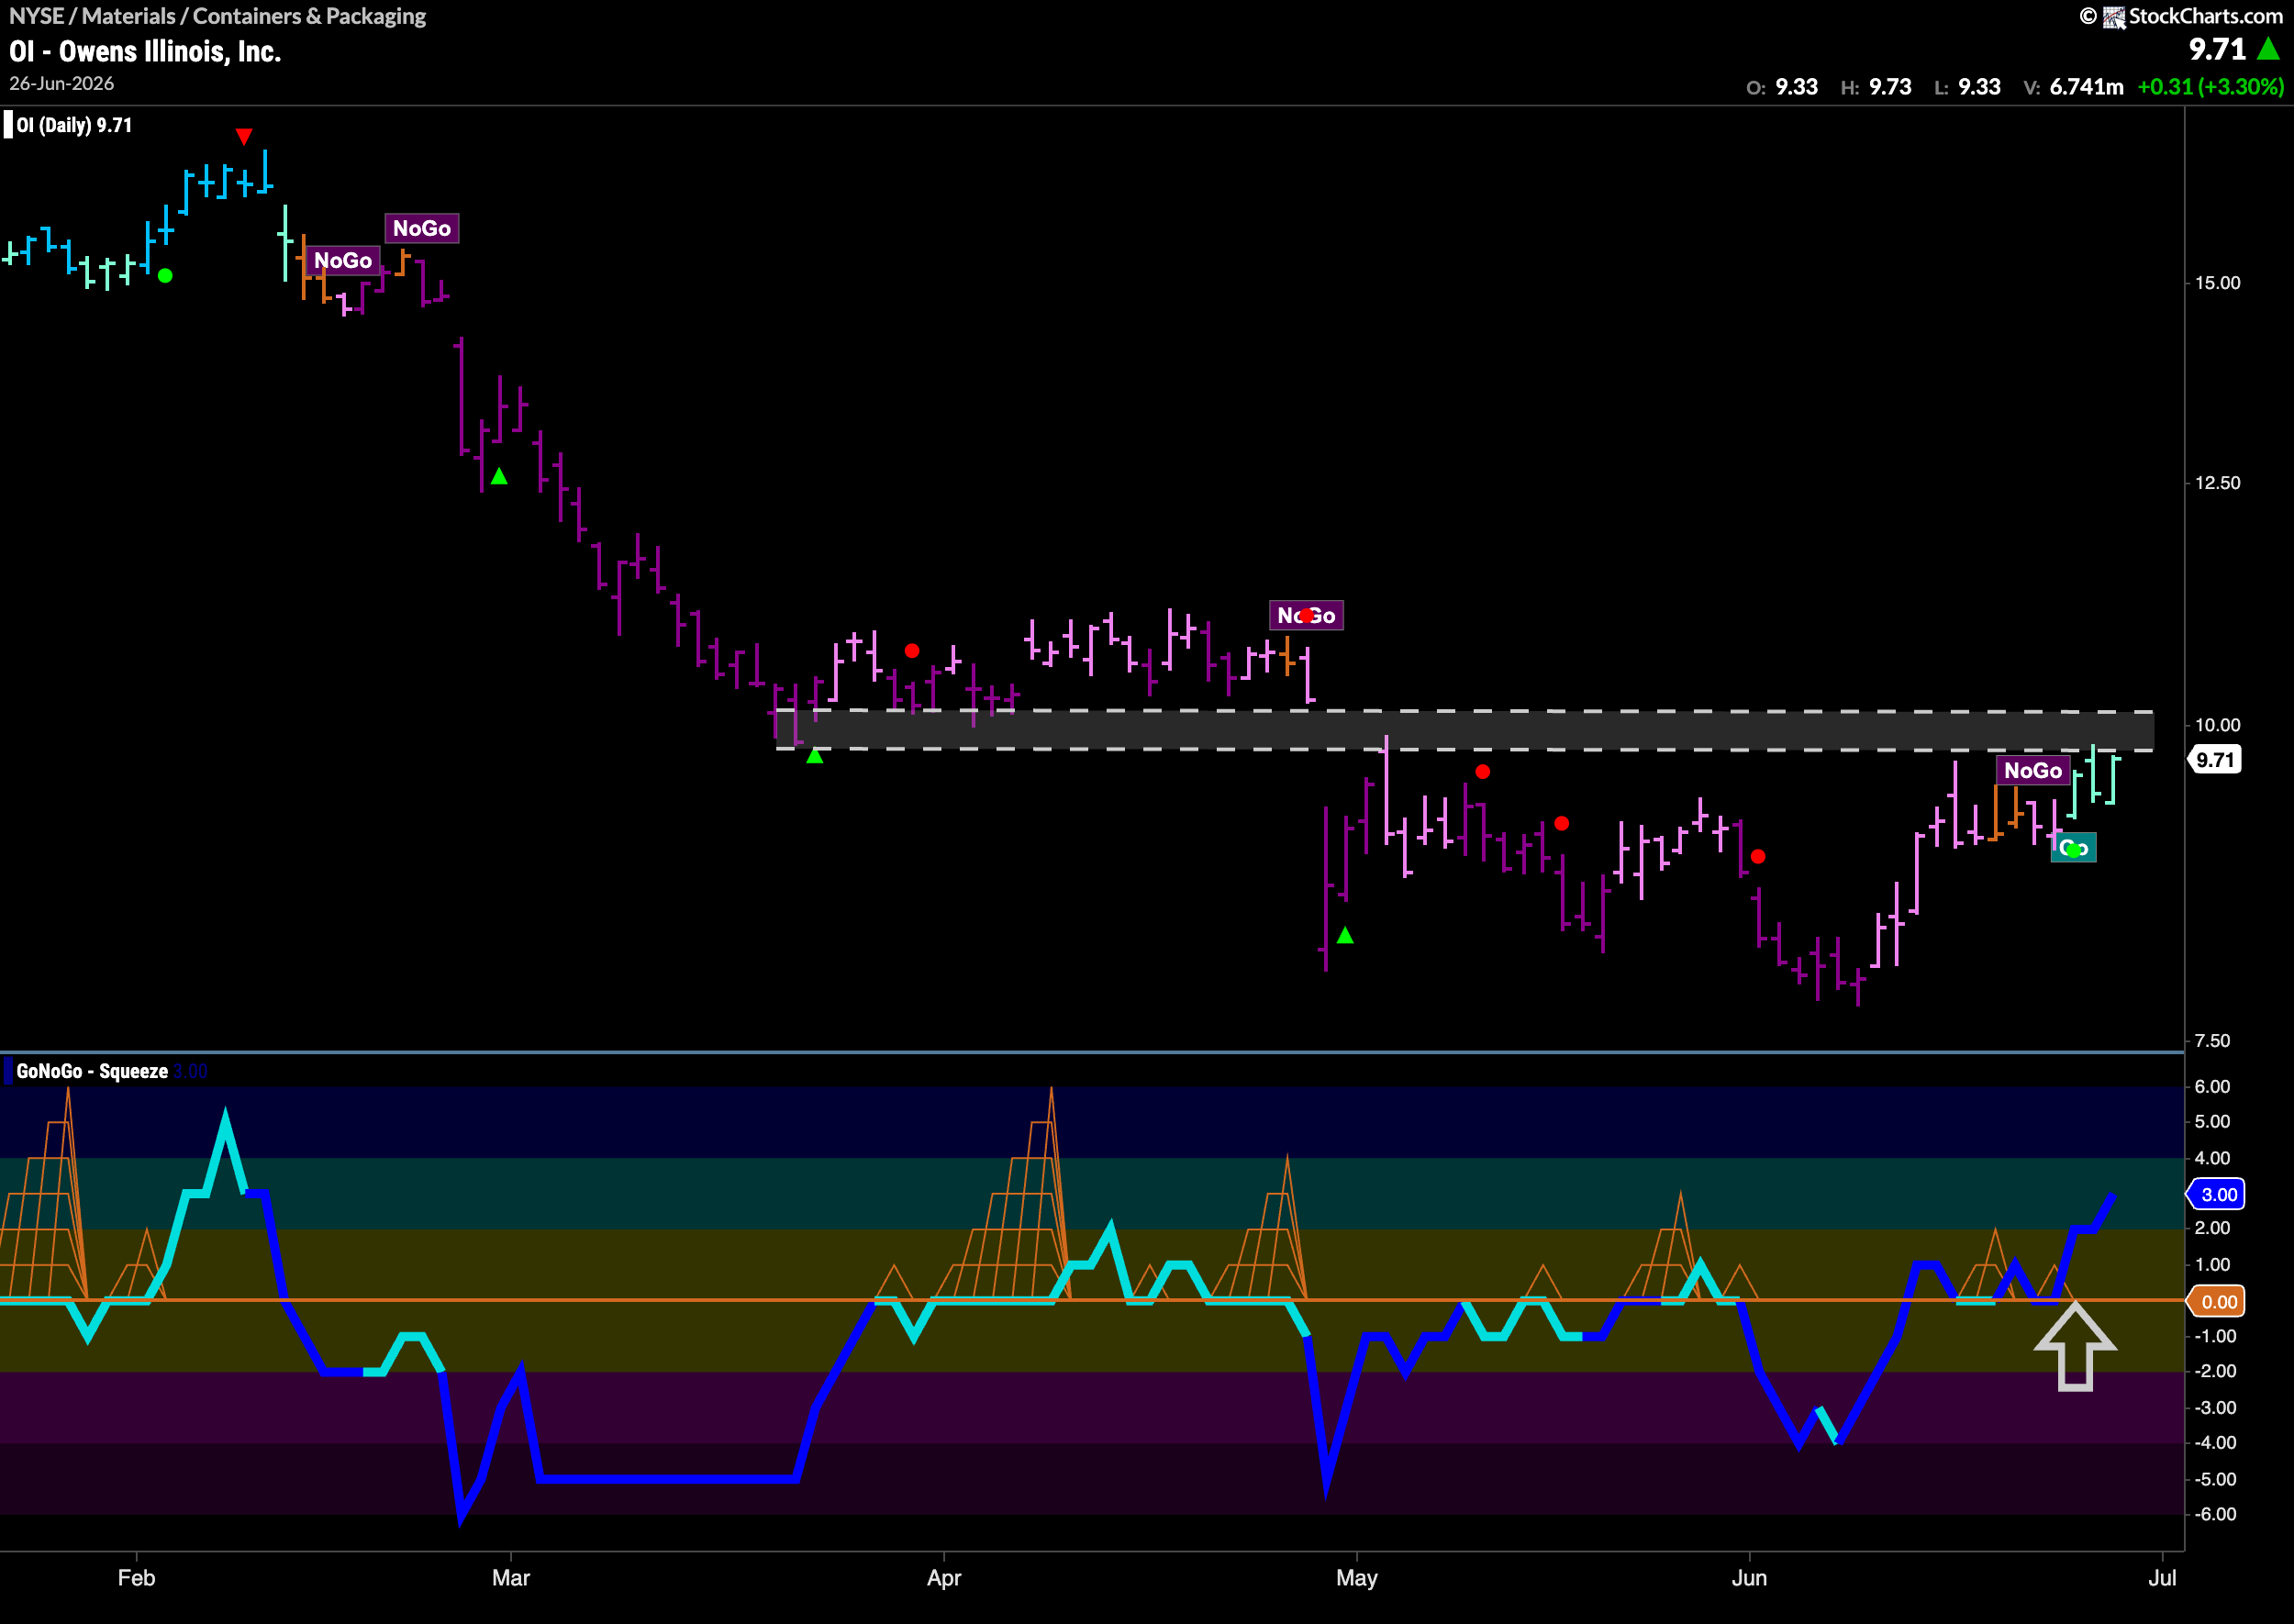
$OI has been in a “NoGo” trend for several months as we saw lower lows and lower highs bring price well under $10. Now, we have seen price climb off the recent low and GoNoGo Trend has identified a trend change. First amber “Go Fish” bars reflected market uncertainty and now we see the indicator painting consecutive aqua bars. This trend change has pushed price up against resistance that comes from previous highs and lows. With GoNoGo Oscillator finding support at zero and now rallying into positive territory on heavy volume at a value of 3, we will watch to see if this gives price the push it needs to break above resistance.