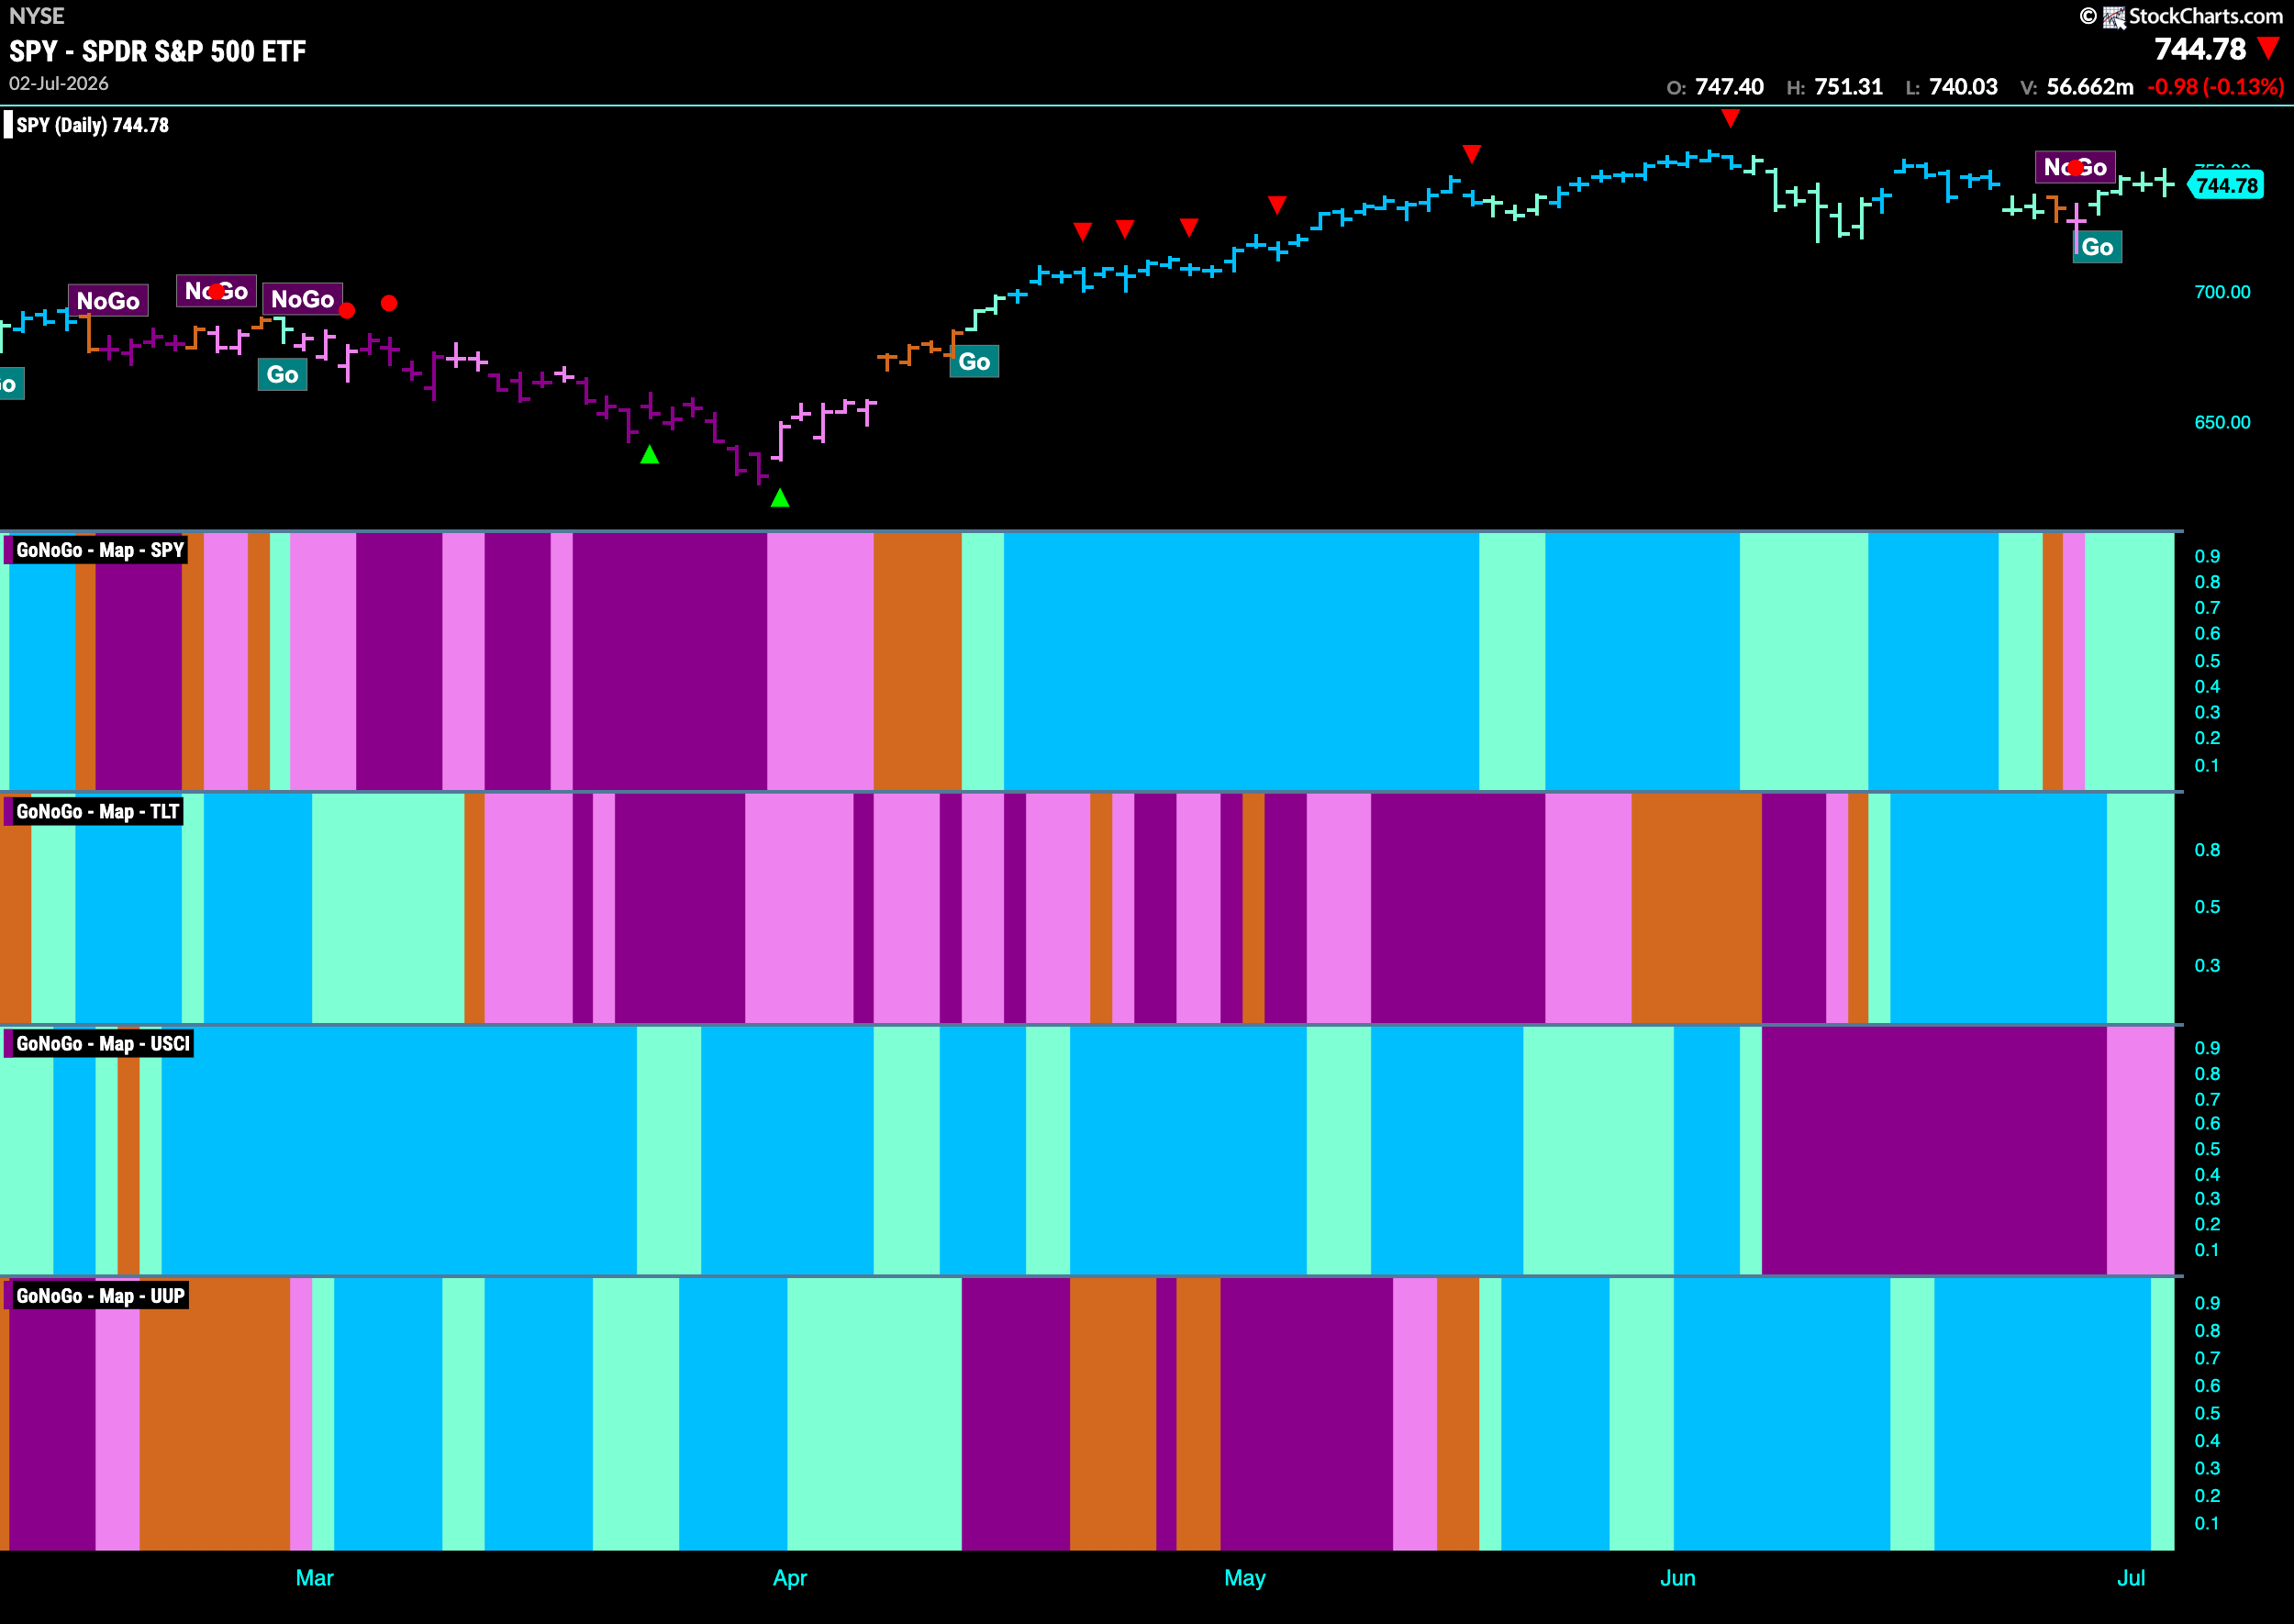
Good morning and welcome to this week’s Flight Path. The equity trend saw the “Go” trend return this week with pale aqua bars after a single pink “NoGo” bar. Treasury bond prices remained in a “Go” trend but we did see weaker aqua bars for most of the week.U.S. commodities remained in a “NoGo” trend but the indicator showed weakness with pink bars. The dollar saw a single weaker aqua bar after a run of strong blue “Go” bars.
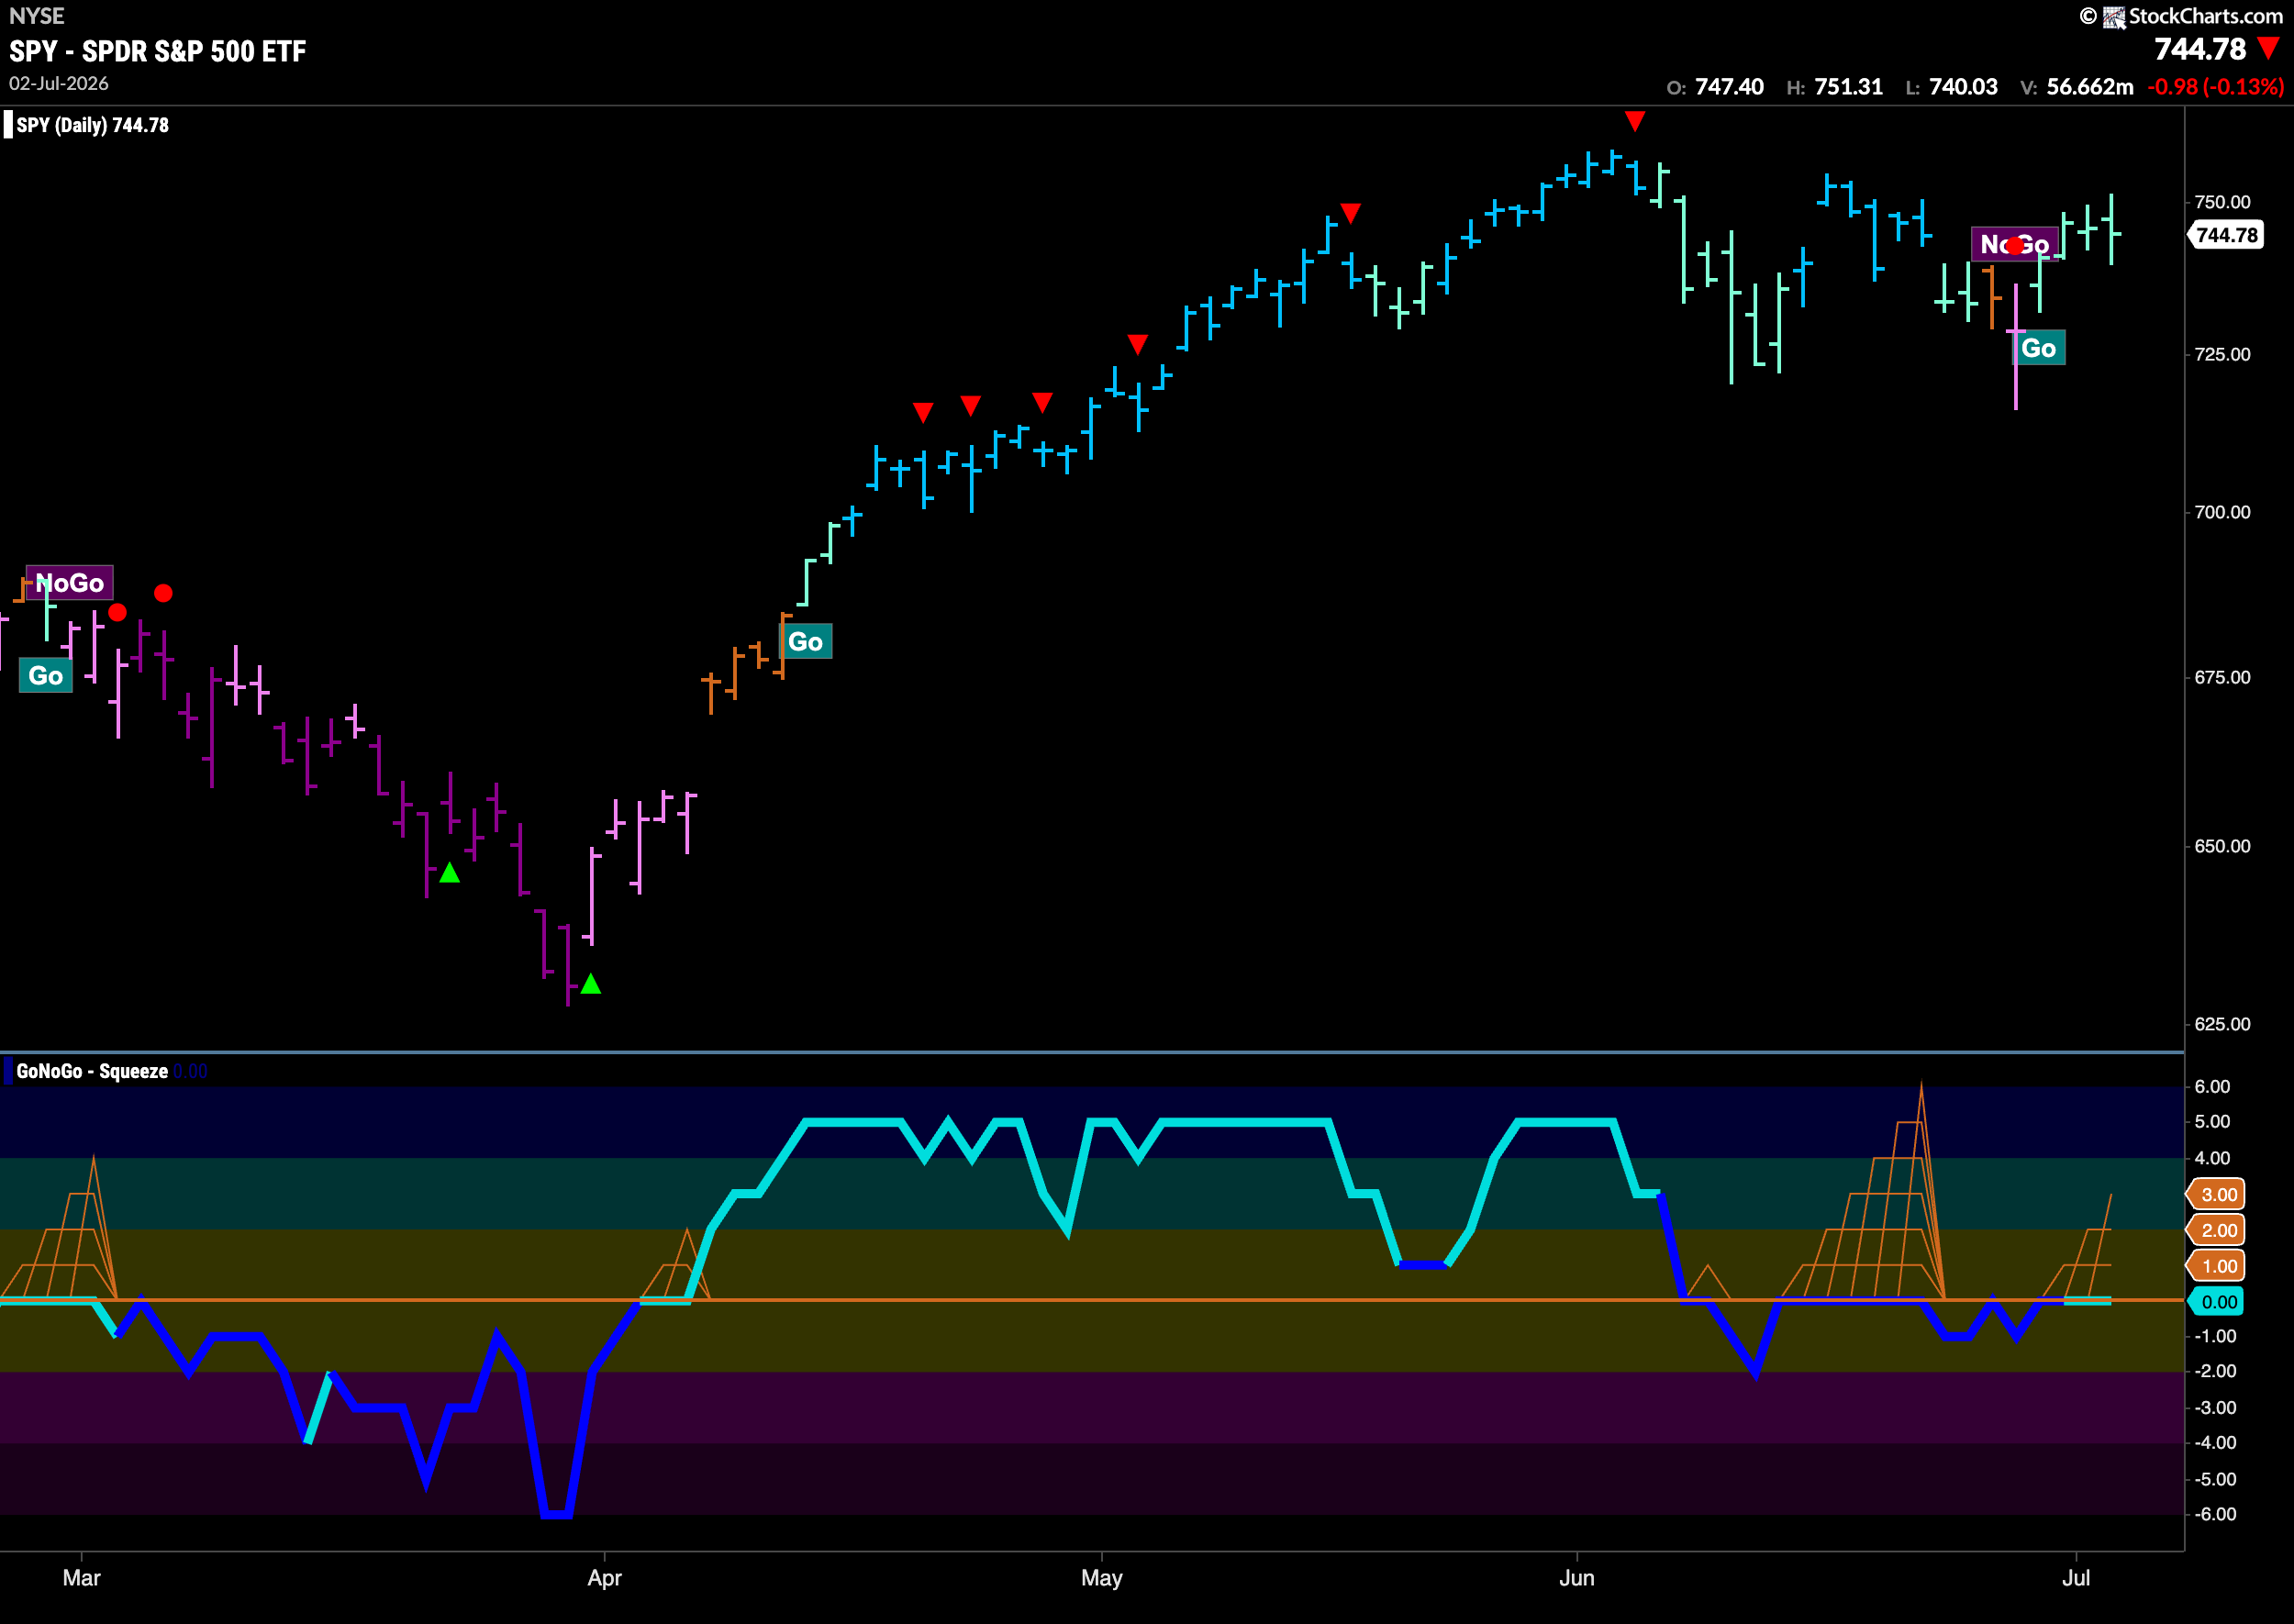
$SPY Finds Support at Prior Low
The GoNoGo chart below shows that price found support at a prior low and is now once again painting “Go” bars as the indicator shows aqua. GoNoGo Oscillator is riding the zero line again and we know that it will be important to note the direction of the next move off that level. If the oscillator can regain positive territory that would give support to further price gains.
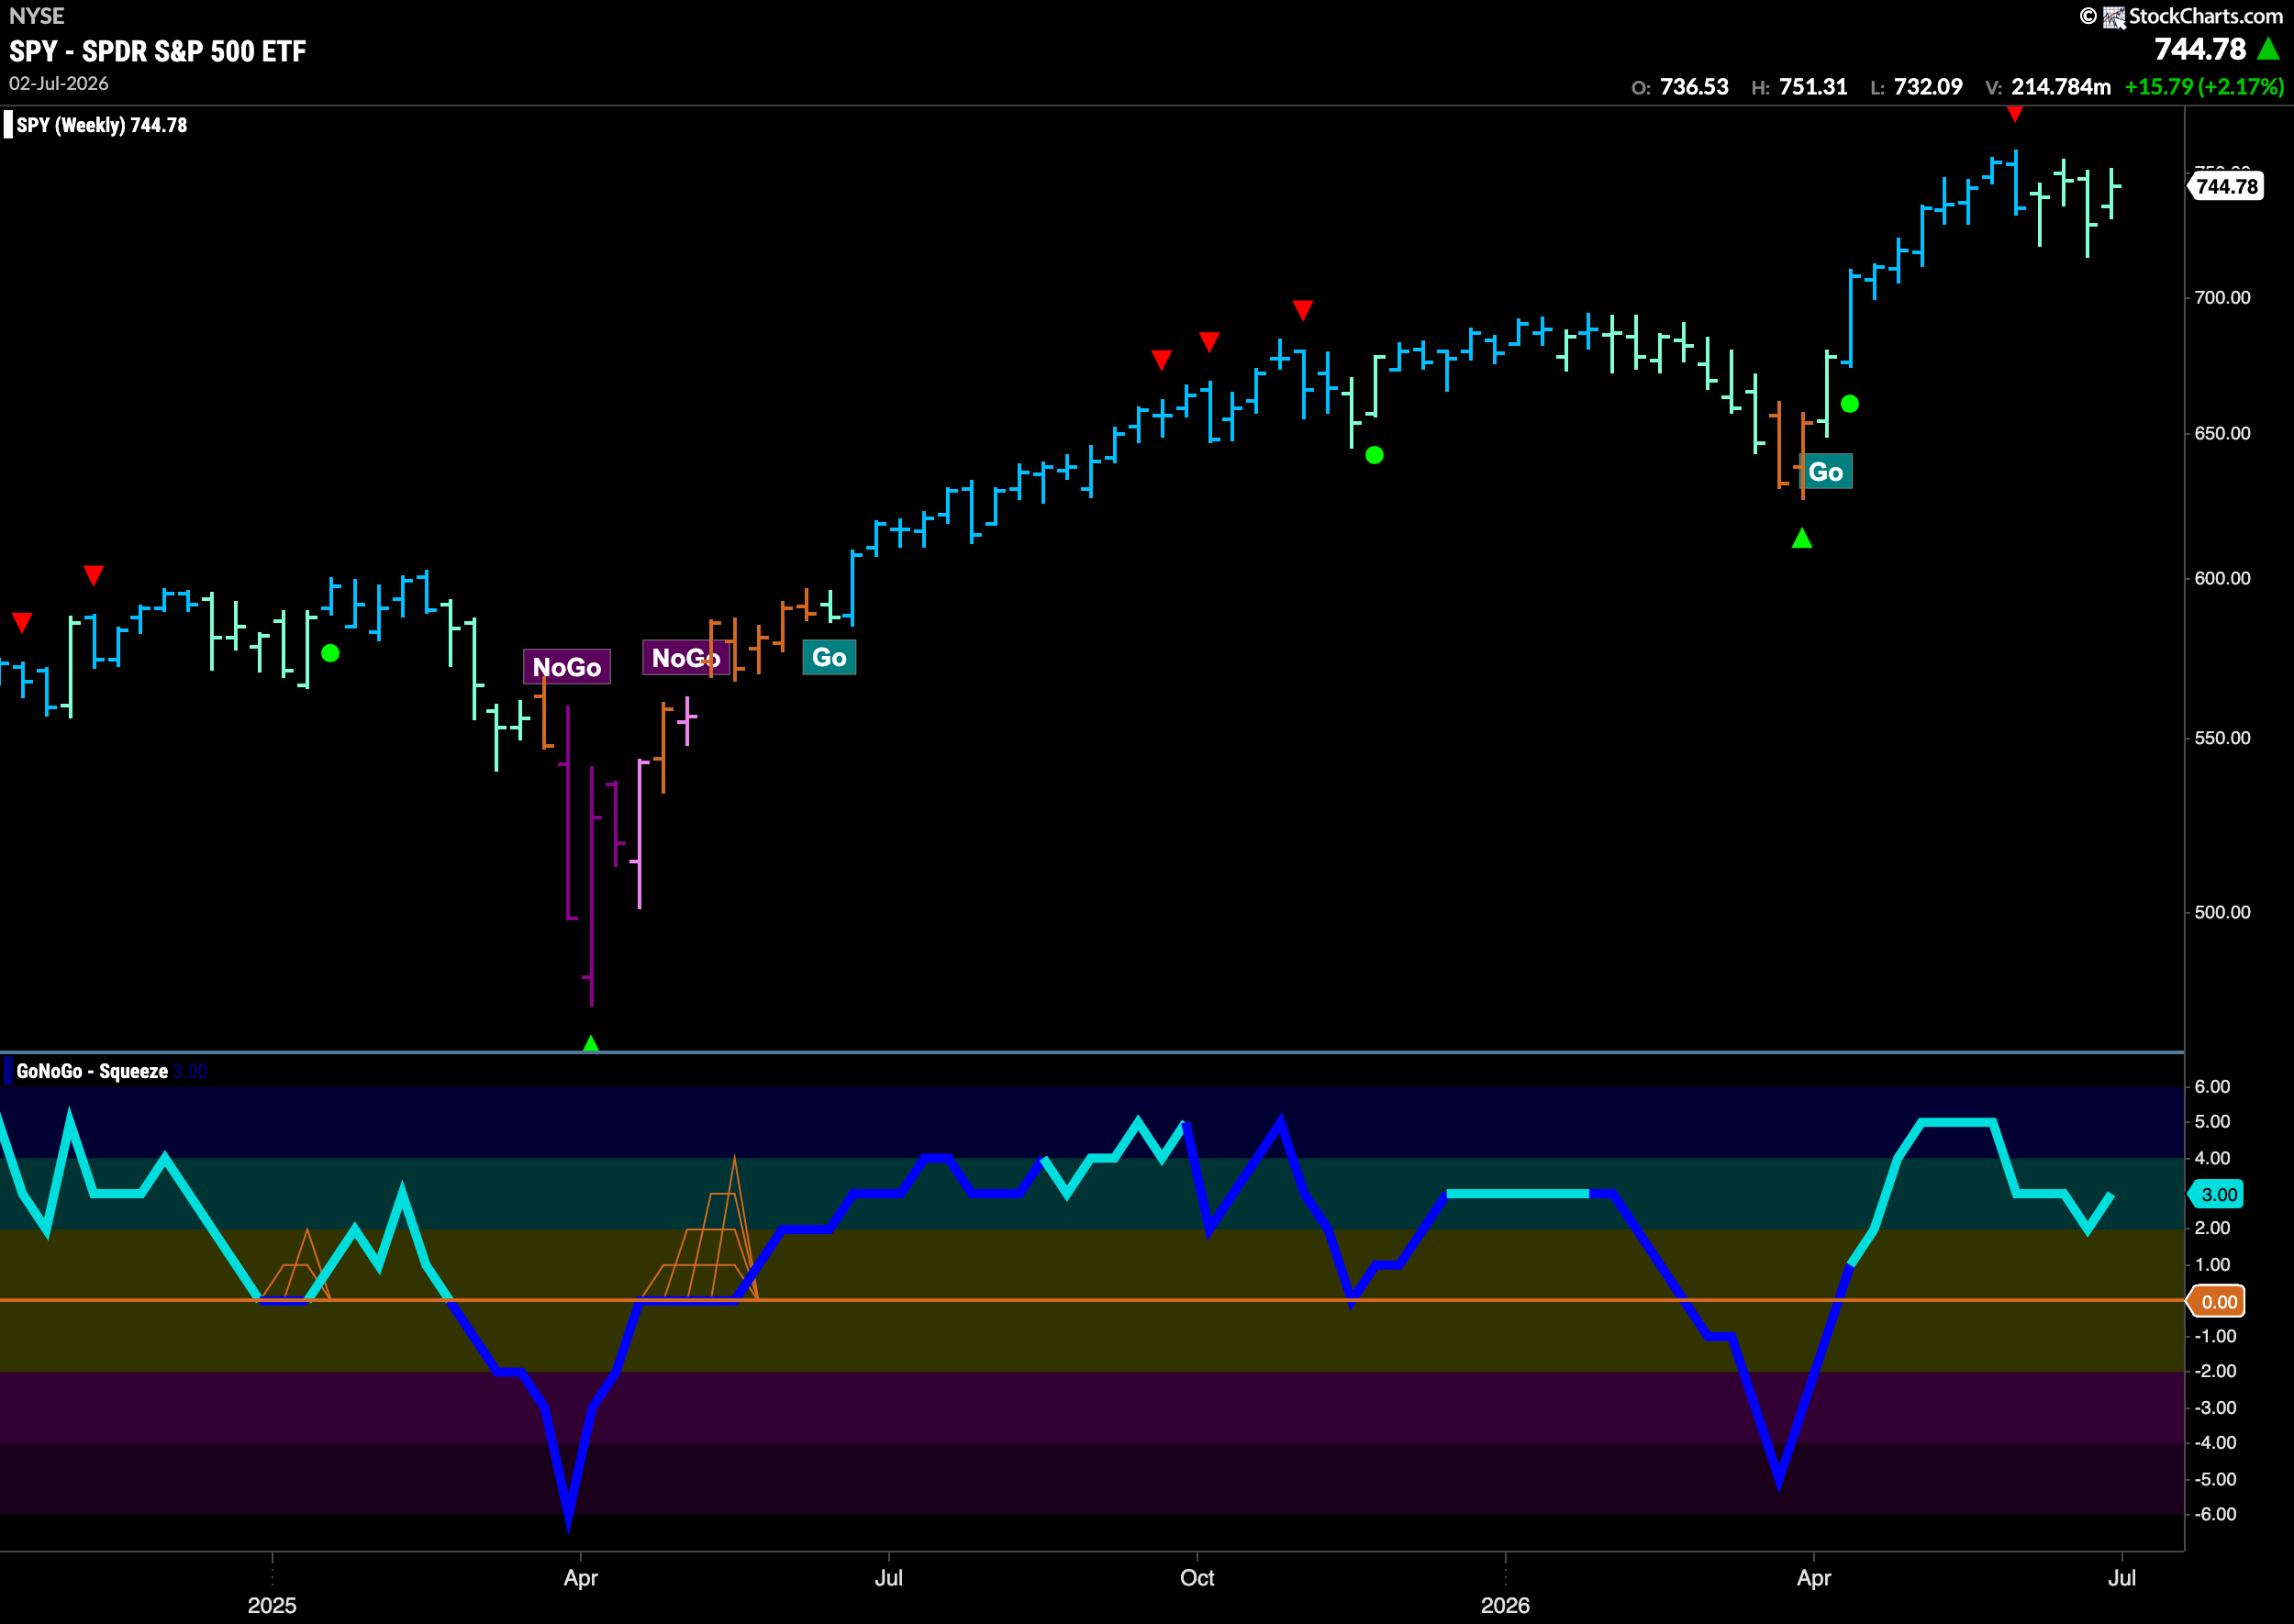
The weekly chart shows that the GoNoGo Trend indicator paints another weaker aqua “Go” bar this week as the trend remains intact. We see that GoNoGo Oscillator remains in positive territory and has reversed higher before reaching zero. With momentum at a value of 3, we know that it is confirming the “Go” trend for now.
Treasury Rates Show Uncertainty
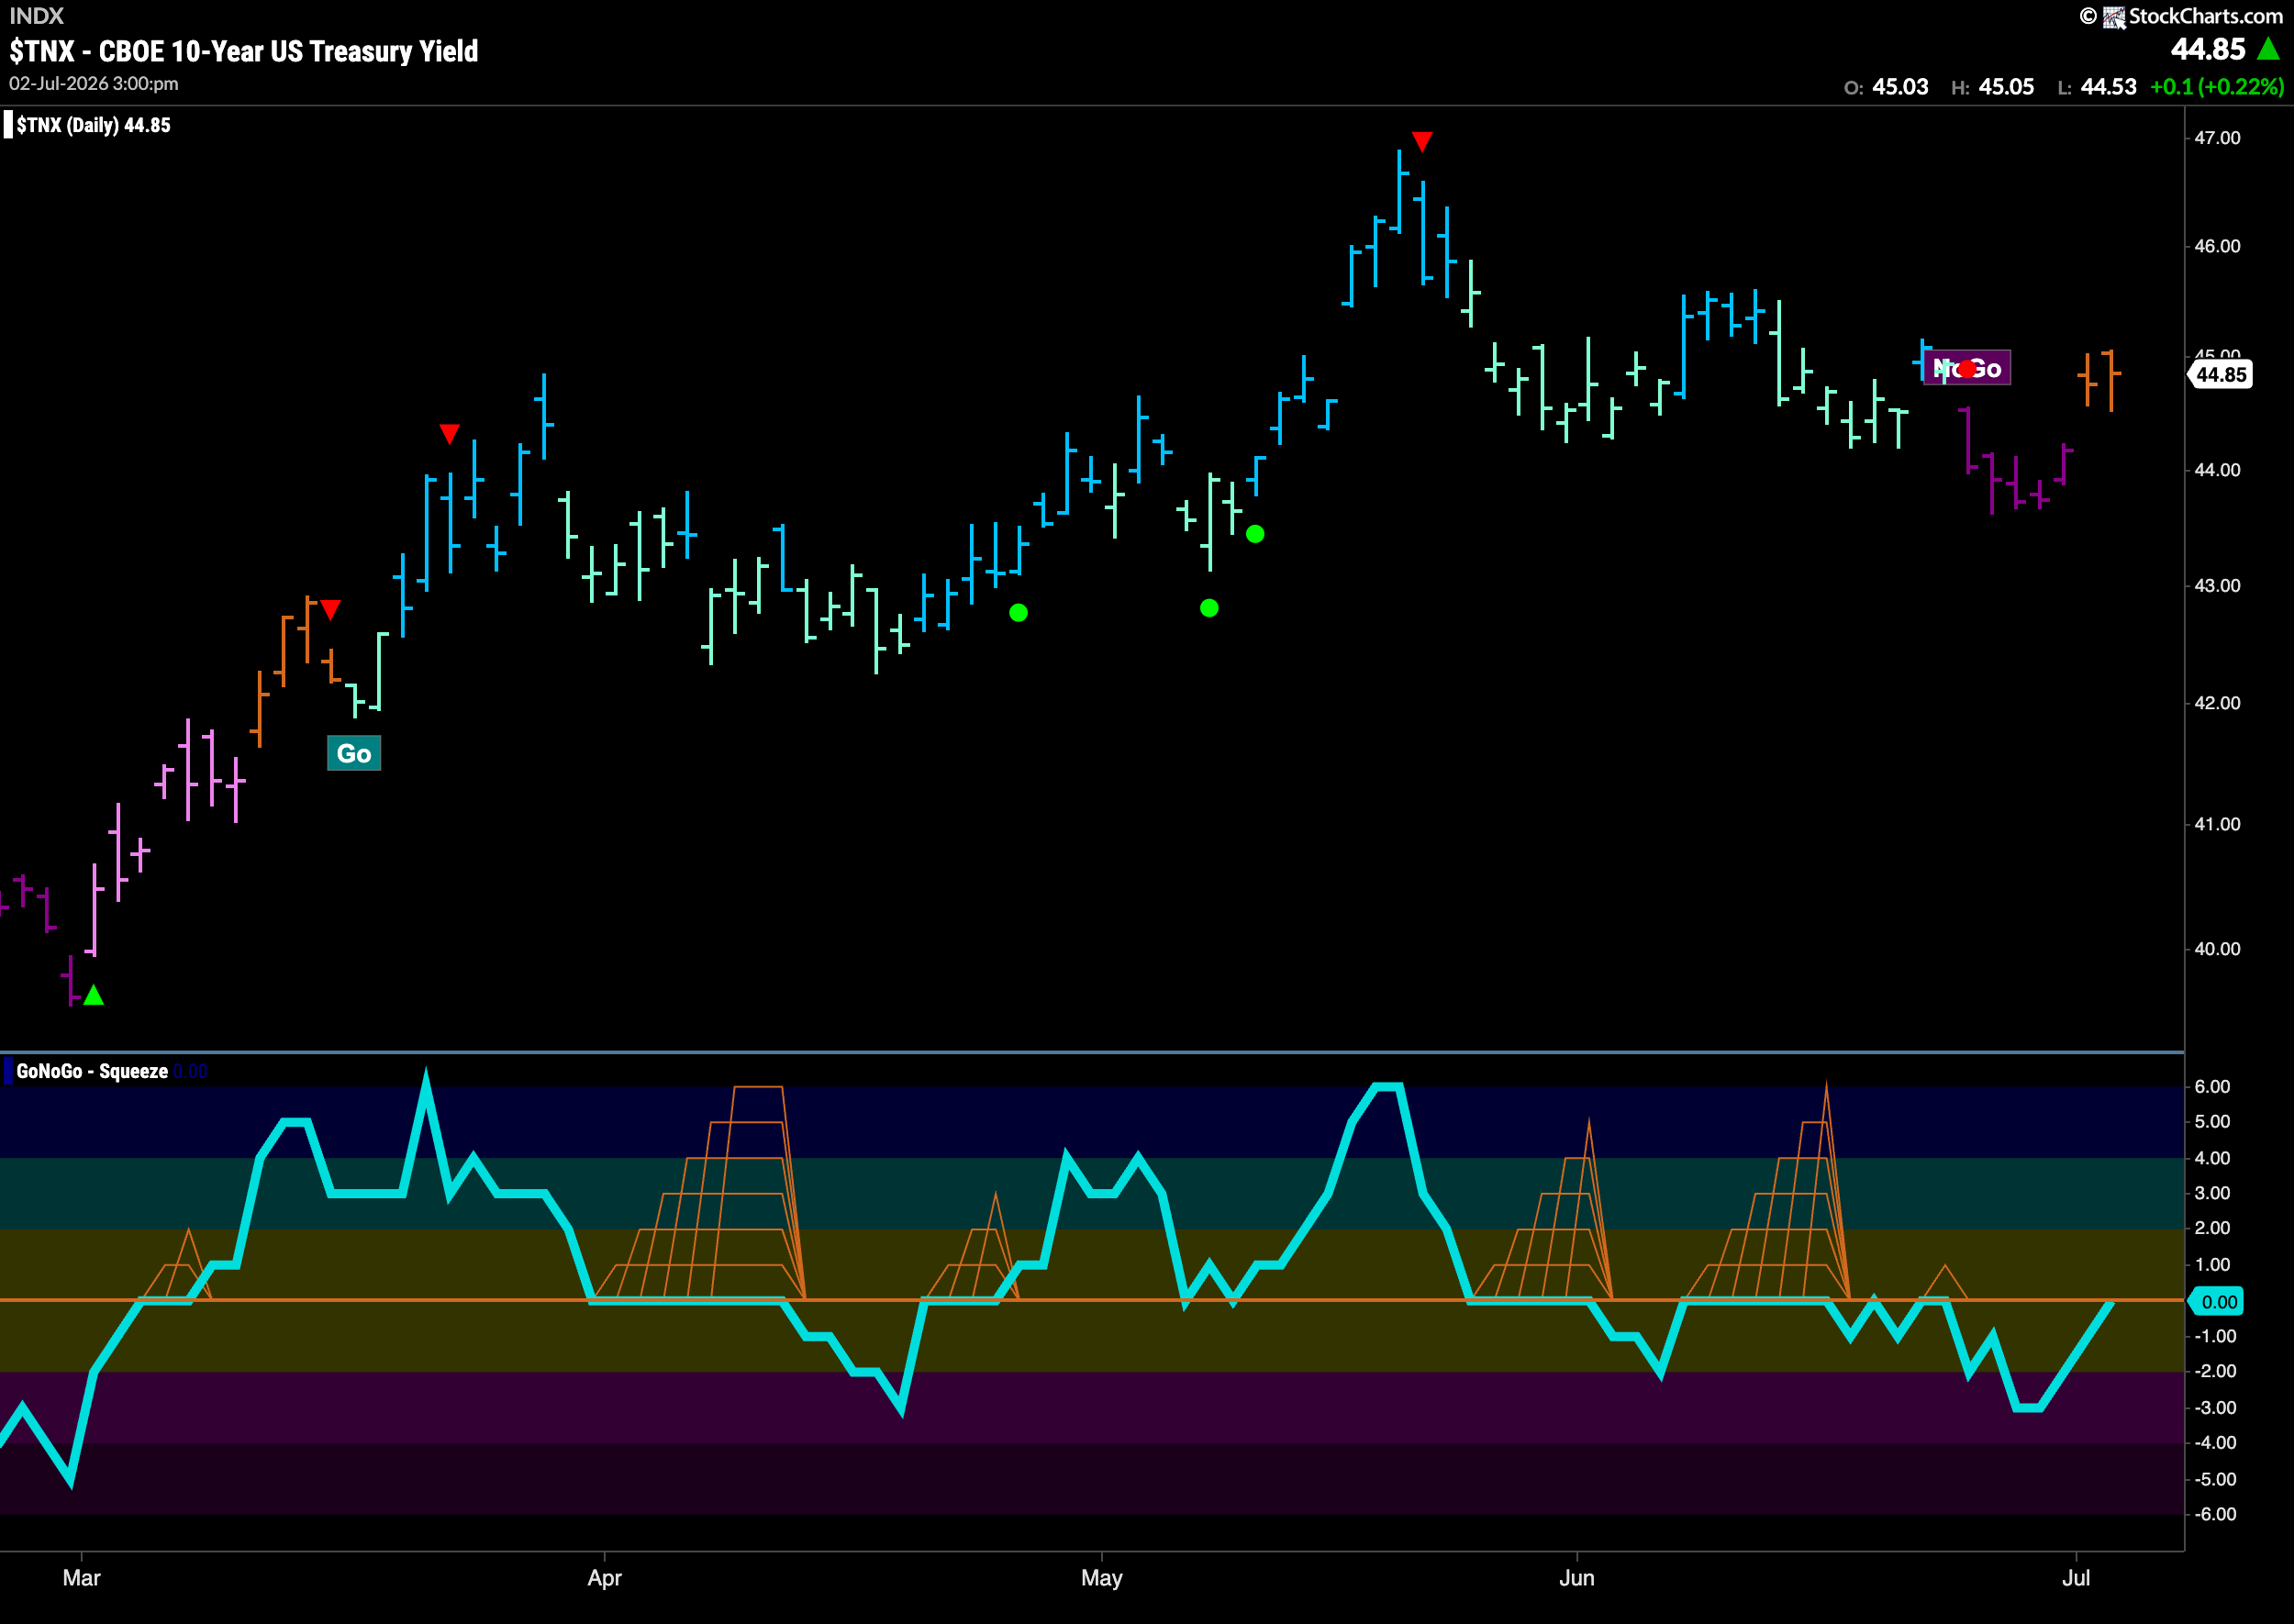
GoNoGo Trend shows that the trend for rates is an amber “Go Fish”. This reflects market uncertainty. Not enough criteria is being met from a “Go” or “NoGo” perspective to allow GoNoGo Trend to paint a trend. GoNoGo Oscillator is testing the zero line from below and so it will be important to note if it is rejected by that level. If it is, the “NoGo” is likely to return for rates.
Dollar ($UUP) Paints Weakness
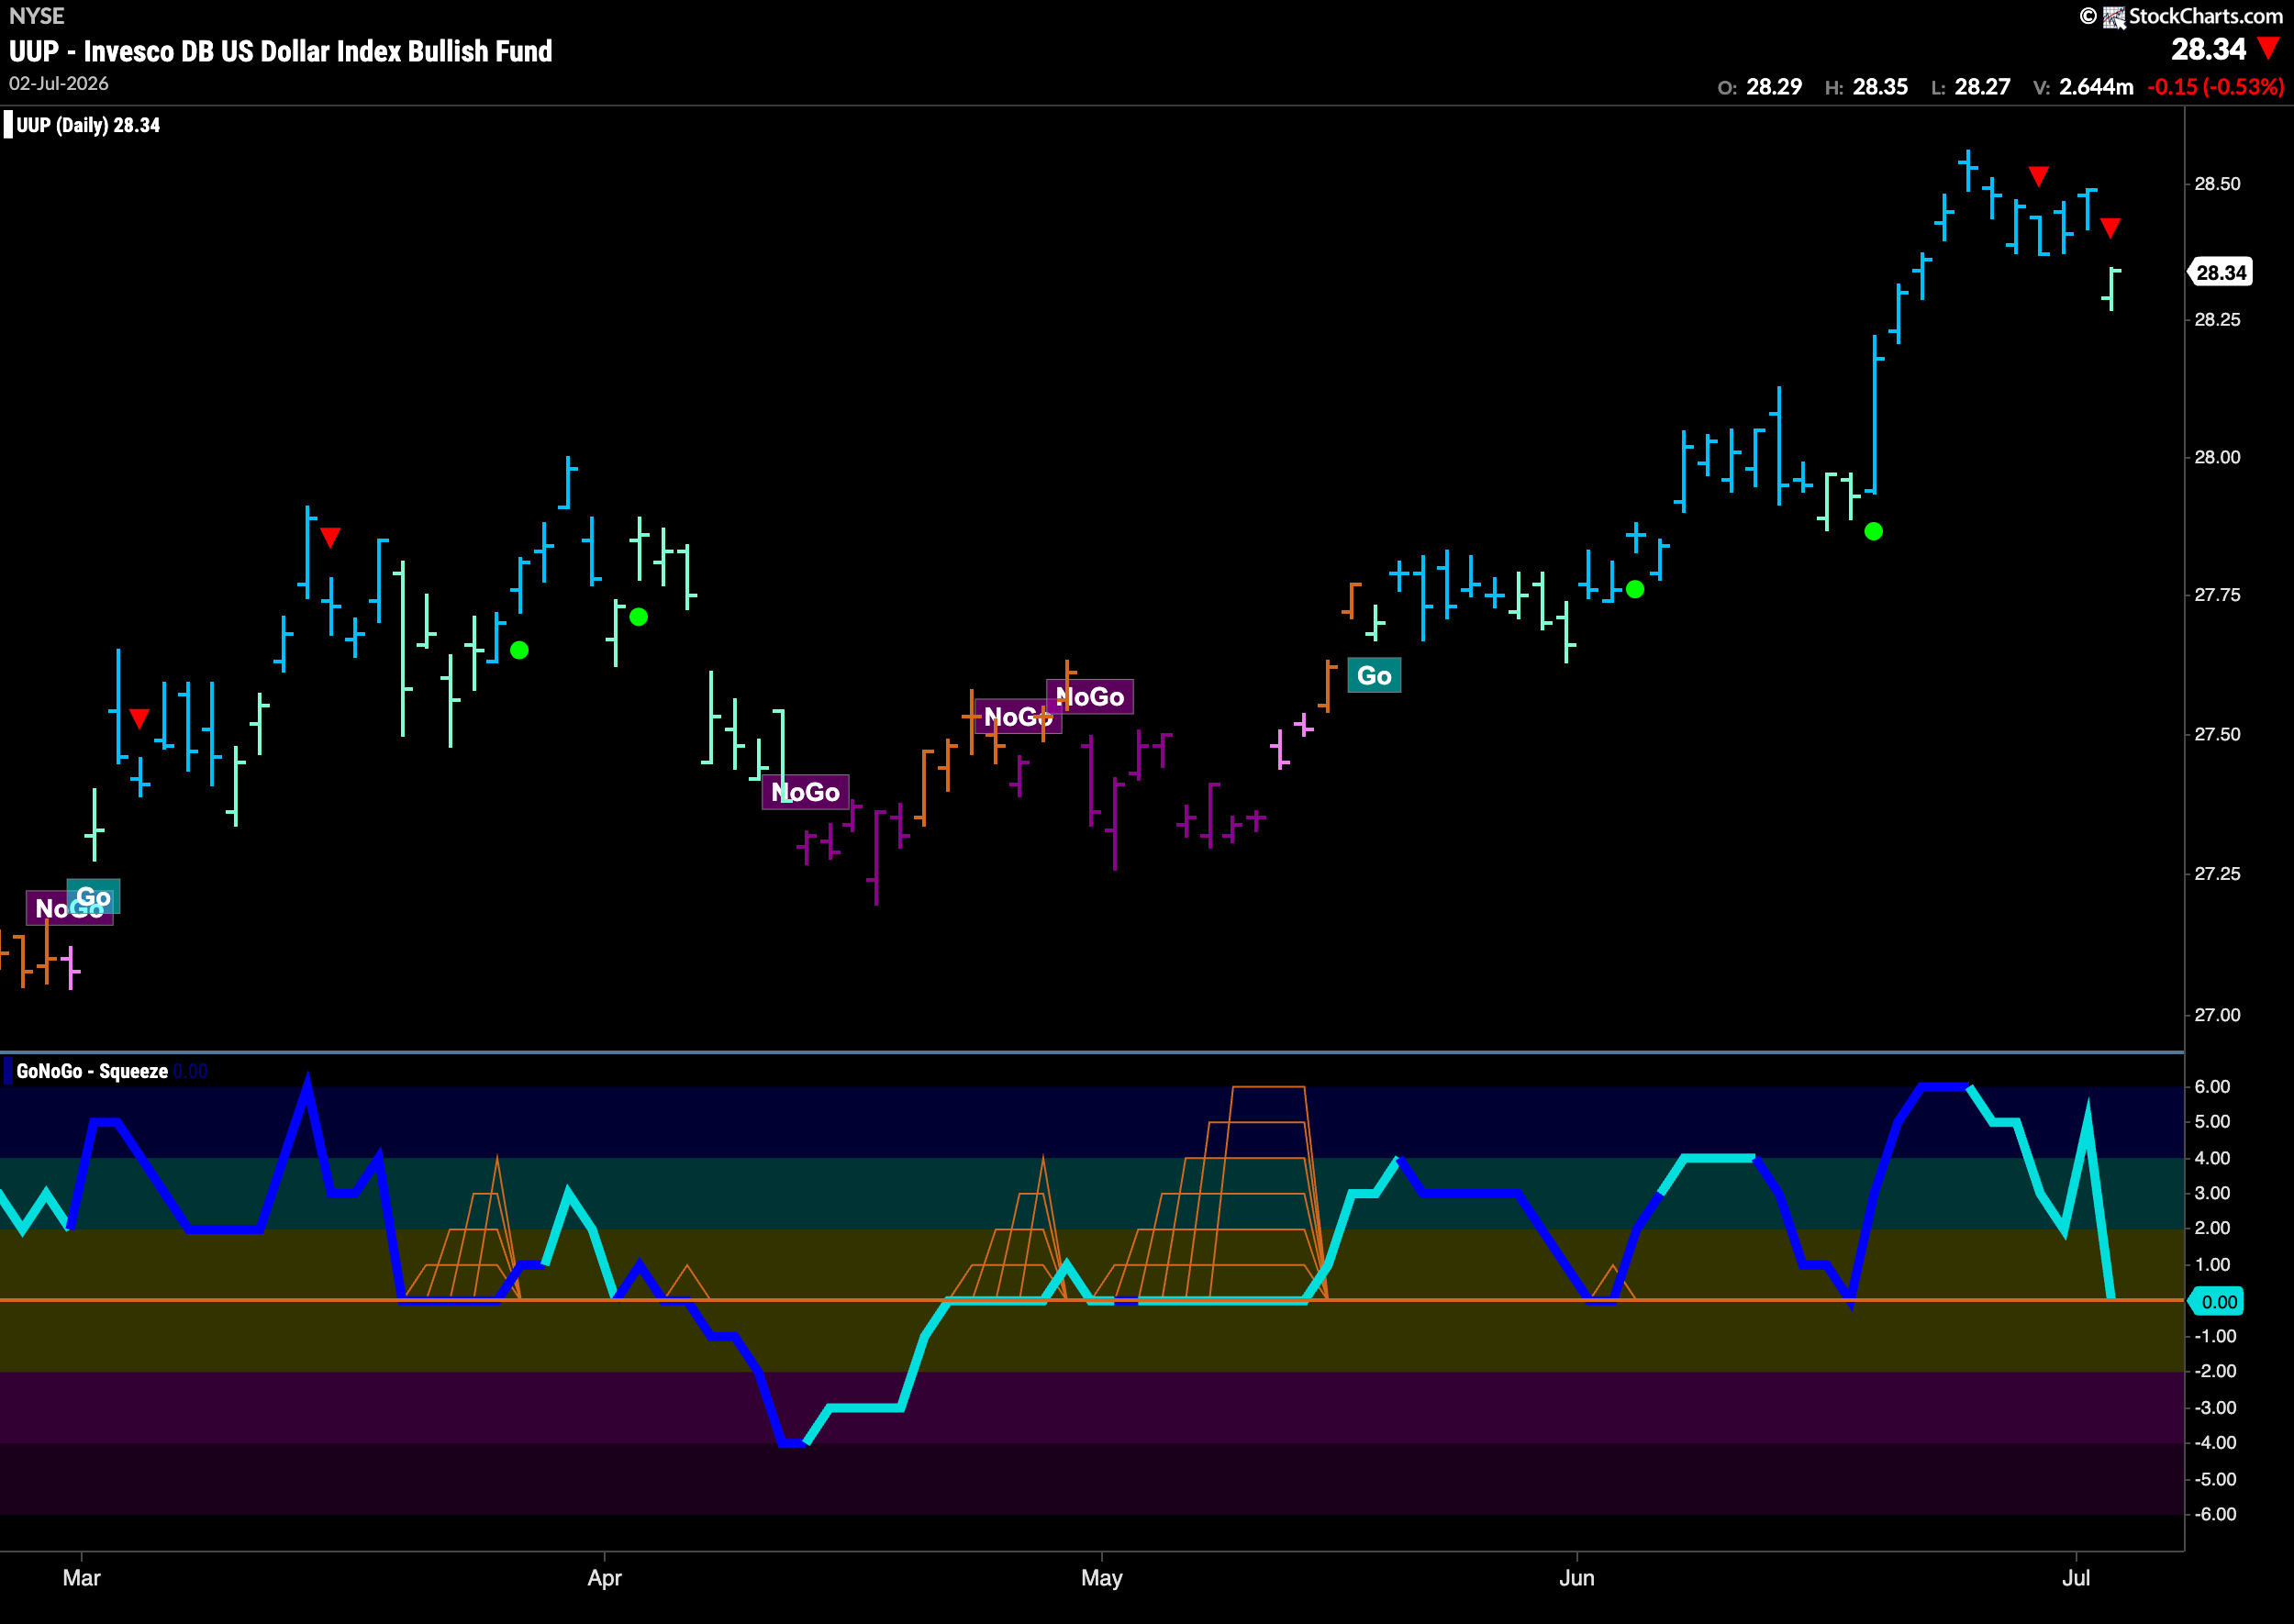
The chart below shows that the “Go” trend is showing weakness for the first time in a while. This comes after a new high and a couple of Go Countertrend Correction Icons (red arrows). This tells us that price will likely struggle to go higher in the short term due to waning momentum. The oscillator has crashed to test the zero line from above and so it will be important to note if it finds support at this level.
Oil ($USO) Continues to Fall in “NoGo” Trend
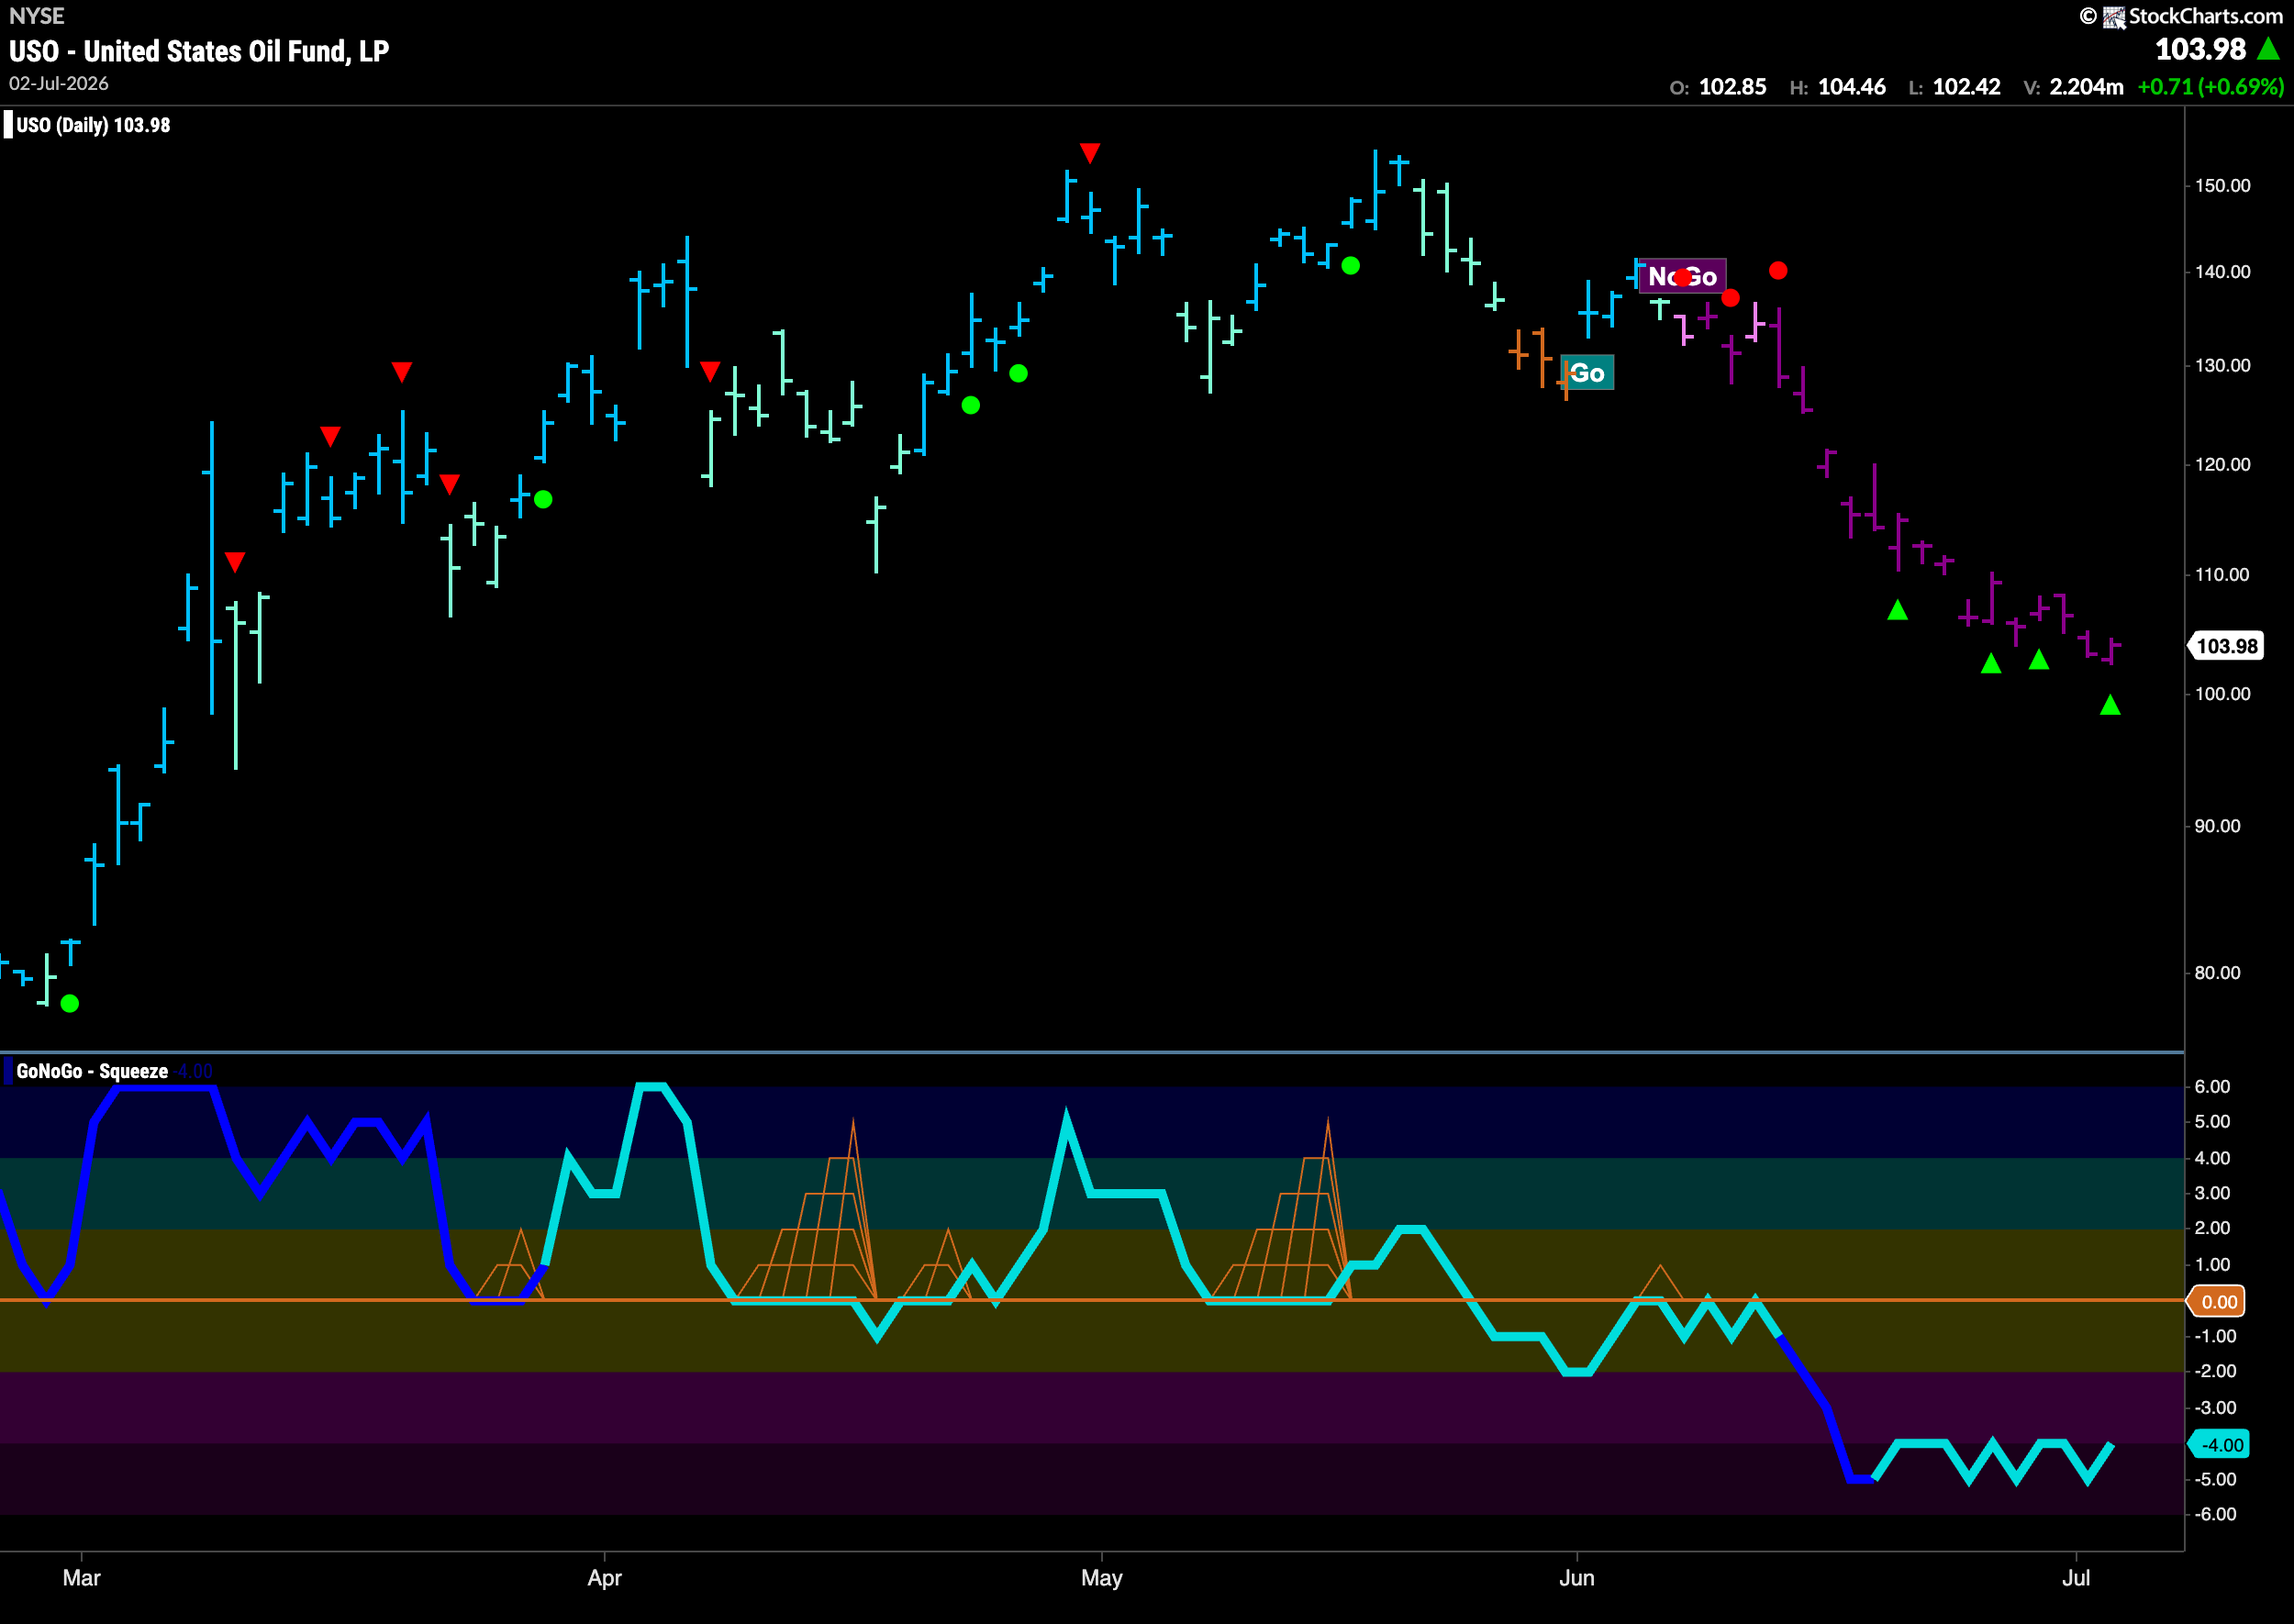
GoNoGo Trend shows that the “NoGo” trend in oil has continued with no letting up. The indicator is painting uninterrupted strong purple bars as price sets new lower lows. We see several NoGo Countertrend Correction Icons (green arrows) that for now are not being respected as the price continues to fall. Now, with the GoNoGo Trend indicator painting strong purple bars we see GoNoGo Oscillator is rising out of oversold territory at a value of -4.
Gold ($GLD) “NoGo” Trend Continues but Weakens
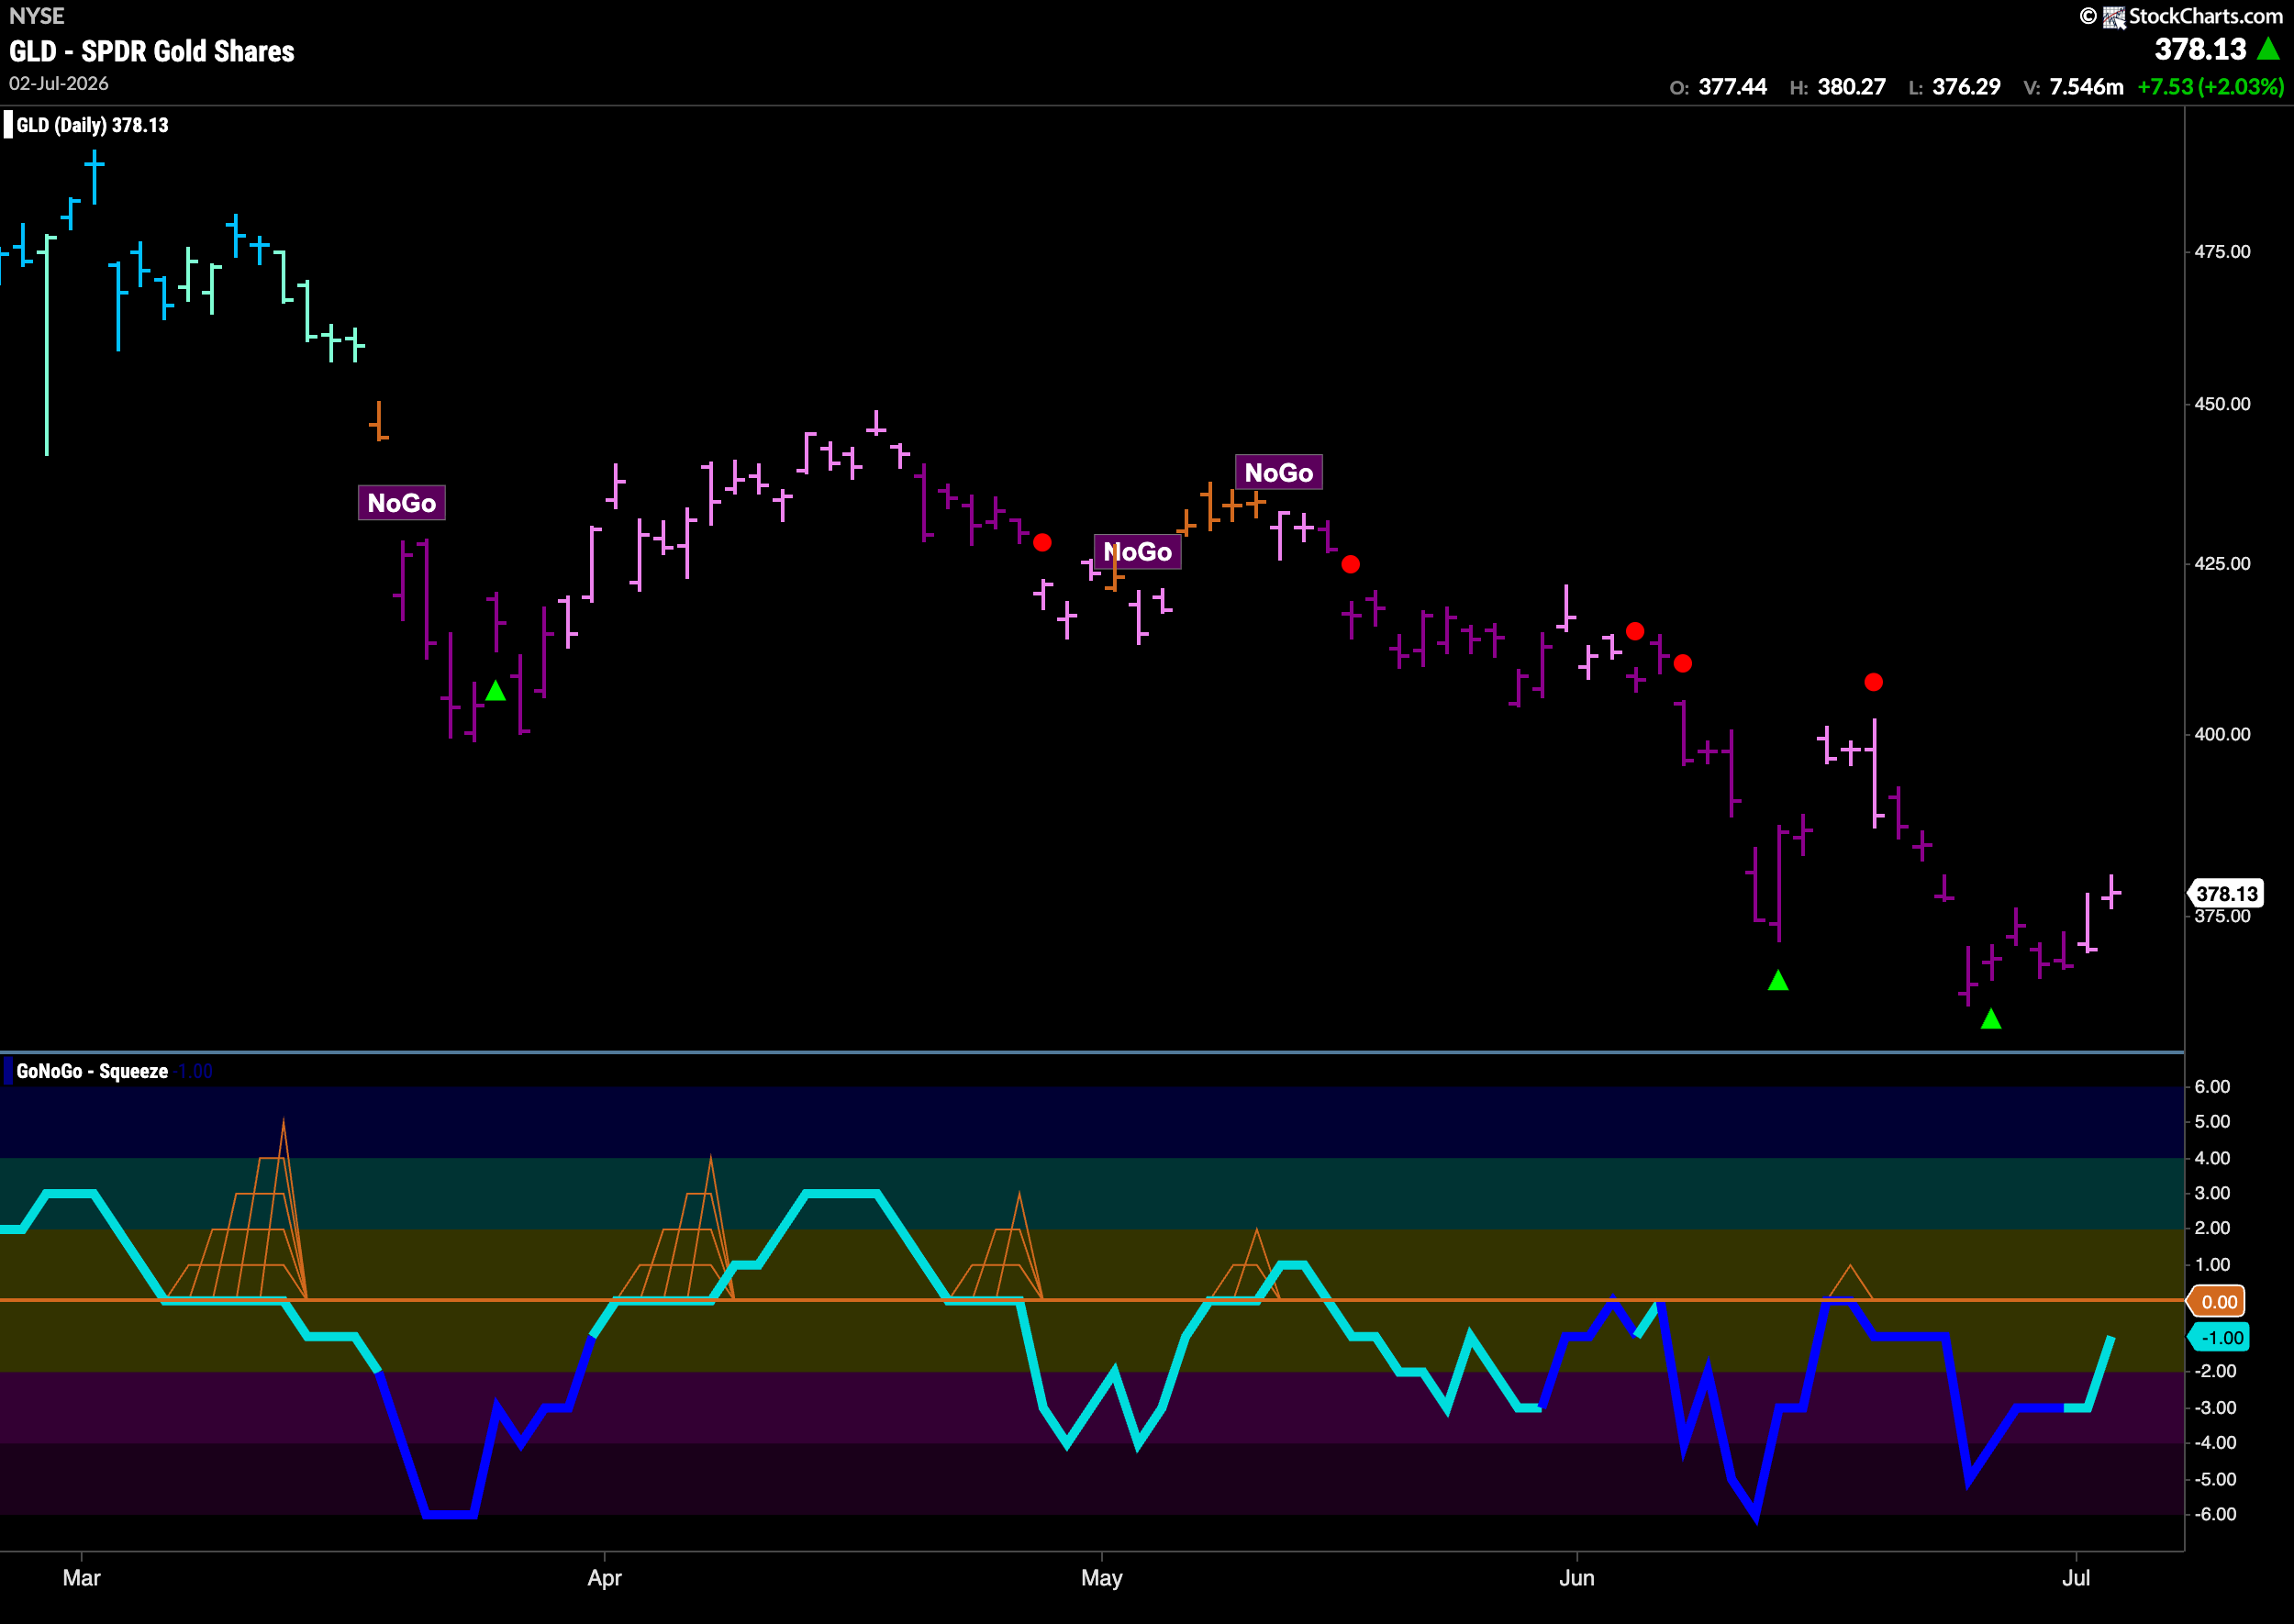
The “NoGo” trend continues for gold but having set a new lower low we see GoNoGo Trend painting weaker pink bars as price tries to rally off the lows. GoNoGo Oscillator is rising toward the zero line and we will watch to see how it interacts with the zero line when it gets there. If it is turned away by that level we can expect the trend to continue and an attempt at new lower lows.
Sector RelMap
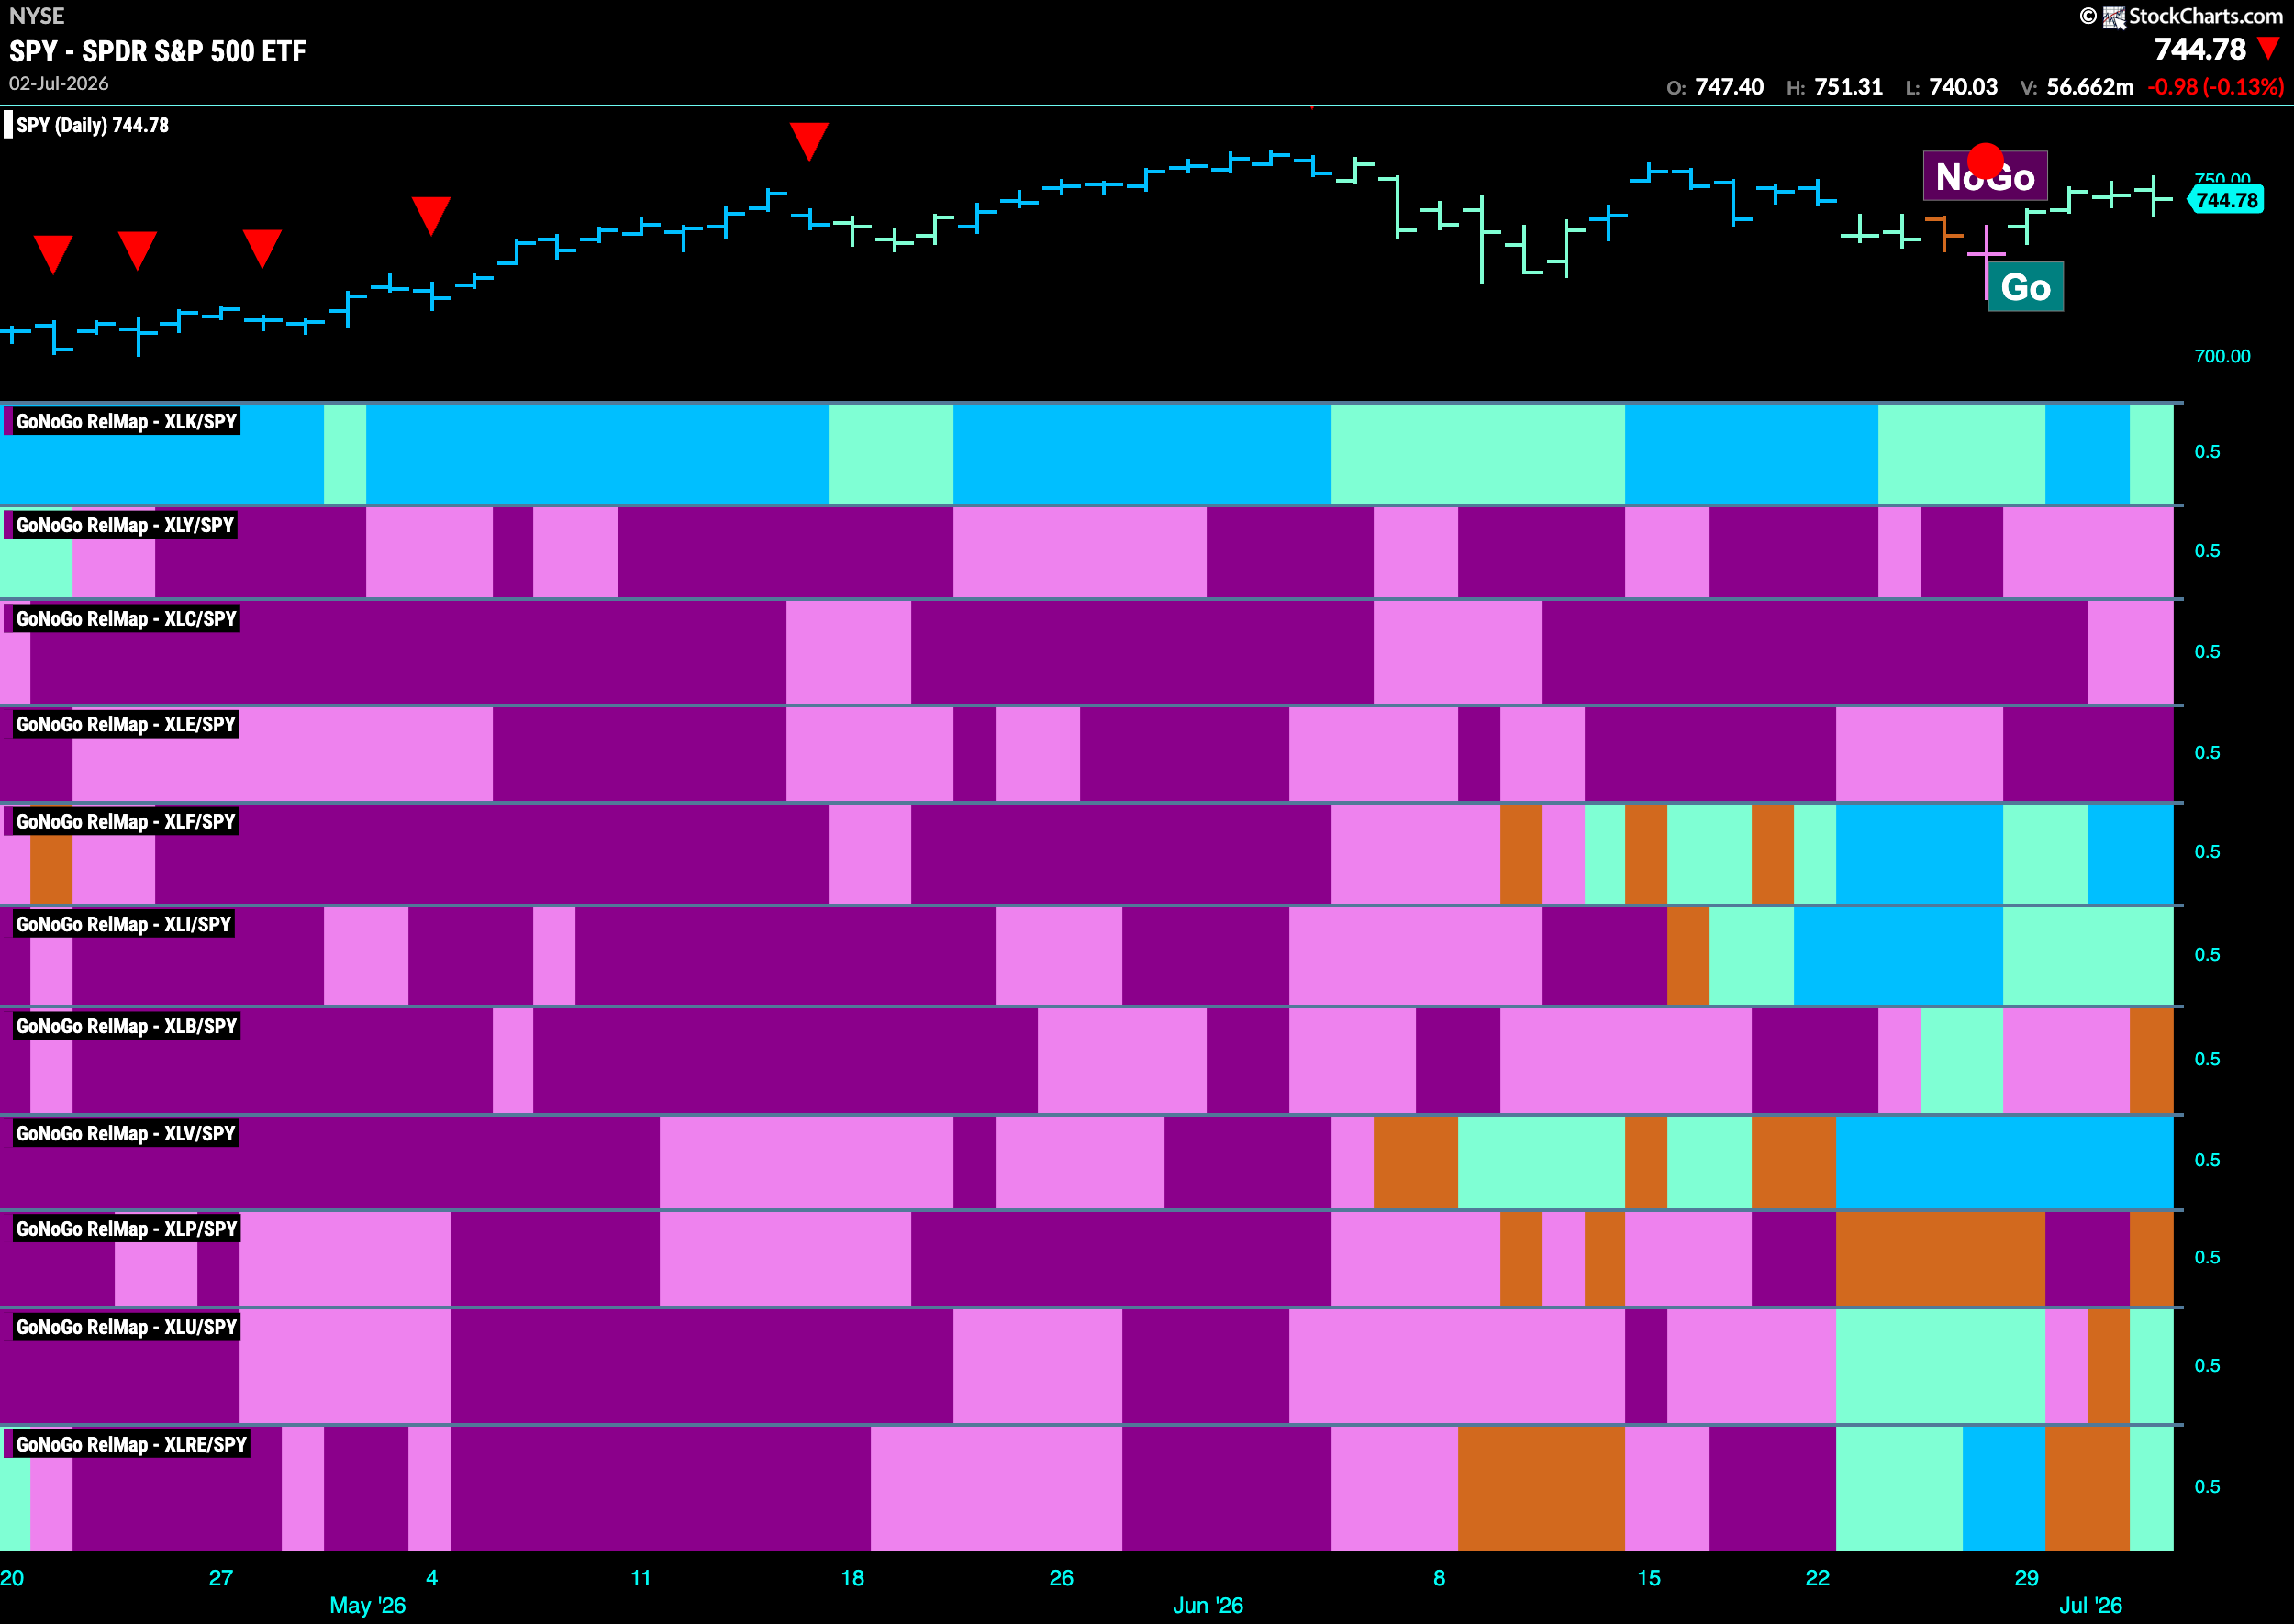
Below is the GoNoGo Sector RelMap. This GoNoGo RelMap applies the GoNoGo Trend to the relative strength ratios of the sectors to the base index. With this view we can get a sense of the relative out performance and relative underperformance of the sectors. 3 sectors are in a relative “Go” trend. $XLV, in the 8th panel is painting a string of strong blue relative “Go” bars.
Healthcare Sub-Group RelMap
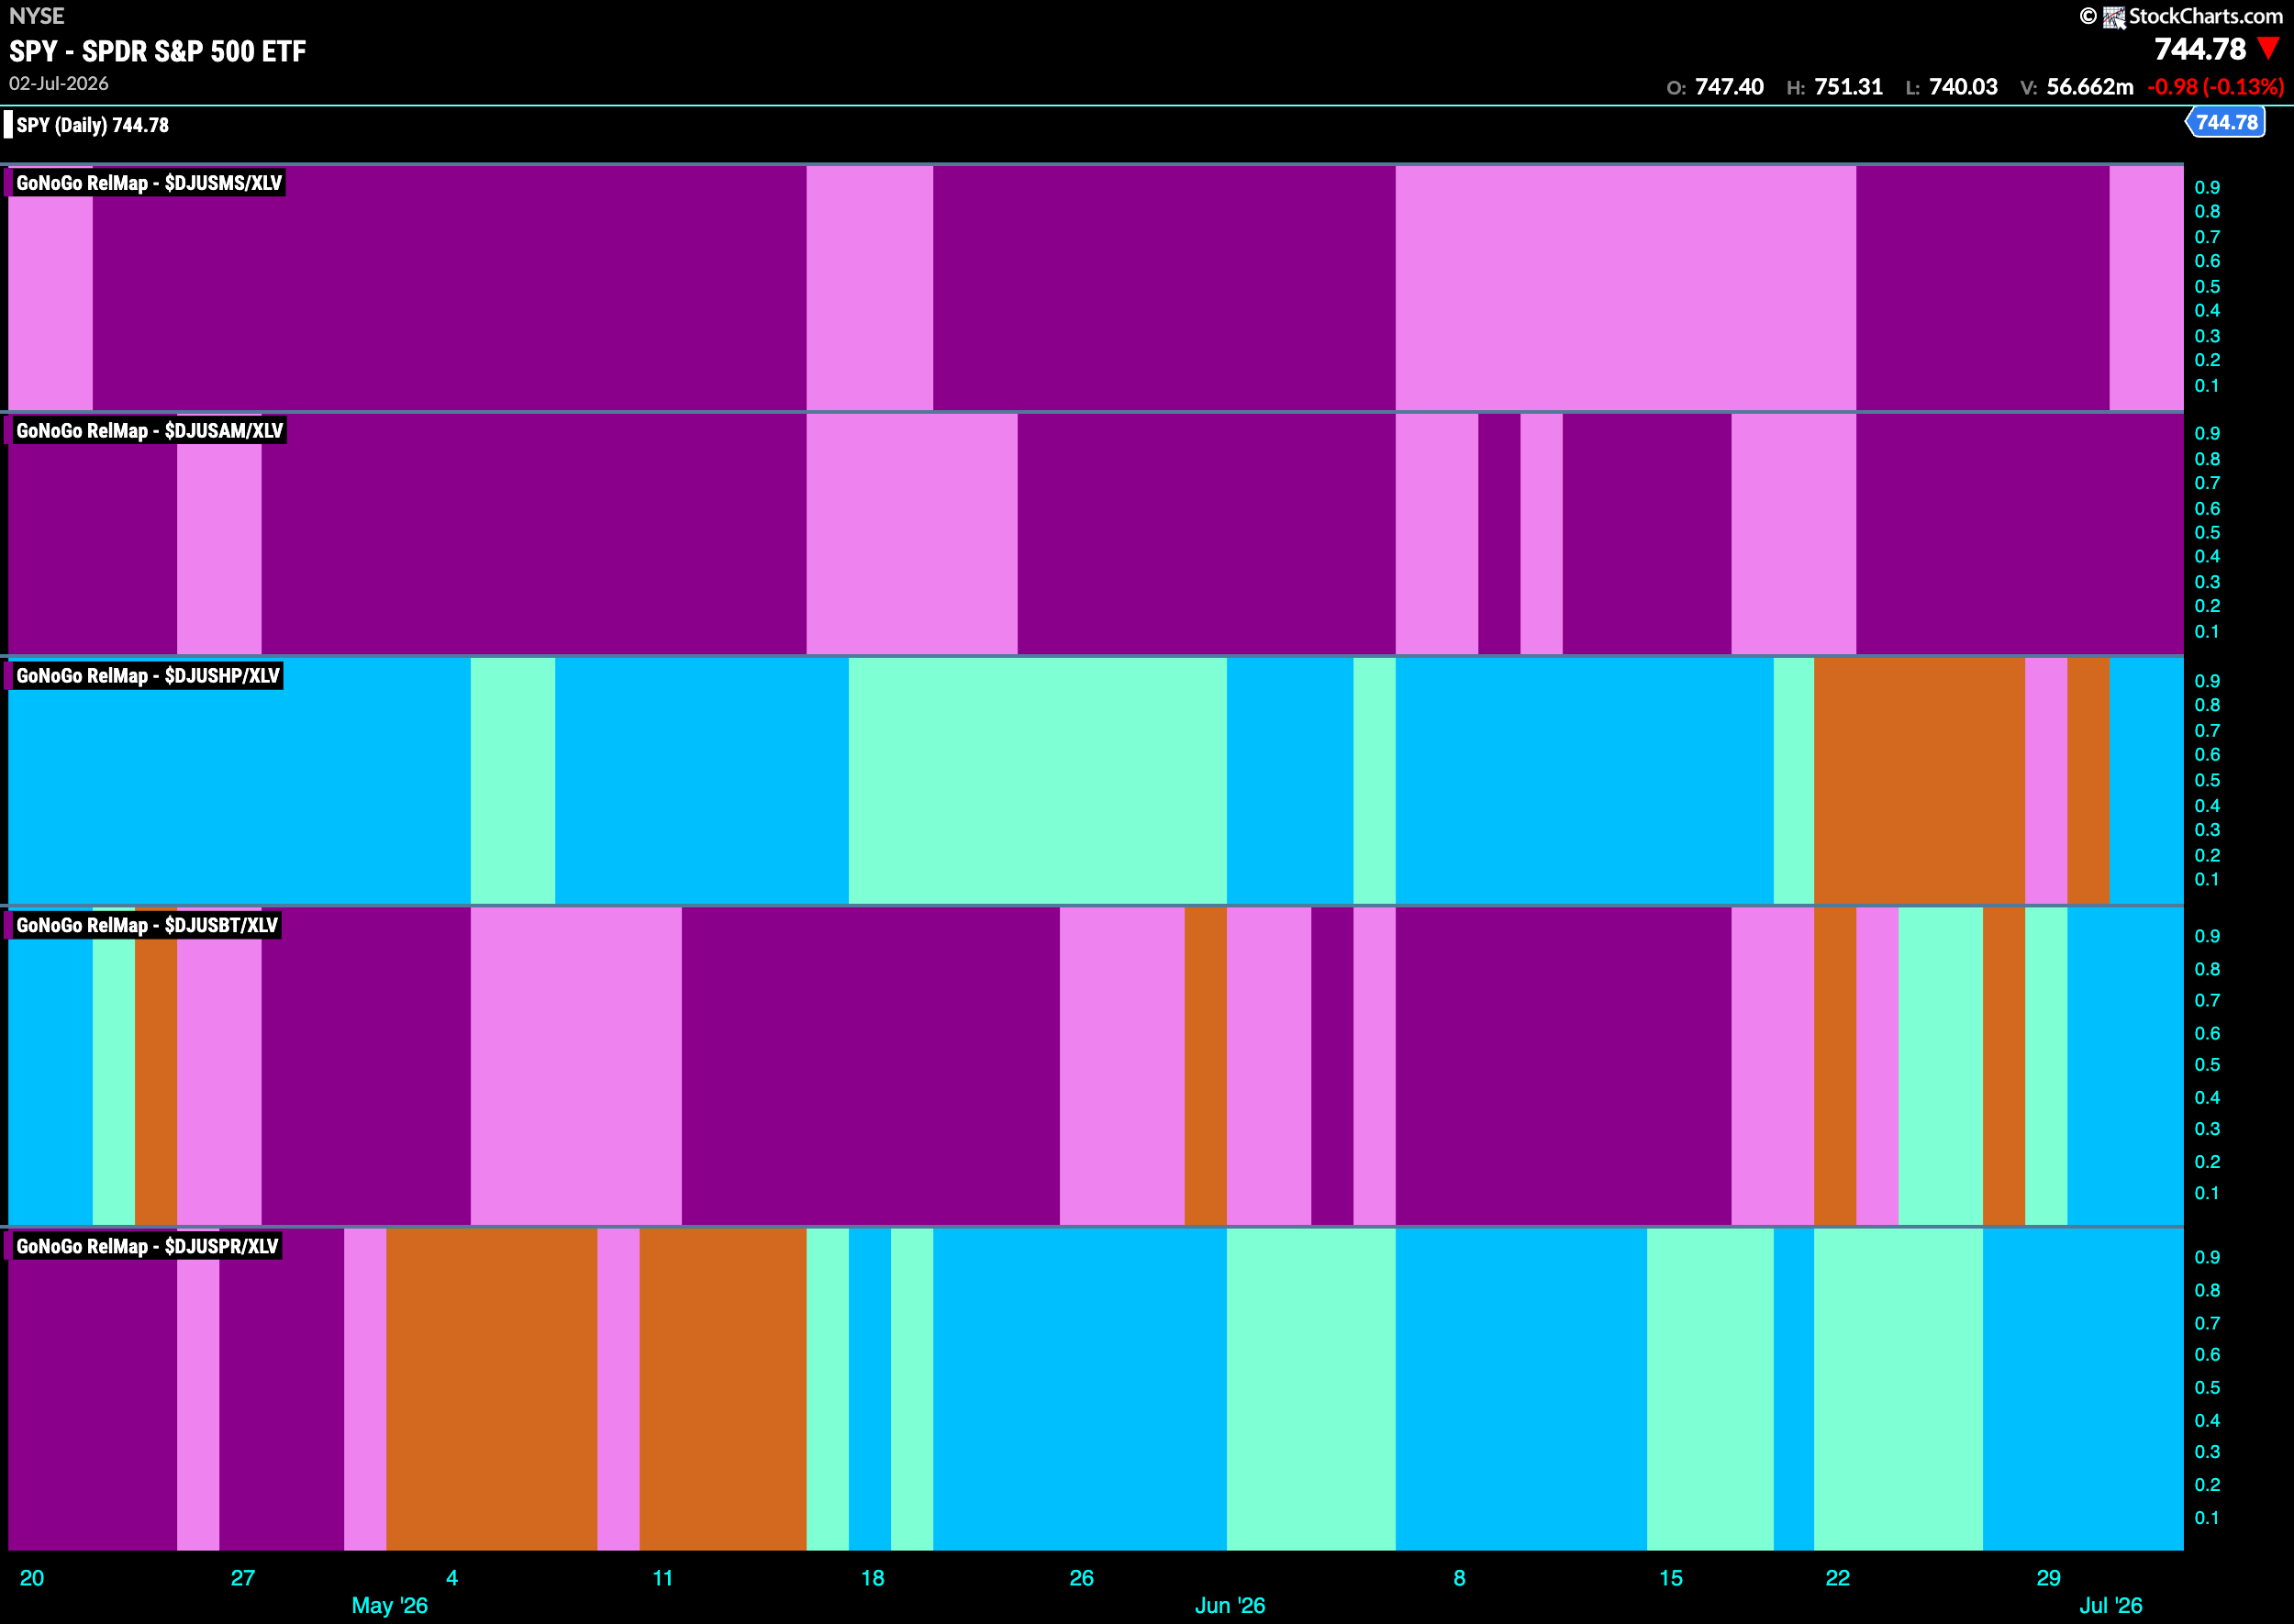
The chart below shows a relative trend breakdown of the sub groups within the healthcare sector this week. The Sub-Group RelMap plots the GoNoGo Trend of each sub index to the $XLV. We saw in the above GoNoGo Sector HeatMap that $XLV is painting relative “Go” bars. When we look at the below RelMap we can see that the pharmaceuticals index in the last panel is painting strong blue “Go” bars on a relative basis.
$CMPS Looks for Support in “Go” Trend
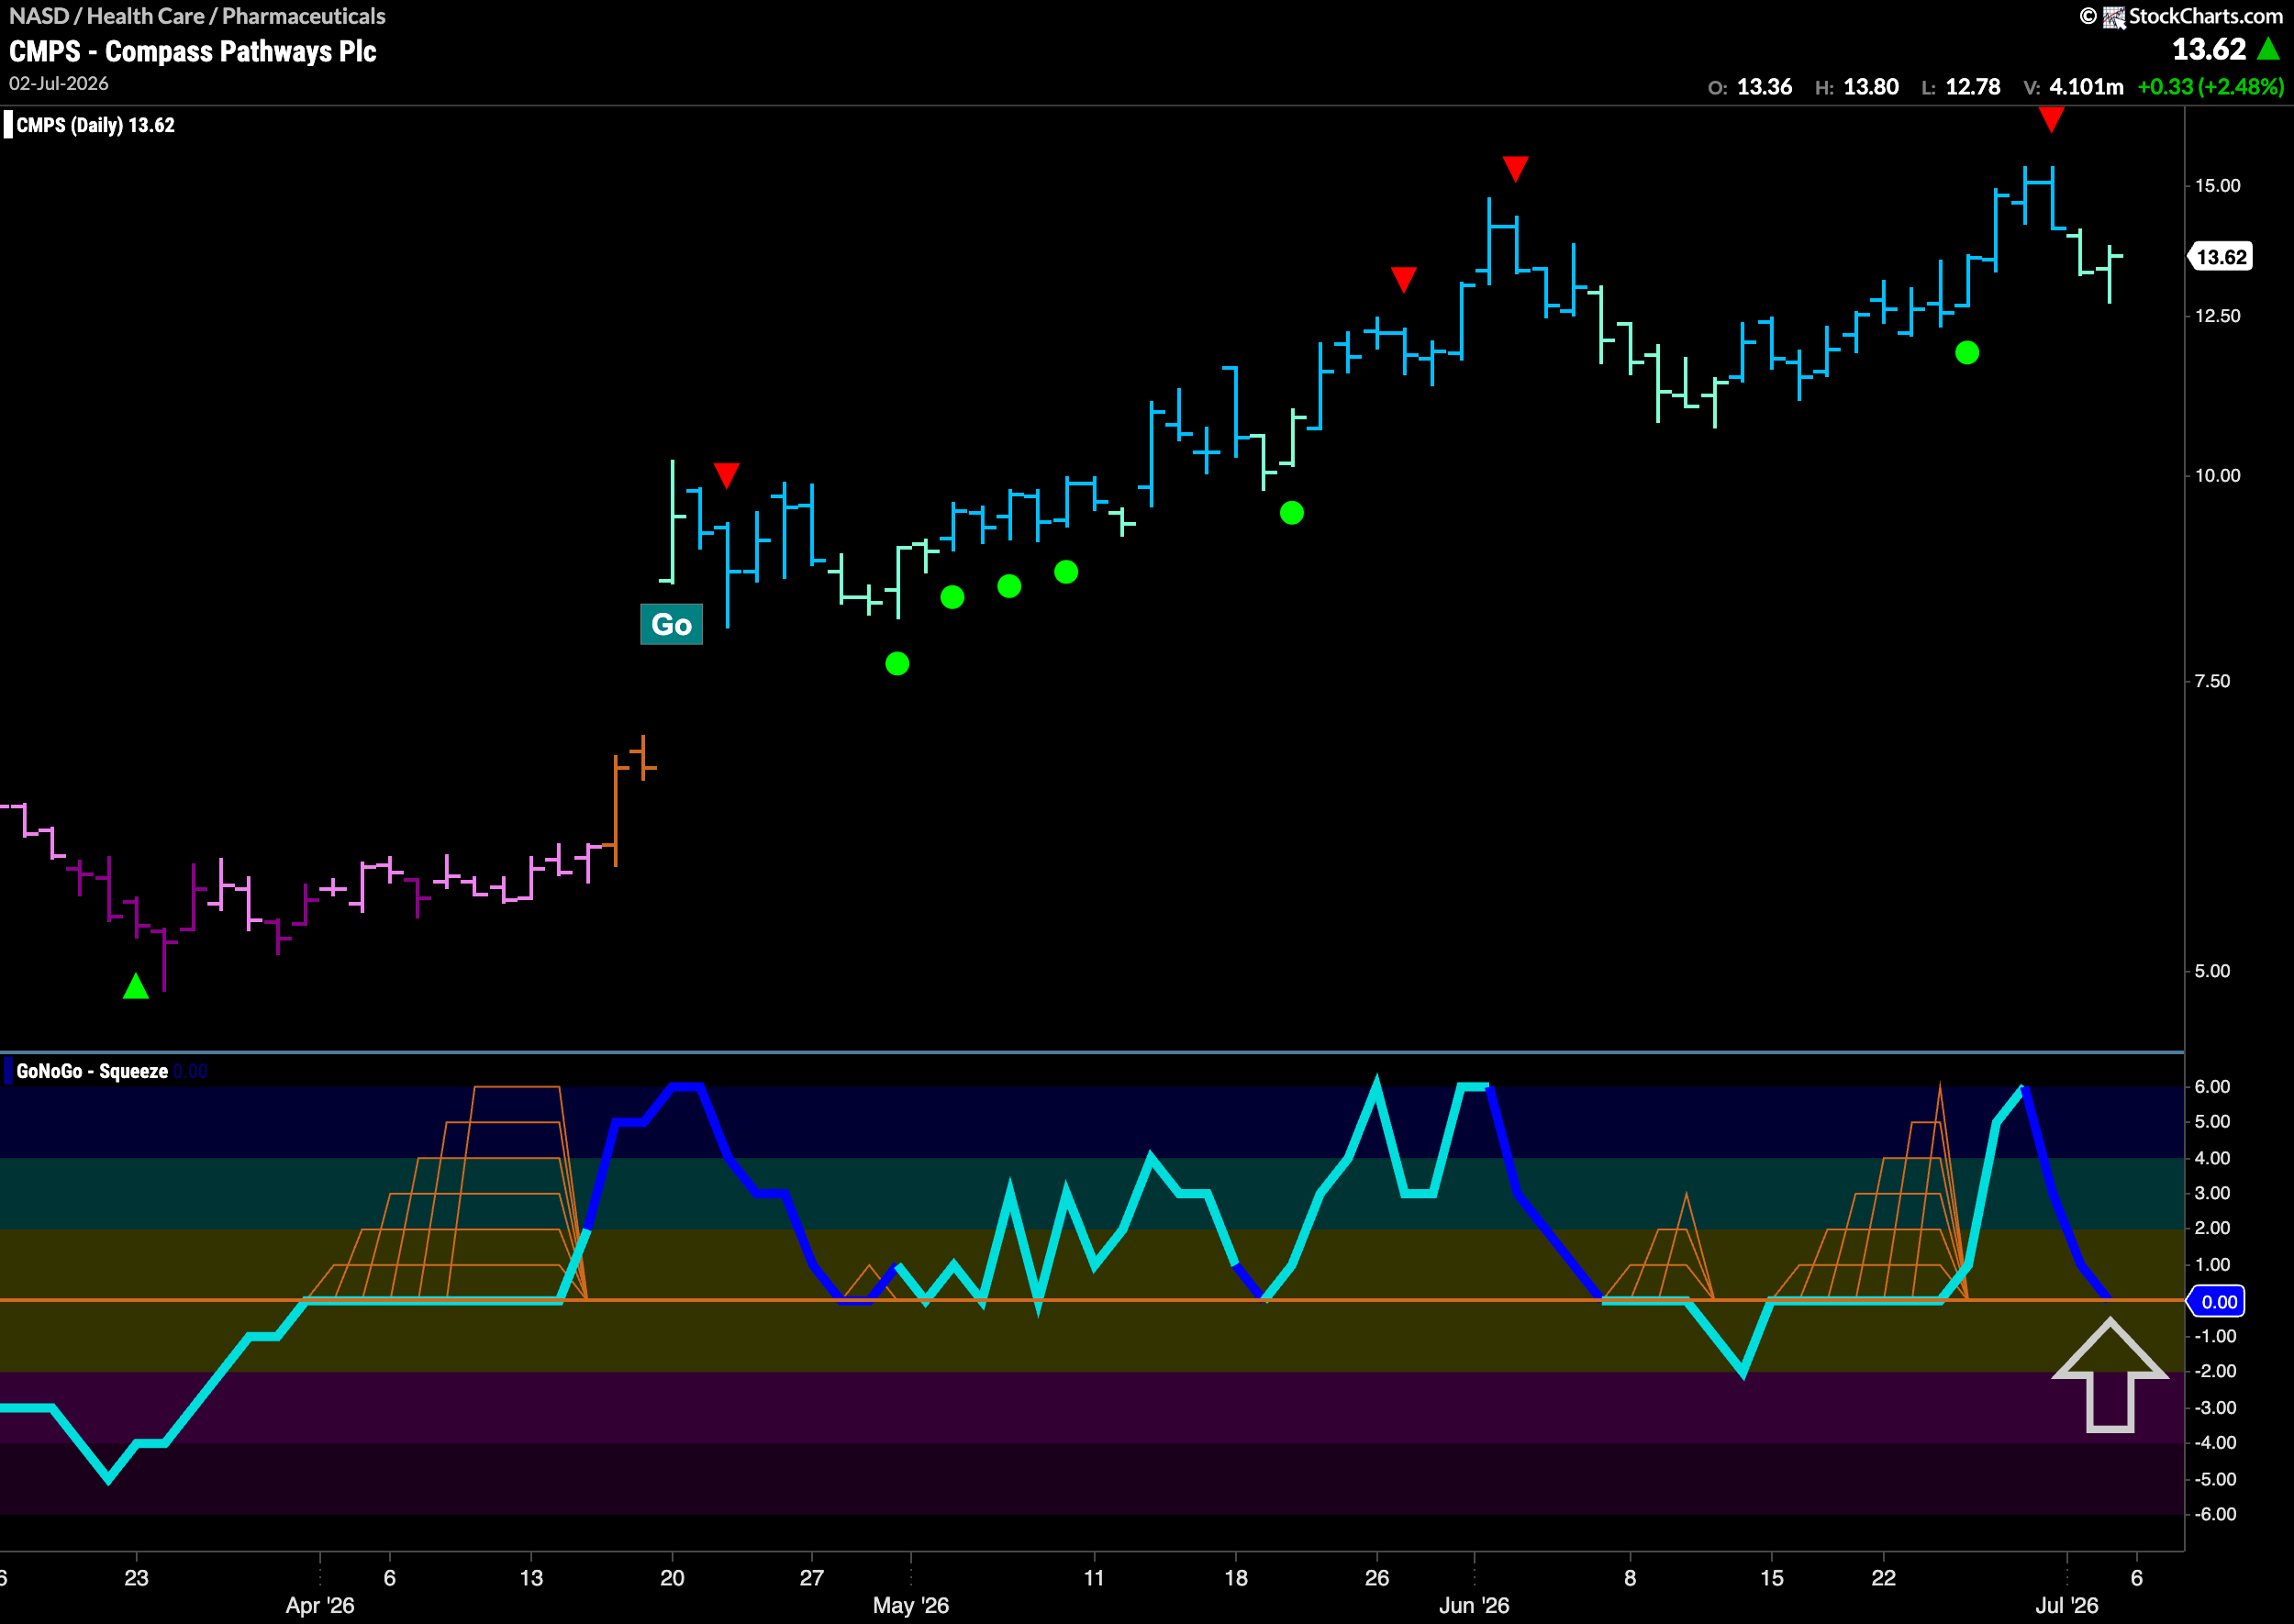
The GoNoGo Chart below shows that price has been in a “Go” trend since April and we have seen higher highs and higher lows as GoNoGo Trend has painted mostly strong blue bars. GoNoGo Oscillator has been primarily at or above the zero line, providing momentum support for the trend. When we look at the oscillator panel, we can see that we are currently testing zero again from above. We will look for support here, and if we get it we will know that momentum is resurgent in the direction of the “Go” trend and can expect an attack on new highs.
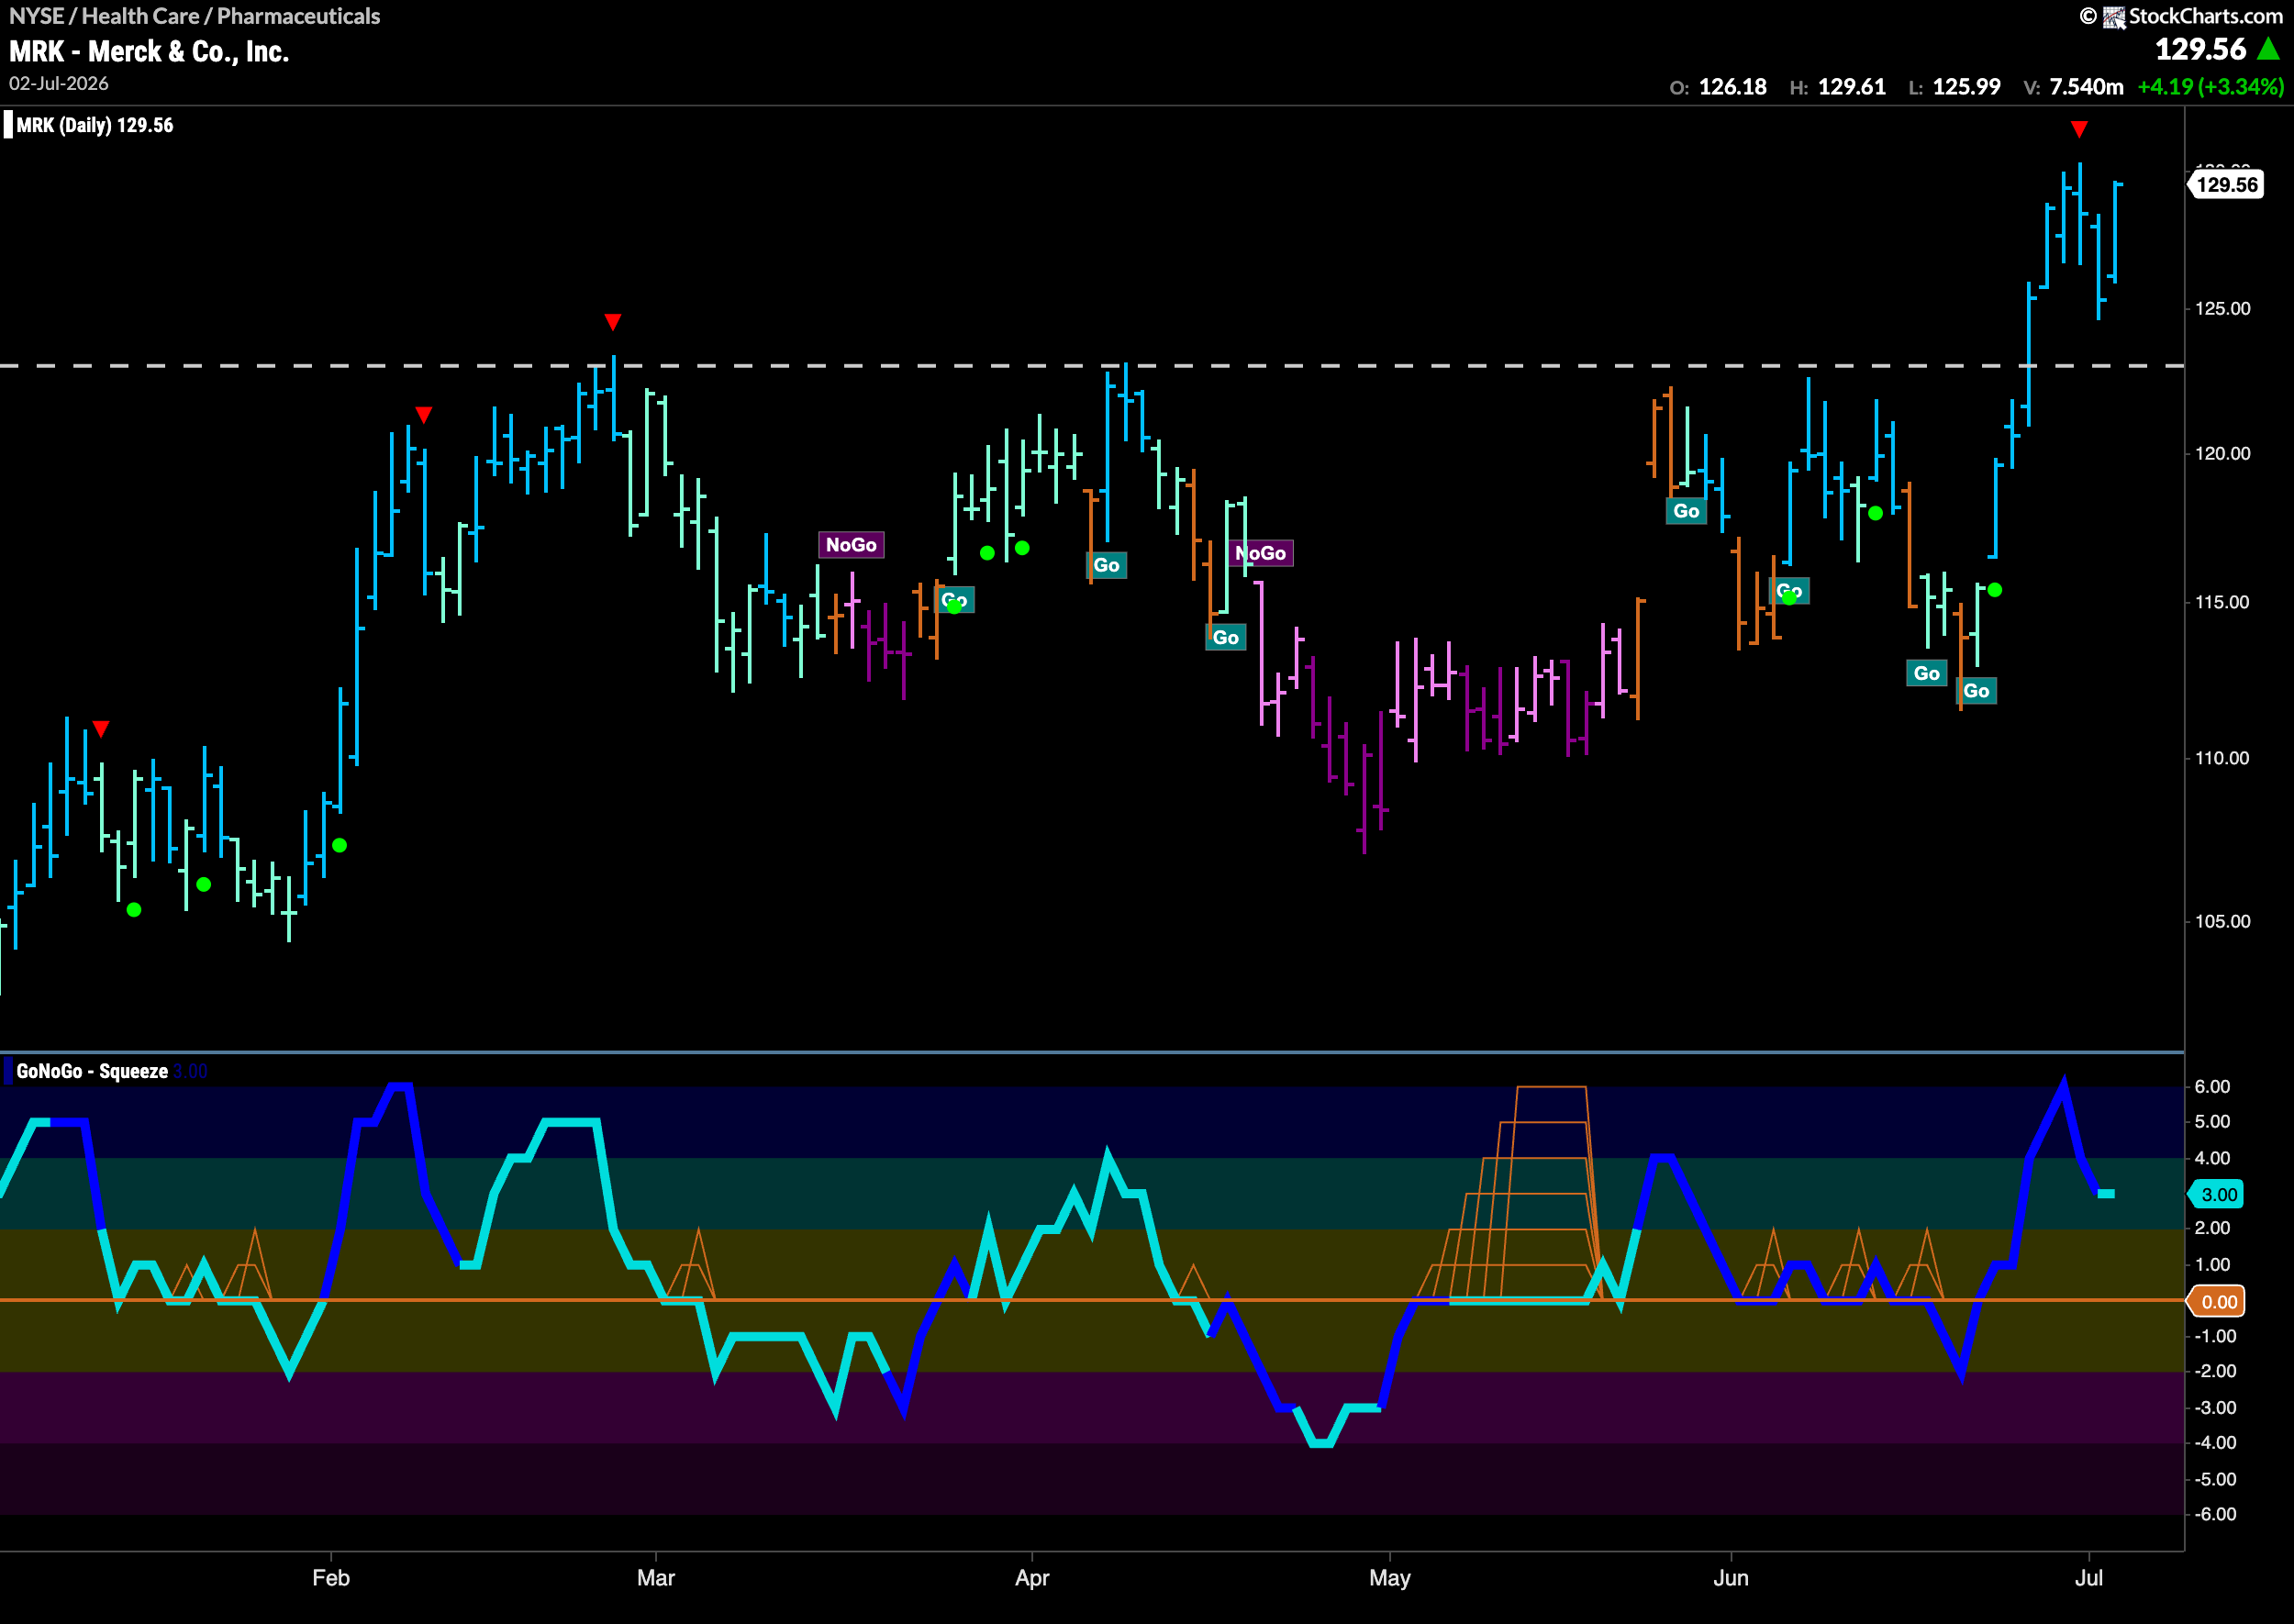
$MRK Looks to Consolidate above Support
The chart below shows that $MRK has broken above long term resistance. Now, we see price trying to consolidate above that level and GoNoGo Trend is painting strong blue “Go” bars. We will watch for this level to be support going forward and this is a representation of the “polarity” concept in technical analysis. GoNoGo Oscillator is in positive territory but no longer overbought and so we know that momentum remains on the side of the “Go” trend.