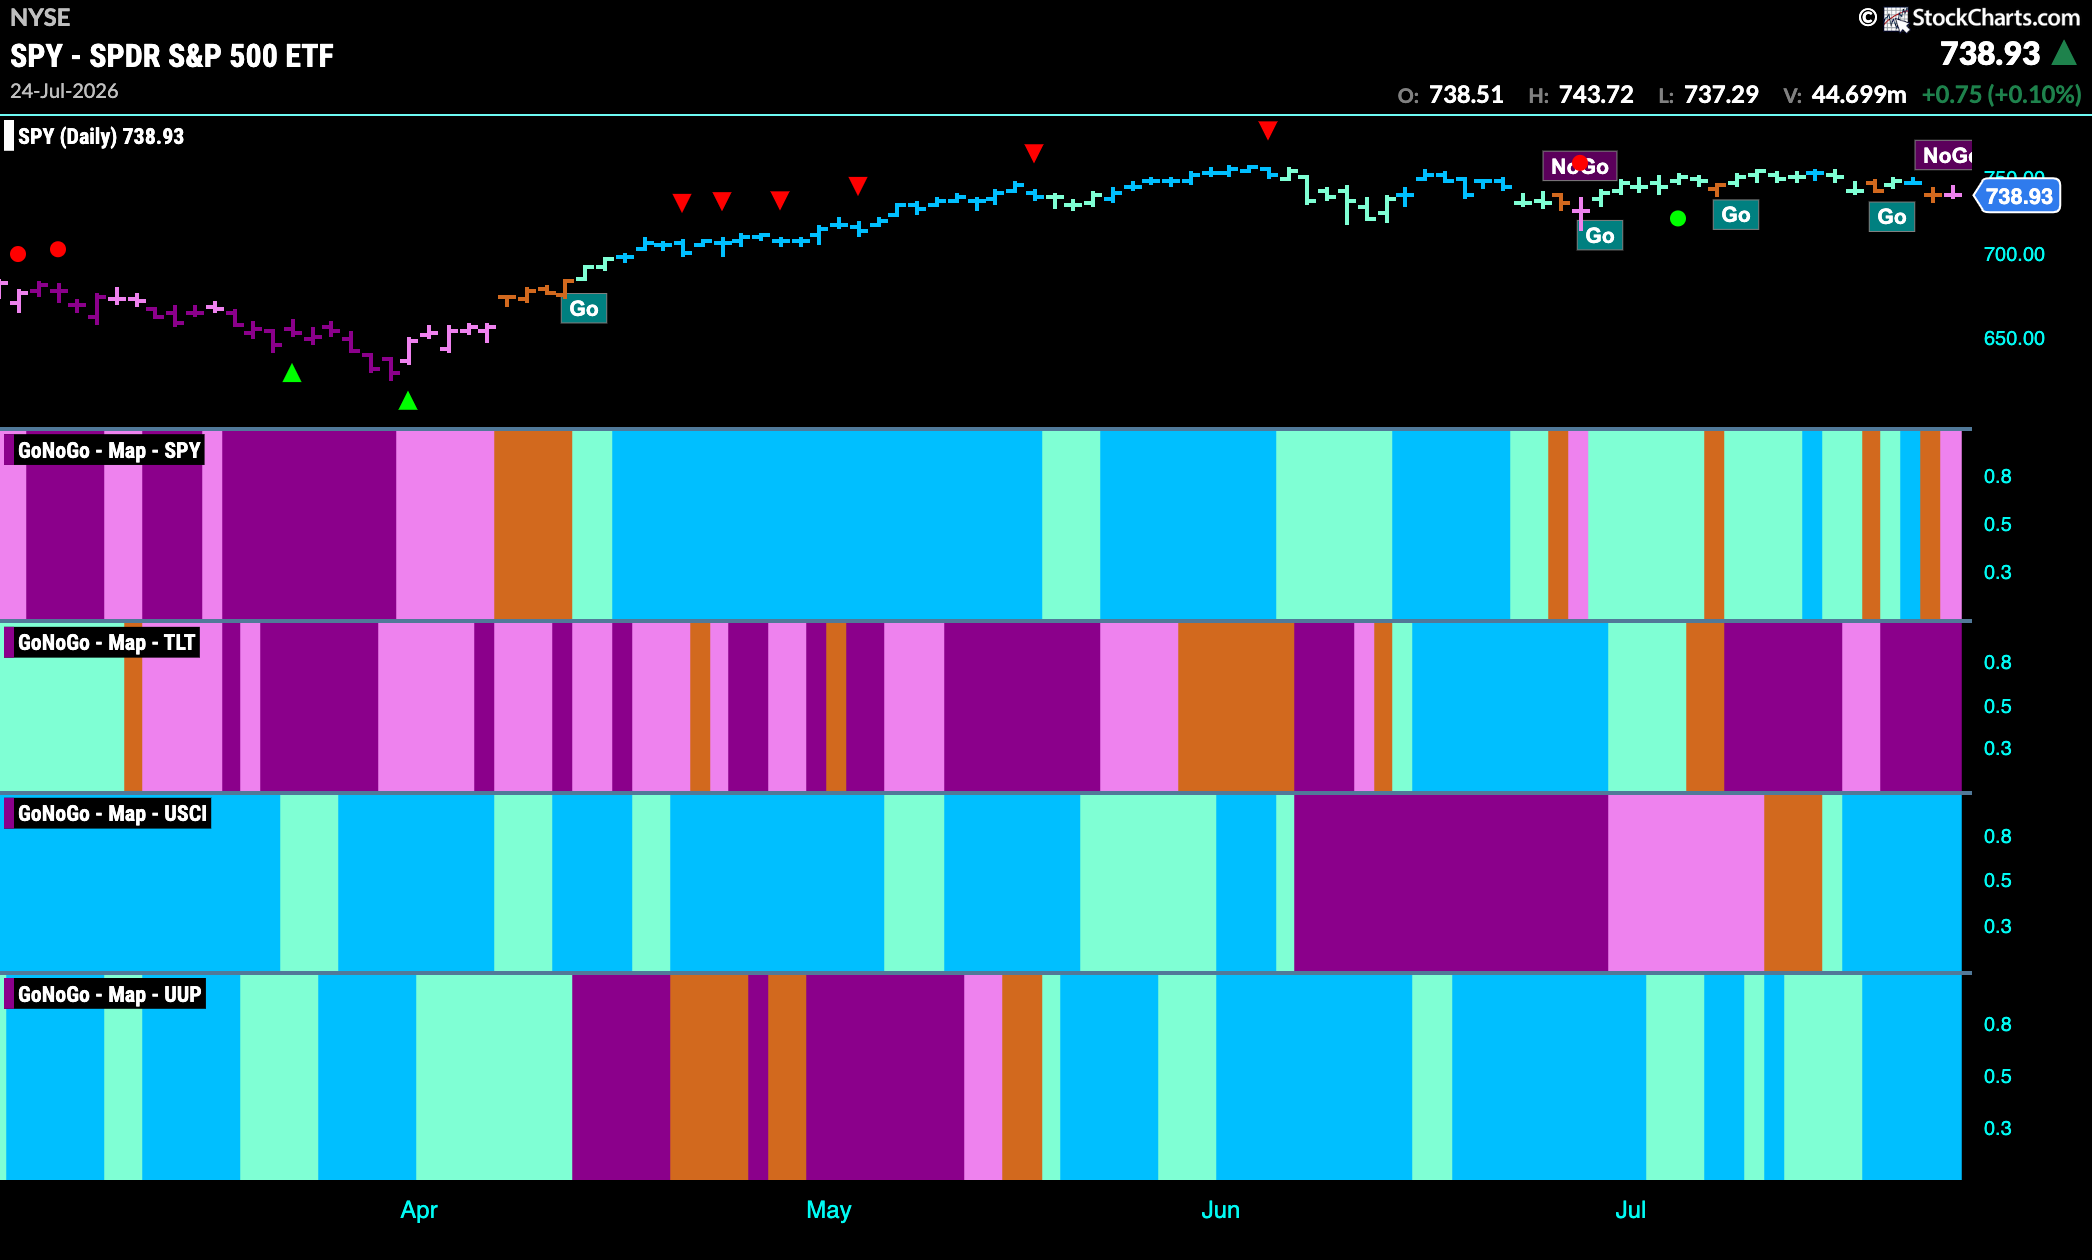
Good morning and welcome to this week’s Flight Path. The equity trend struggled again and after another amber “Go Fish” bar we saw the trend change to a pink “NoGo” bar. Treasury bond prices remain in a “NoGo” trend as we see strong purple bars again this week. U.S. commodities painted a complete week of strong blue “Go” bars this past week and the dollar remained in its “Go” trend painting a string of bright blue “Go” bars.
$SPY Falters and Paints Pink “NoGo” Bar
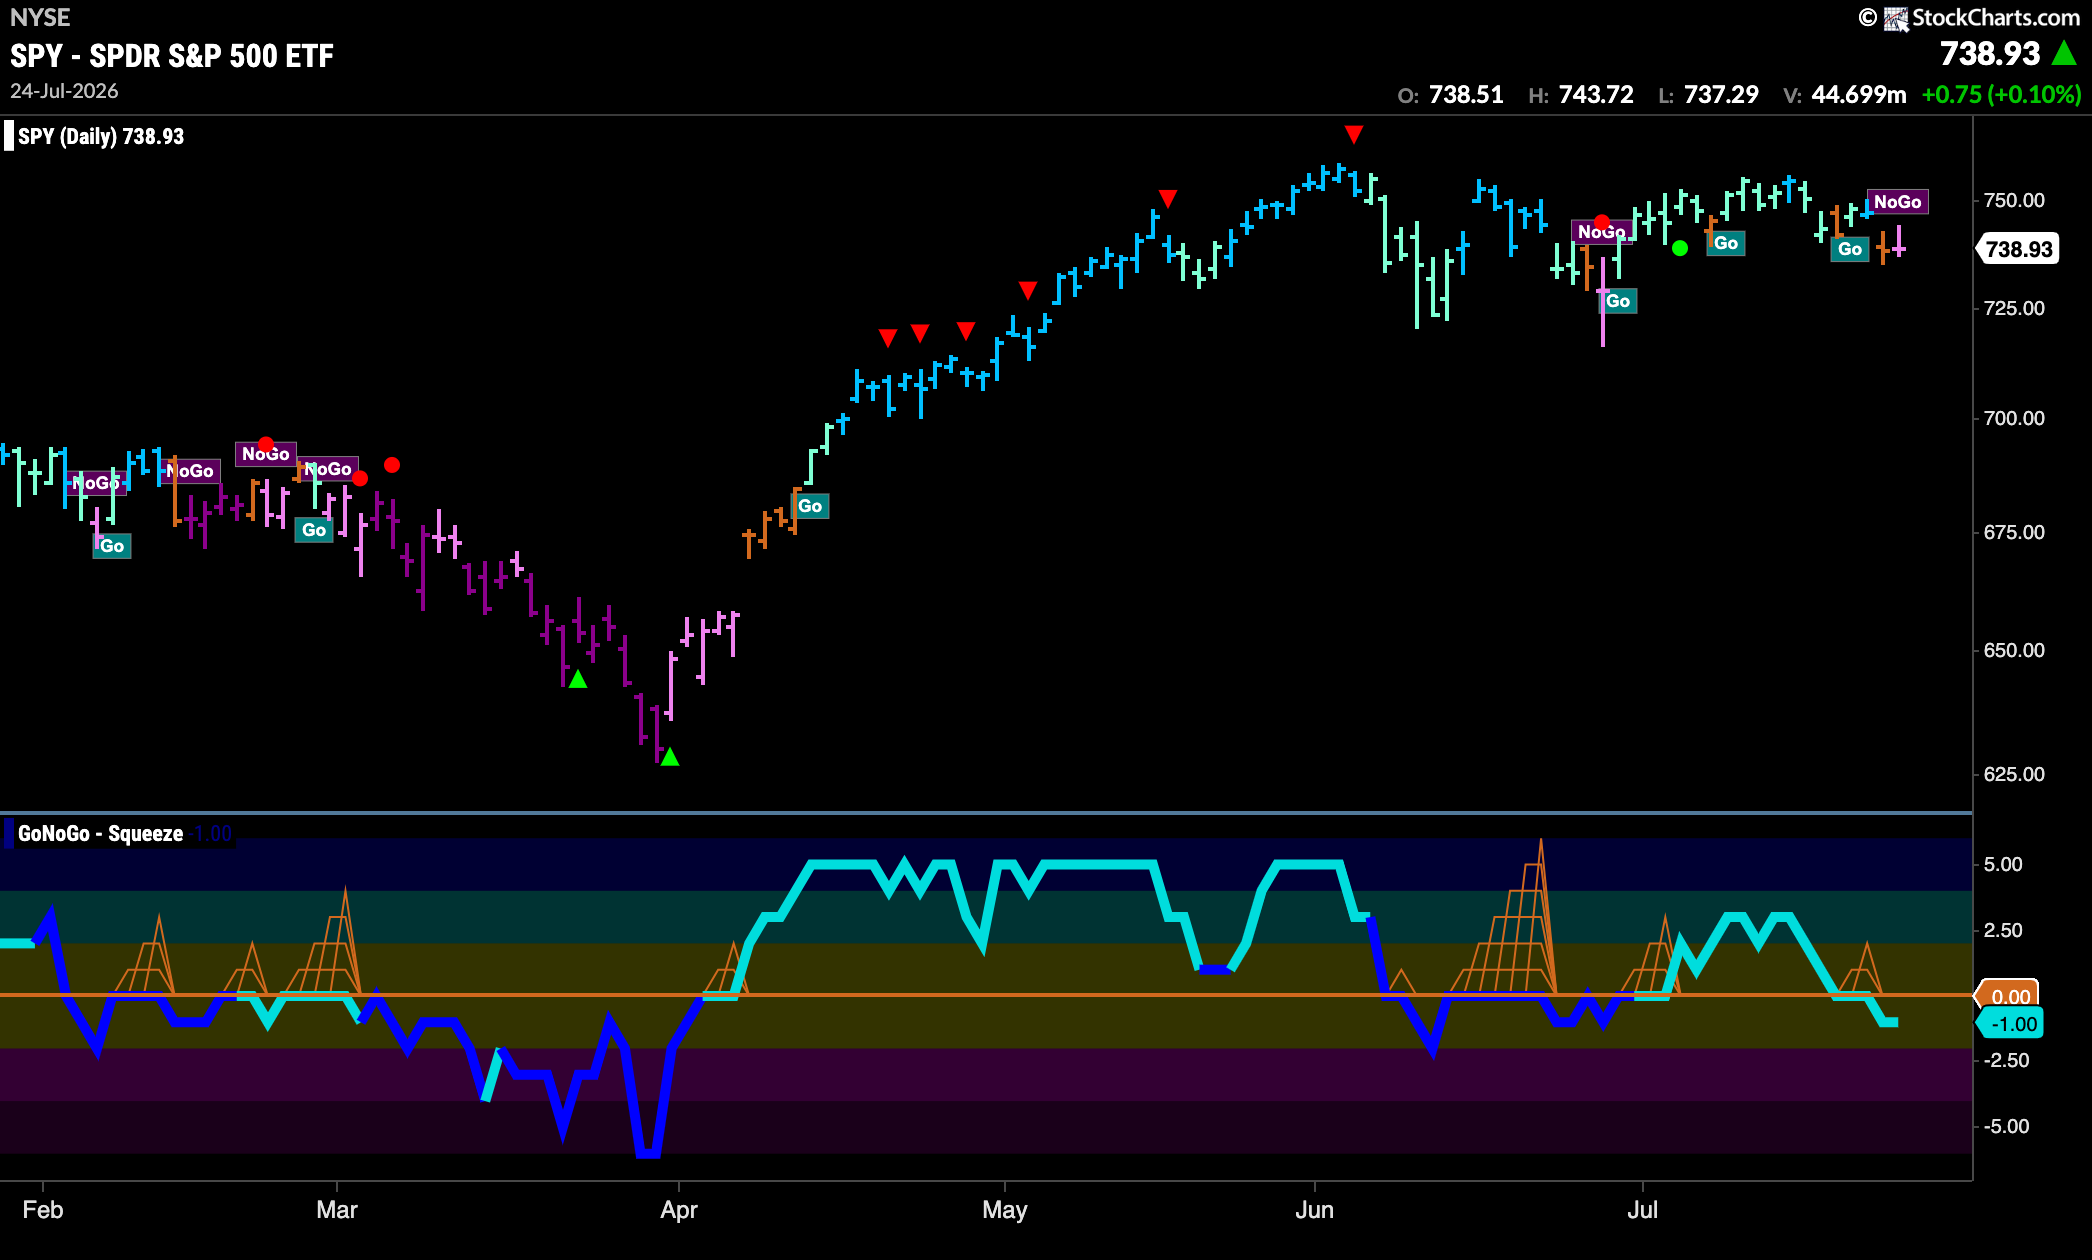
The GoNoGo chart below shows that there has been some uncertainty and choppiness in the equity markets of late. After another amber “Go Fish” bar of uncertainty, we saw a new “NoGo” pink bar as the trend is changing. If we turn our eye to the lower panel, we see that GoNoGo Oscillator has failed to find support at the zero line and is dipping into negative territory.
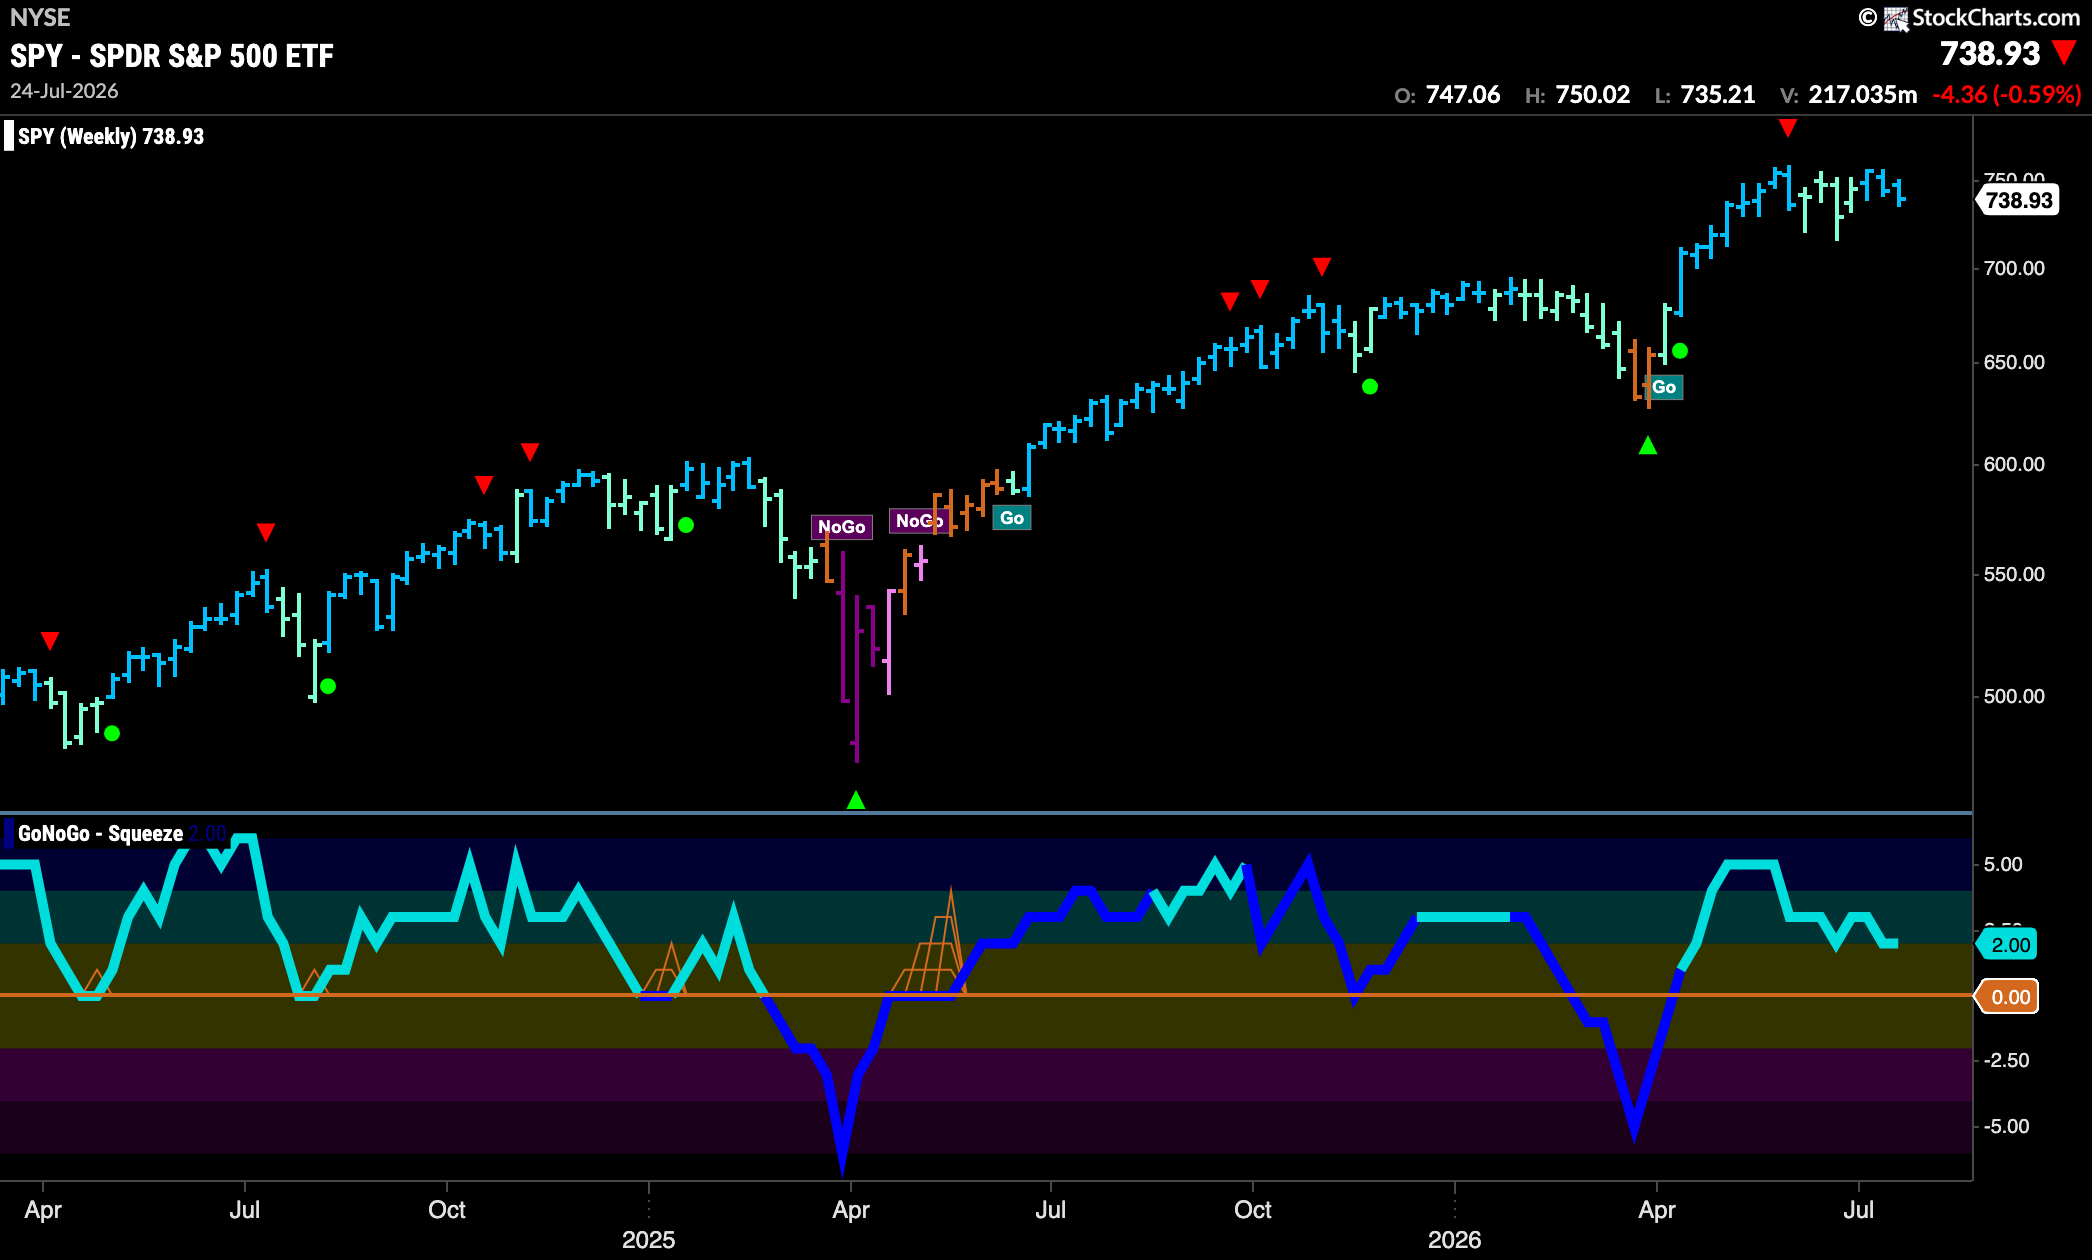
The weekly chart shows that the “Go” trend continues and although a new high has not been set we see another strong blue bar as price moves mostly sideways since the last high. The Go Countertrend Correction Icon (red arrow) that we saw suggested price would struggle to go higher in the short term and this has been the case. GoNoGo Oscillator is in positive territory but no longer overbought at a value of 2.
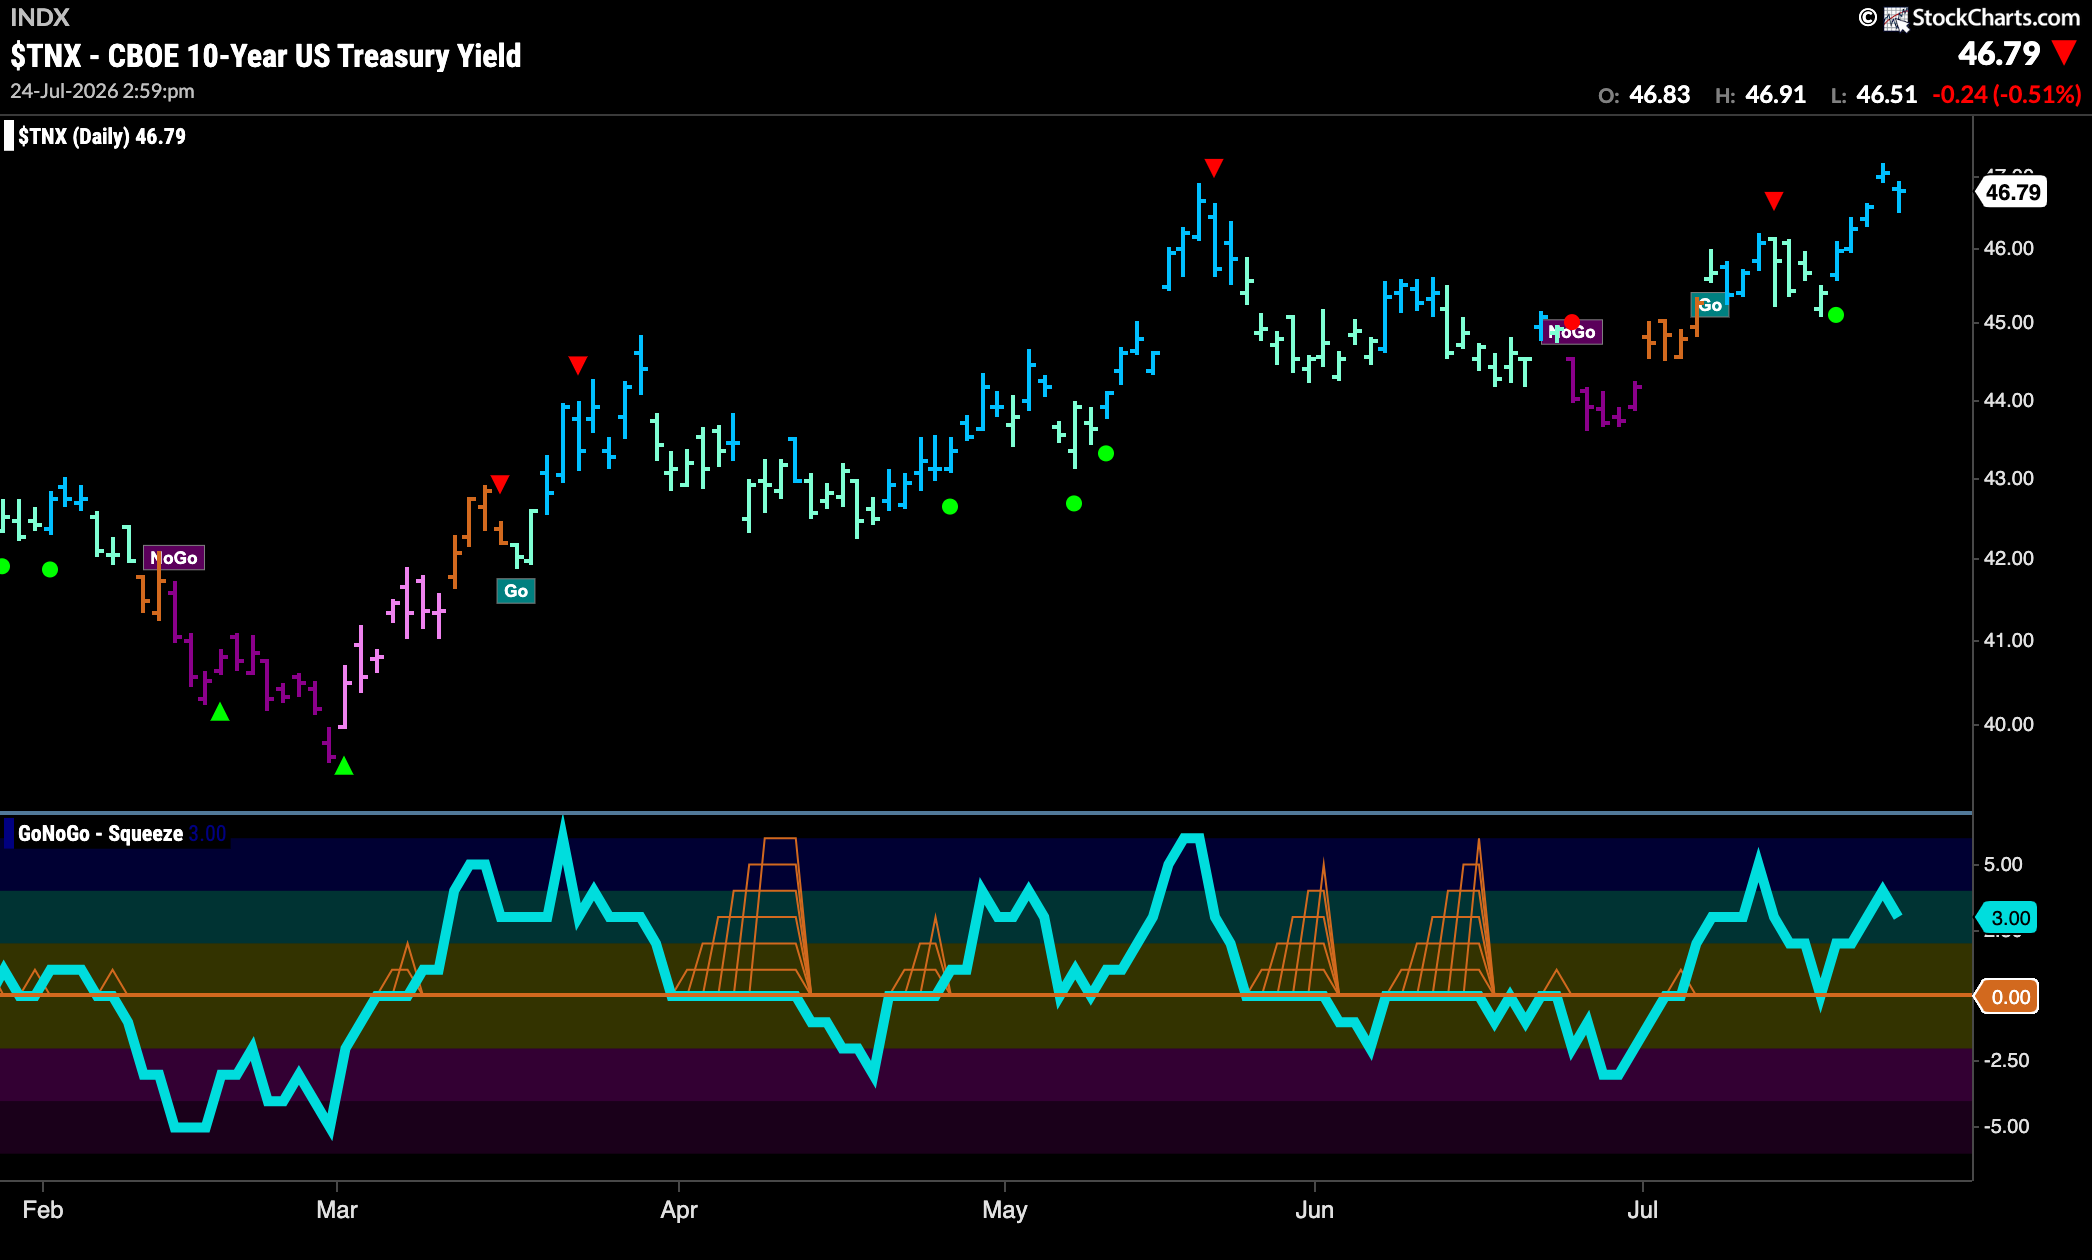
Treasury Rates Remain in “Go” Trend and Show Strength
GoNoGo Trend shows that the “Go” trend for rates continued this week and we saw strong blue bars as price rose to test prior highs. GoNoGo Oscillator is in positive territory but not overbought at a value of 3. With momentum in line with the “Go” trend, we will watch to see if rates can set new higher highs in the coming days.
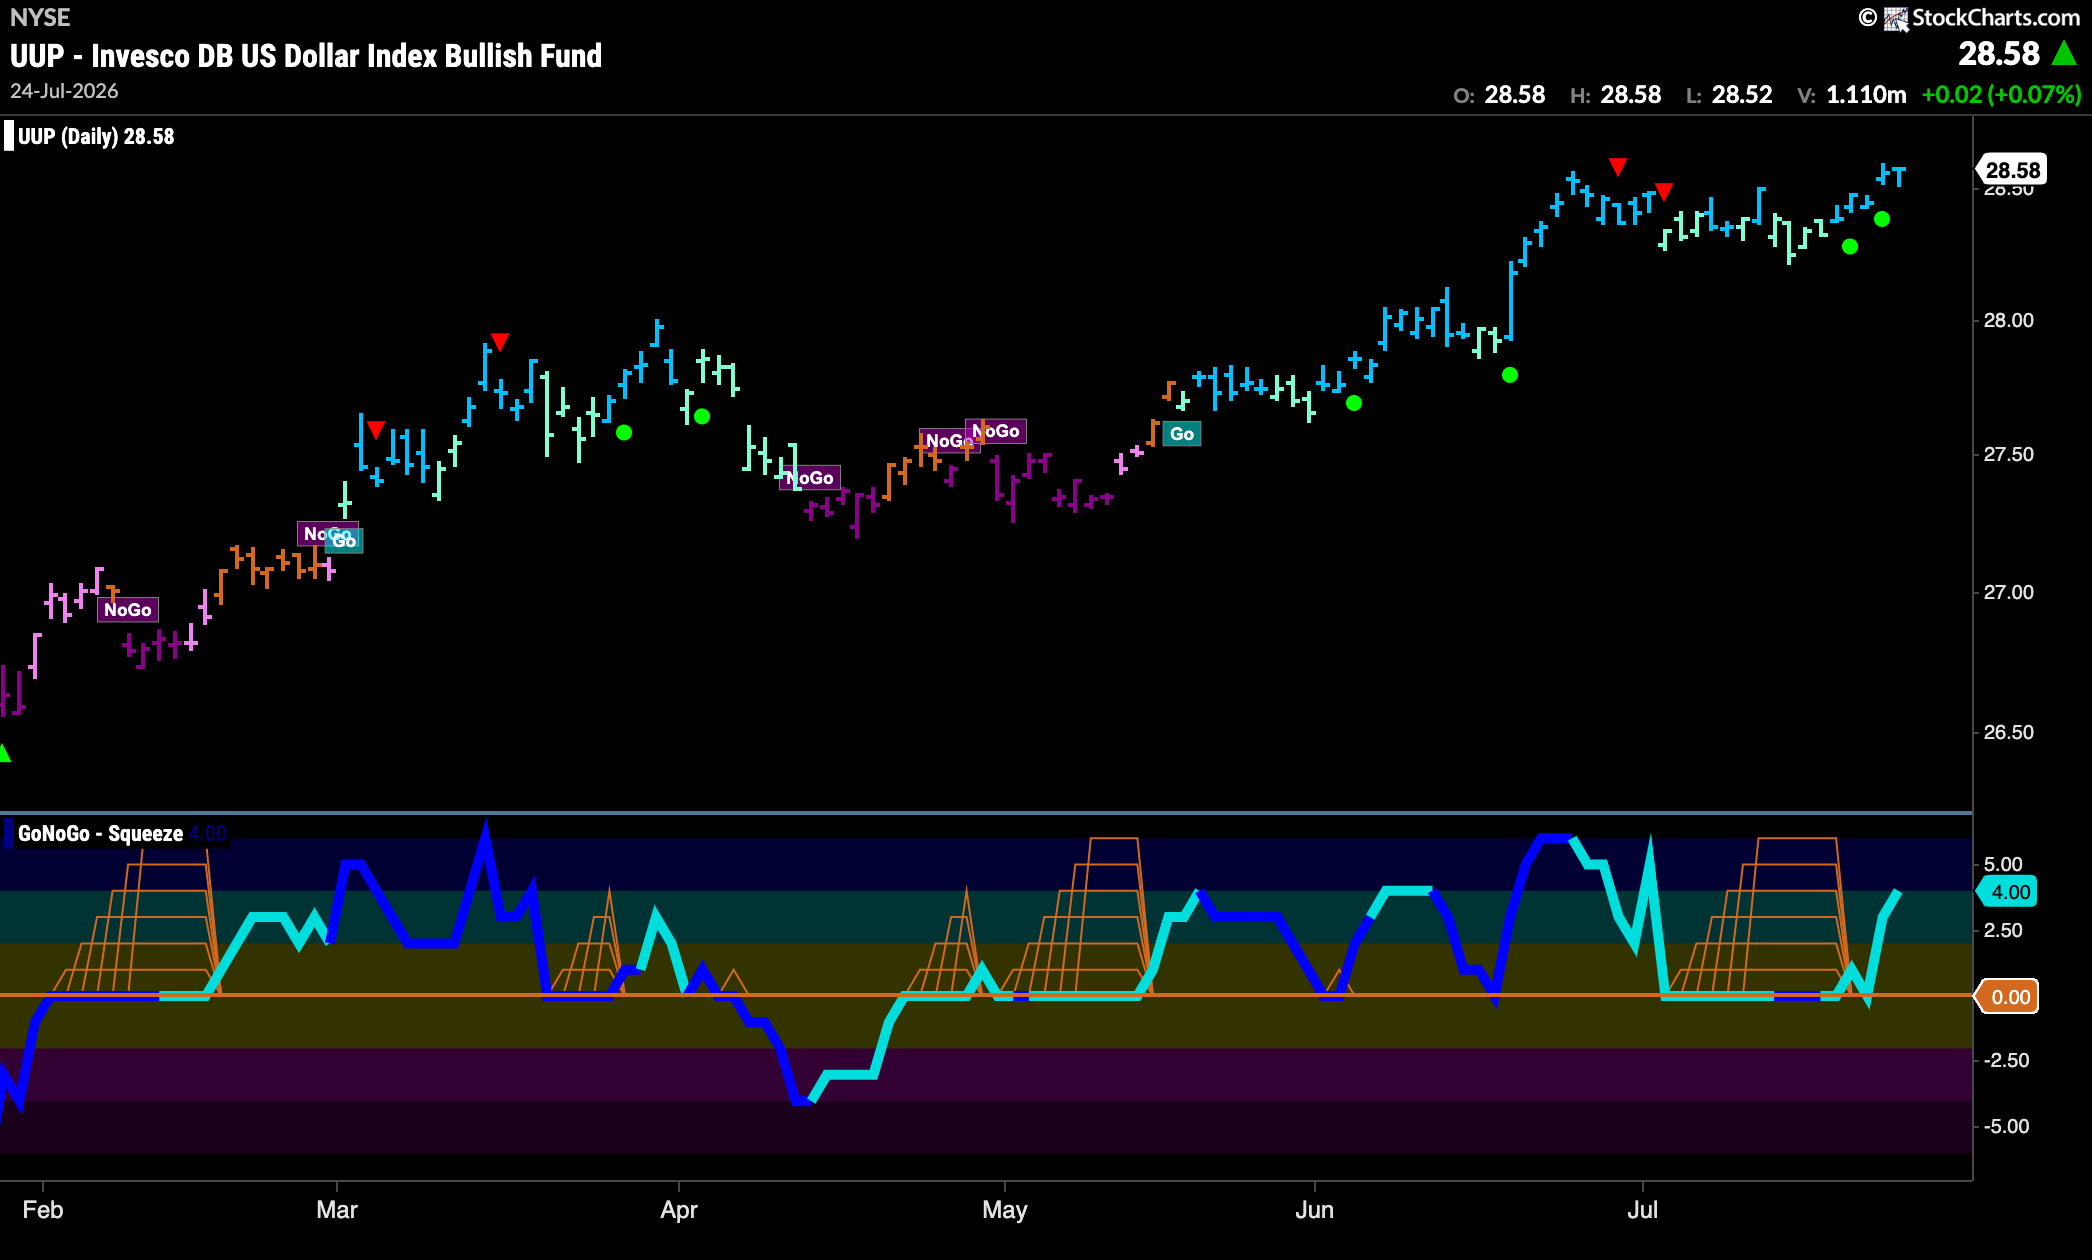
Dollar ($UUP) Shows Strength With Bright Blue “Go” Bars
The chart below shows that the “Go” trend has remained in place for another week and we see strong blue “Go” bars return as price pushes up against prior highs. GoNoGo Oscillator broke out of an extended Max GoNoGo Squeeze into positive territory and is now at a value of 4. With momentum showing strong support for the underlying “Go” trend we will watch to see if price can break to new higher highs.
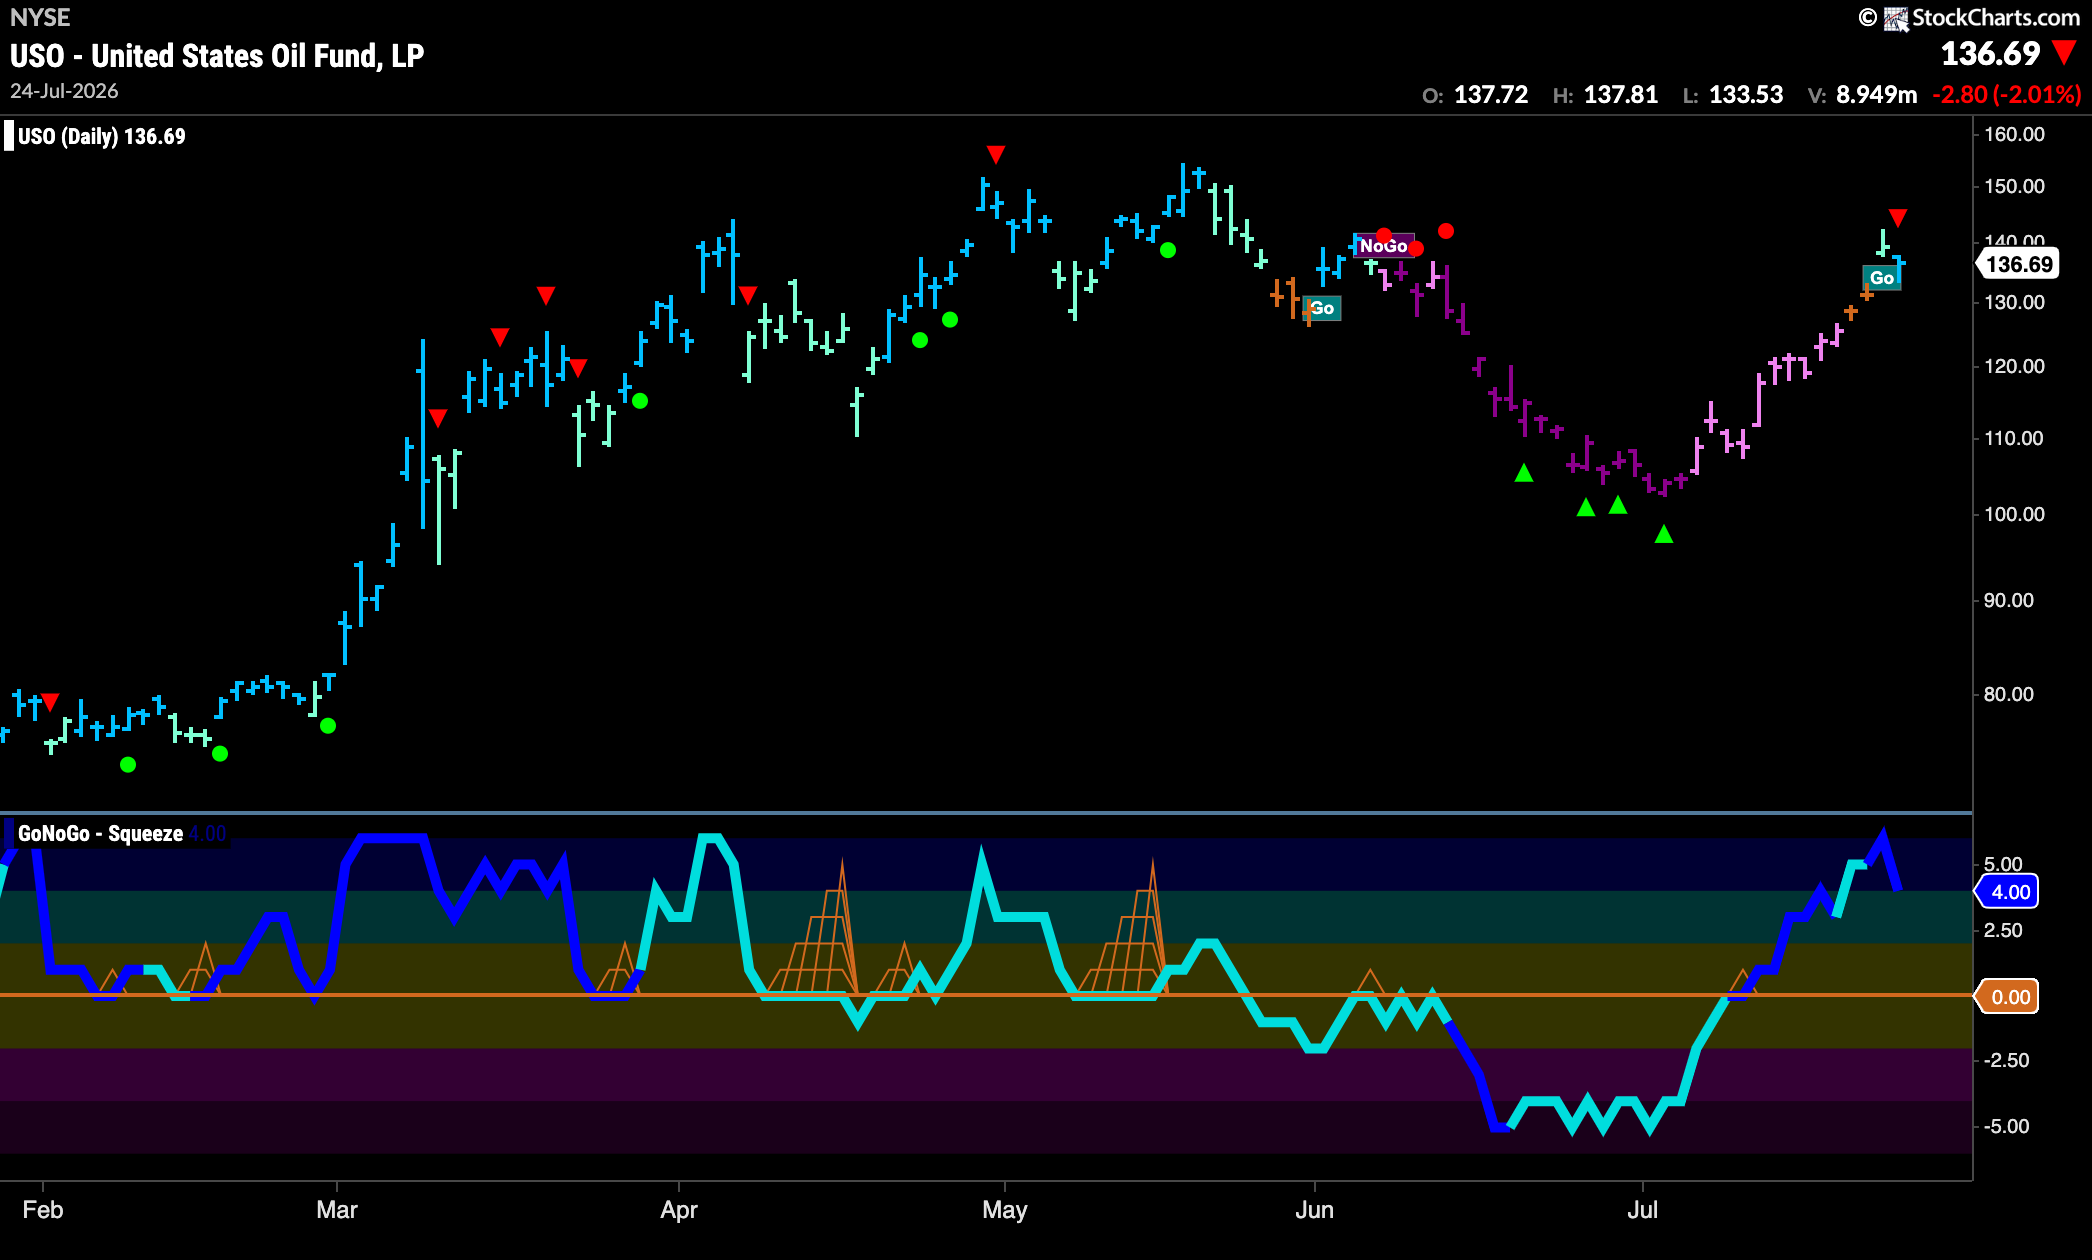
New “Go” Trend for Oil ($USO)
GoNoGo Trend shows that there has been a change in trend this week and the indicator paints new “Go” bars. After a couple of amber “Go Fish” bars we saw an aqua bar followed by a strong “Go” bar as price pushes higher. GoNoGo Oscillator has fallen out of overbought territory and volume is heavy. With momentum positive, we will watch to see if price can push to higher highs.
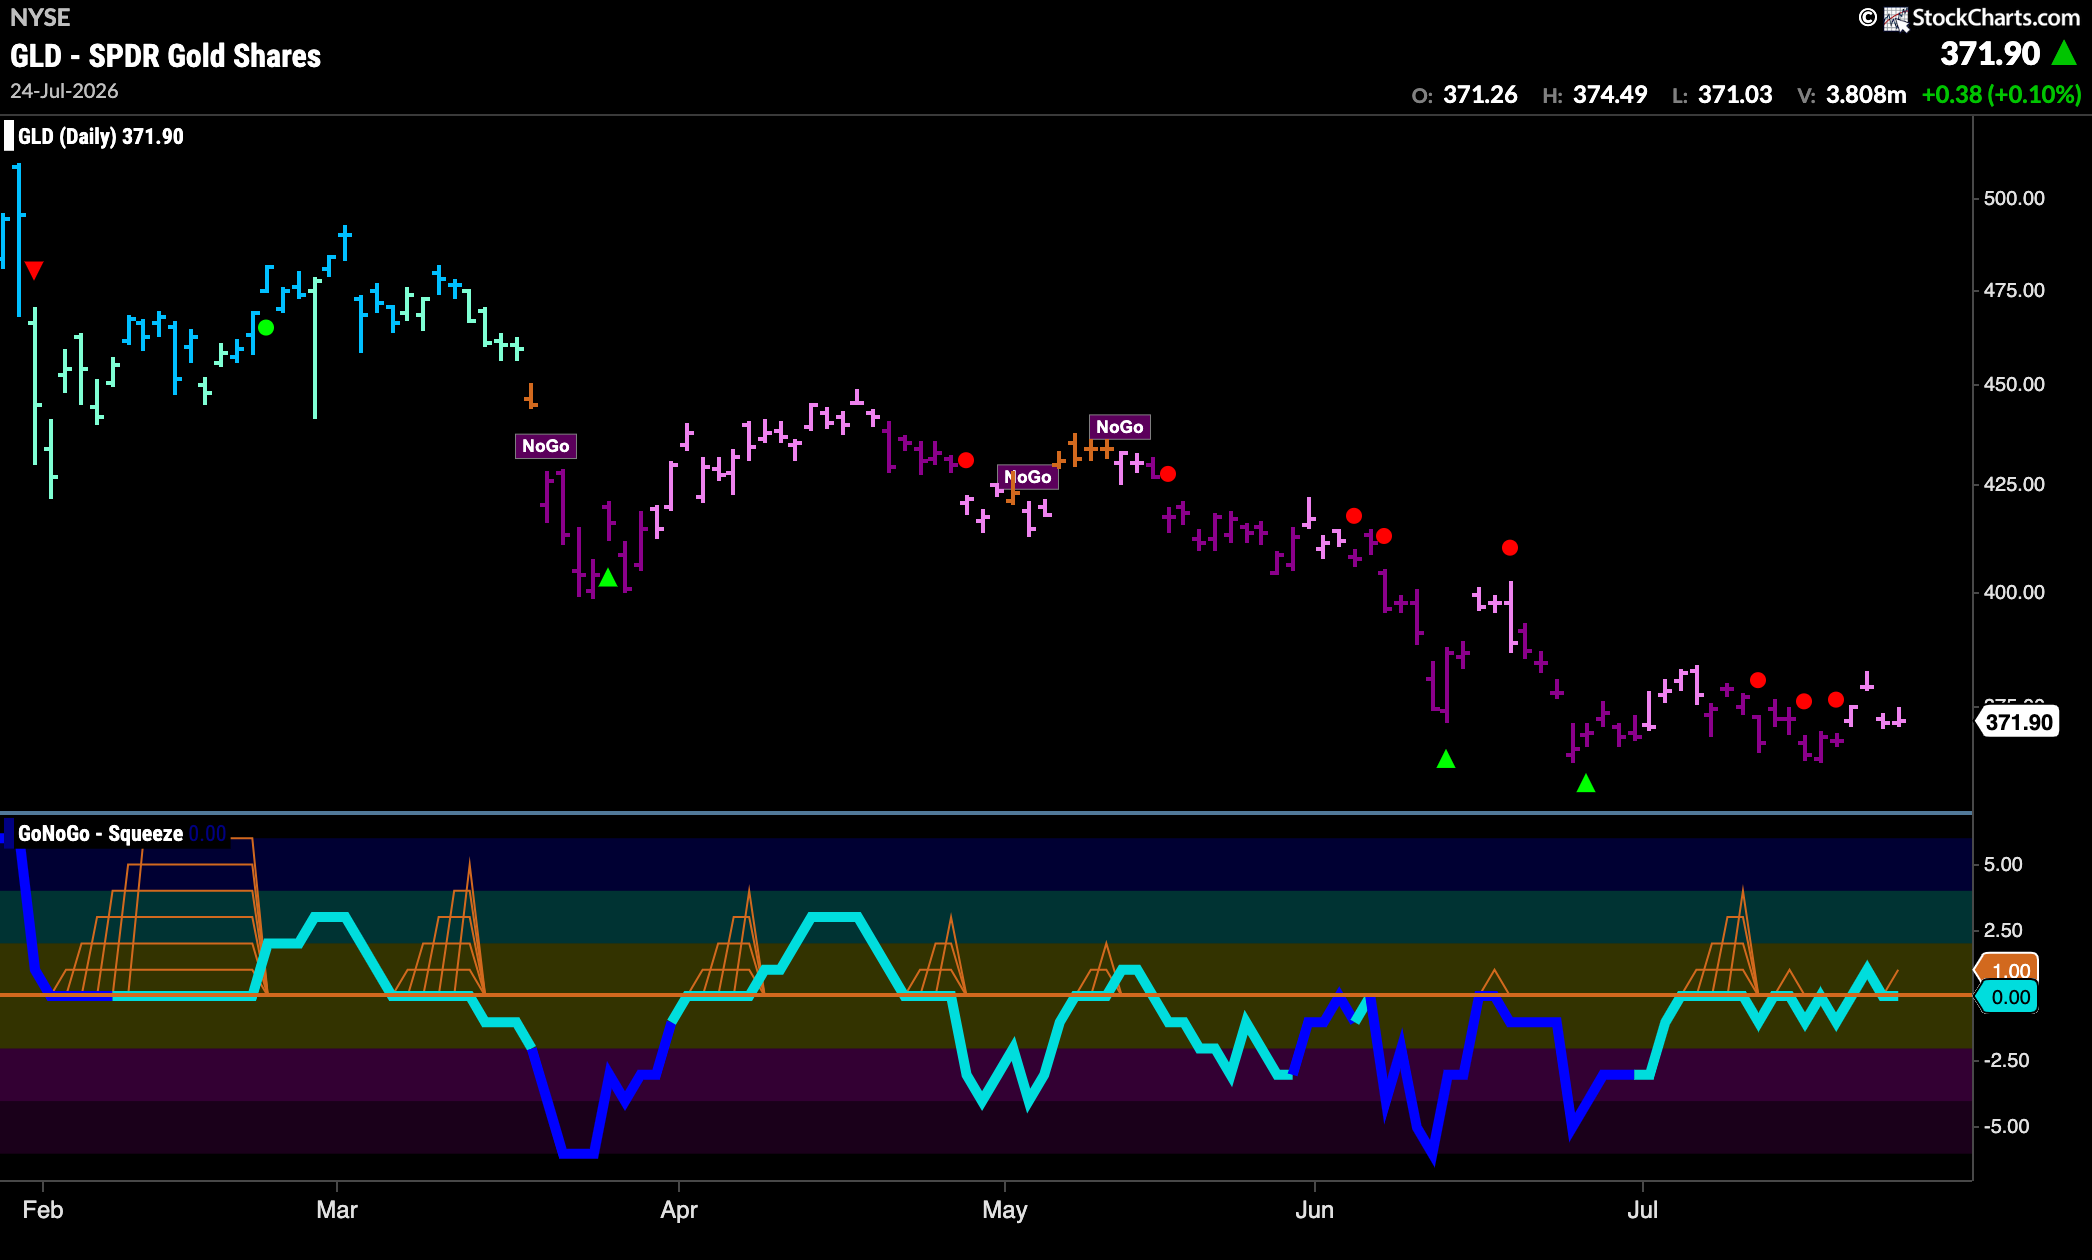
Gold ($GLD) “NoGo” Remains with Pink Bars
The “NoGo” trend continues for gold as we see pink bars for most of the week. Price was unable to make a new low and as yet has not made a new high. GoNoGo Oscillator is at the zero line having struggled to move away from that level in any direction. We will watch to see in which way the oscillator moves in the coming days.
Sector RelMap
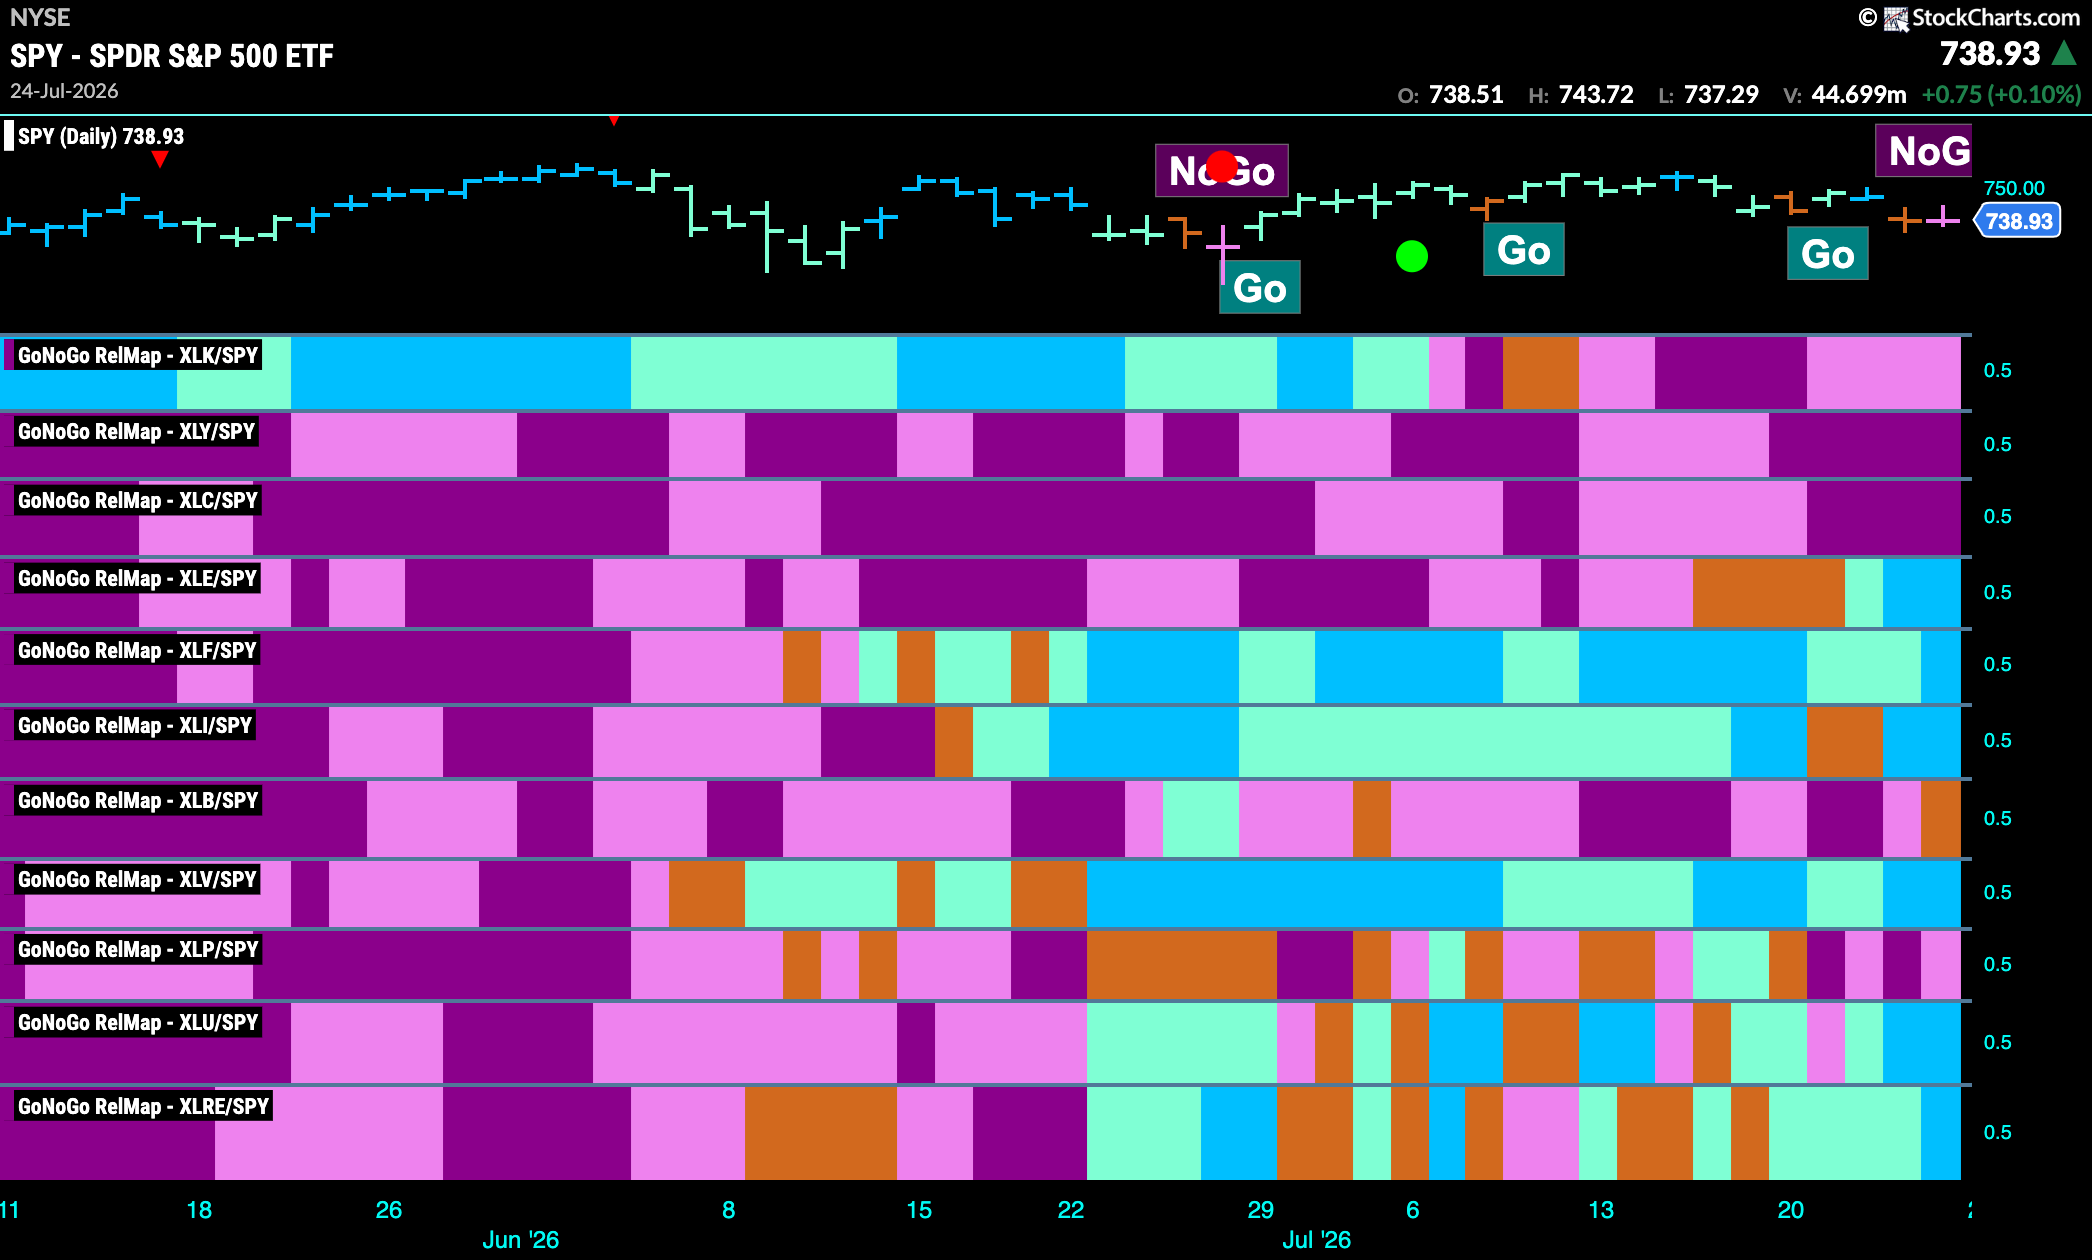
Below is the GoNoGo Sector RelMap. This GoNoGo RelMap applies the GoNoGo Trend to the relative strength ratios of the sectors to the base index. With this view we can get a sense of the relative out performance and relative underperformance of the sectors. 6 sectors are in a relative “Go” trend. $XLE, $XLF, $XLI, $XLV, $XLU, and $XLRE are painting blue relative “Go” bars.
Energy Sub-Group RelMap
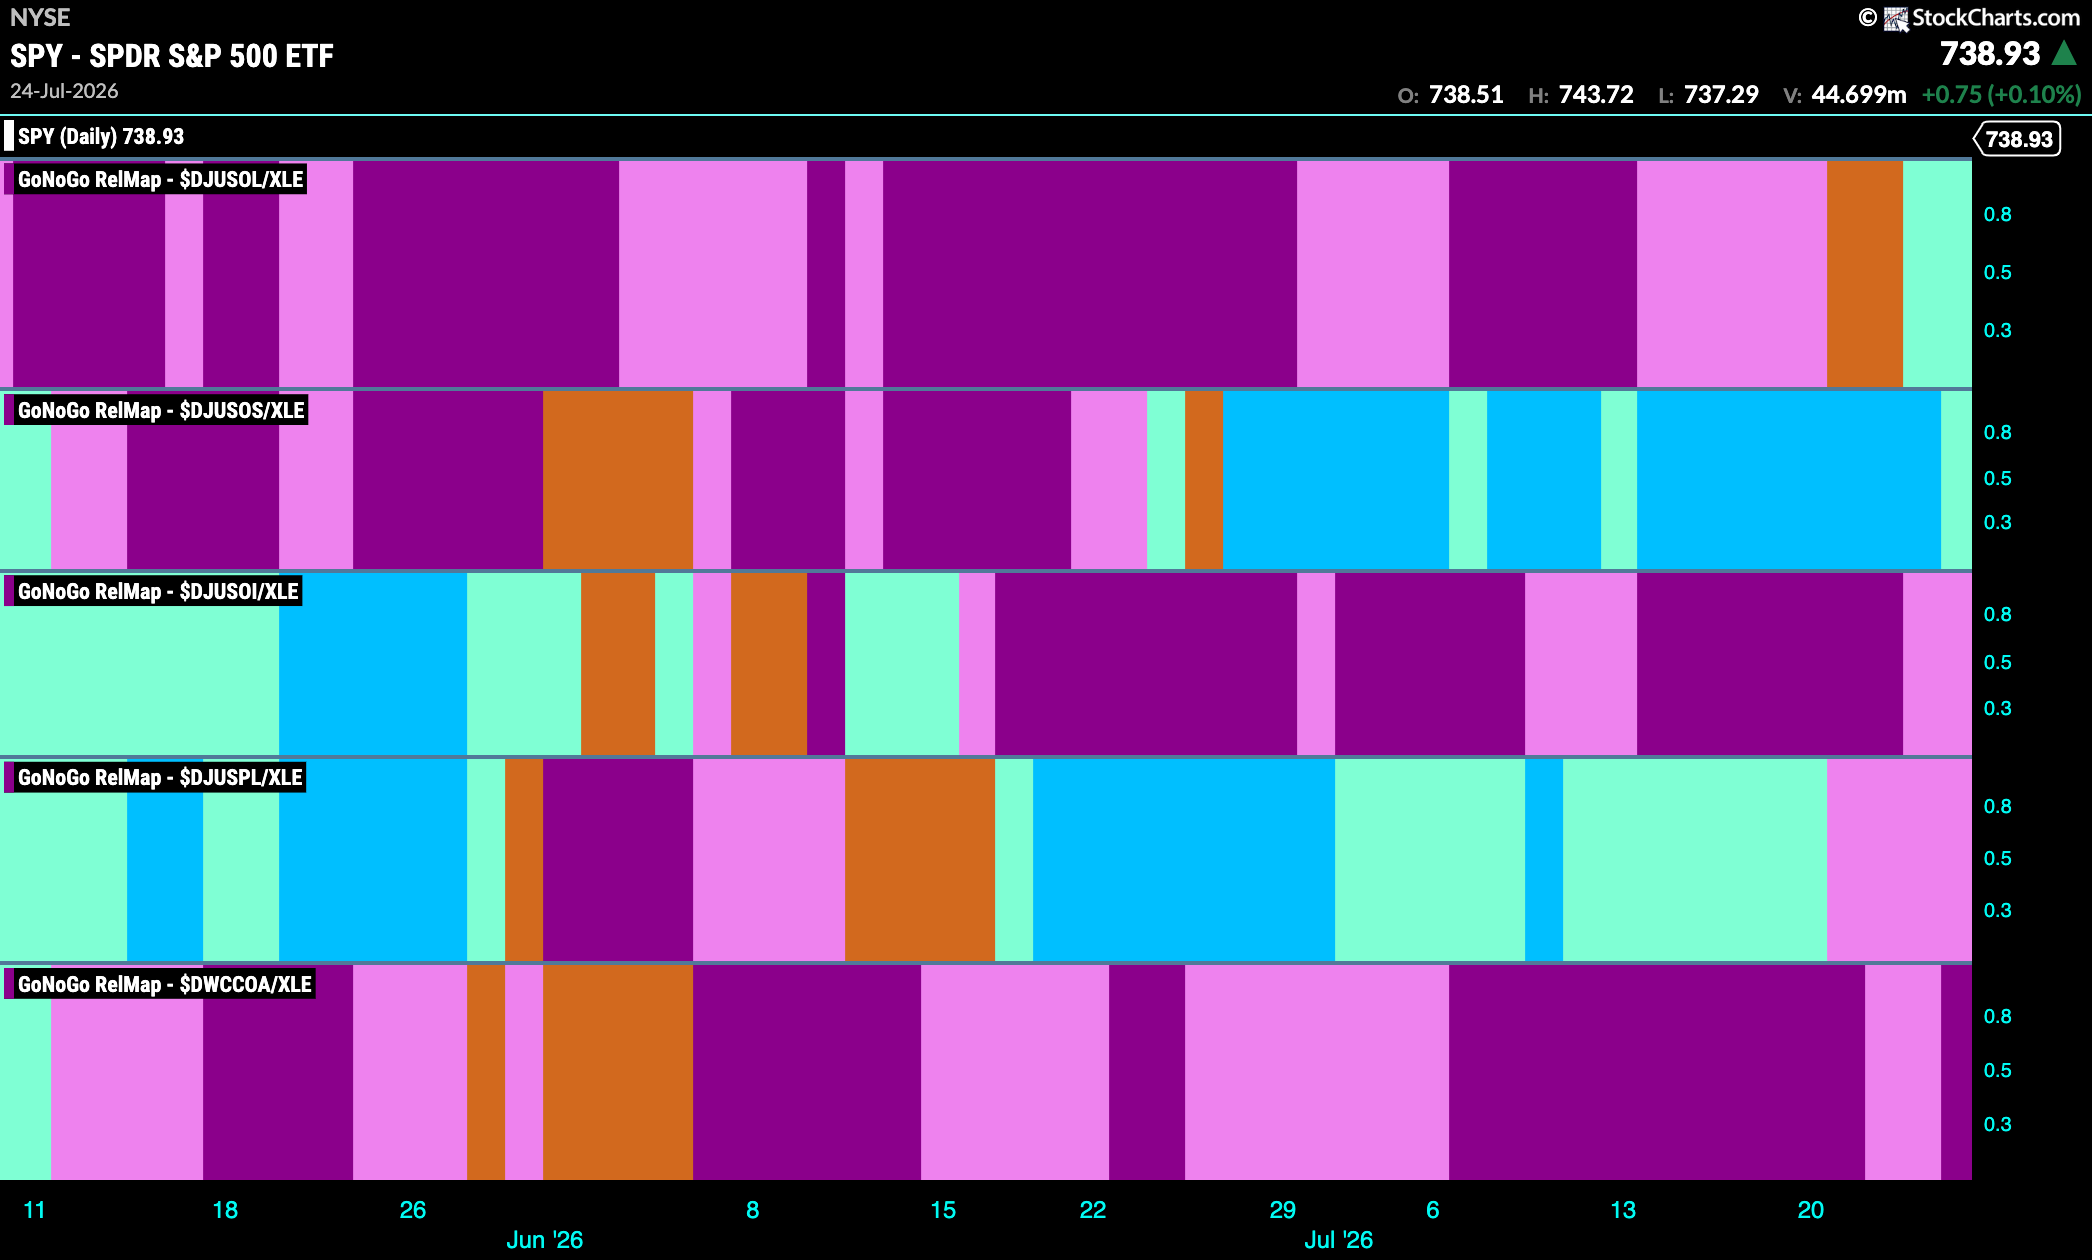
The chart below shows a relative trend breakdown of the sub groups within the healthcare sector this week. The Sub-Group RelMap plots the GoNoGo Trend of each sub index to the $XLV. We saw in the above GoNoGo Sector HeatMap that $XLE is painting relative “Go” bars. When we look at the below RelMap we can see that the integrated oil or gas index in the 1st panel is painting new aqua “Go” bars on a relative basis.
$REPYY in “Go” Trend at New Highs
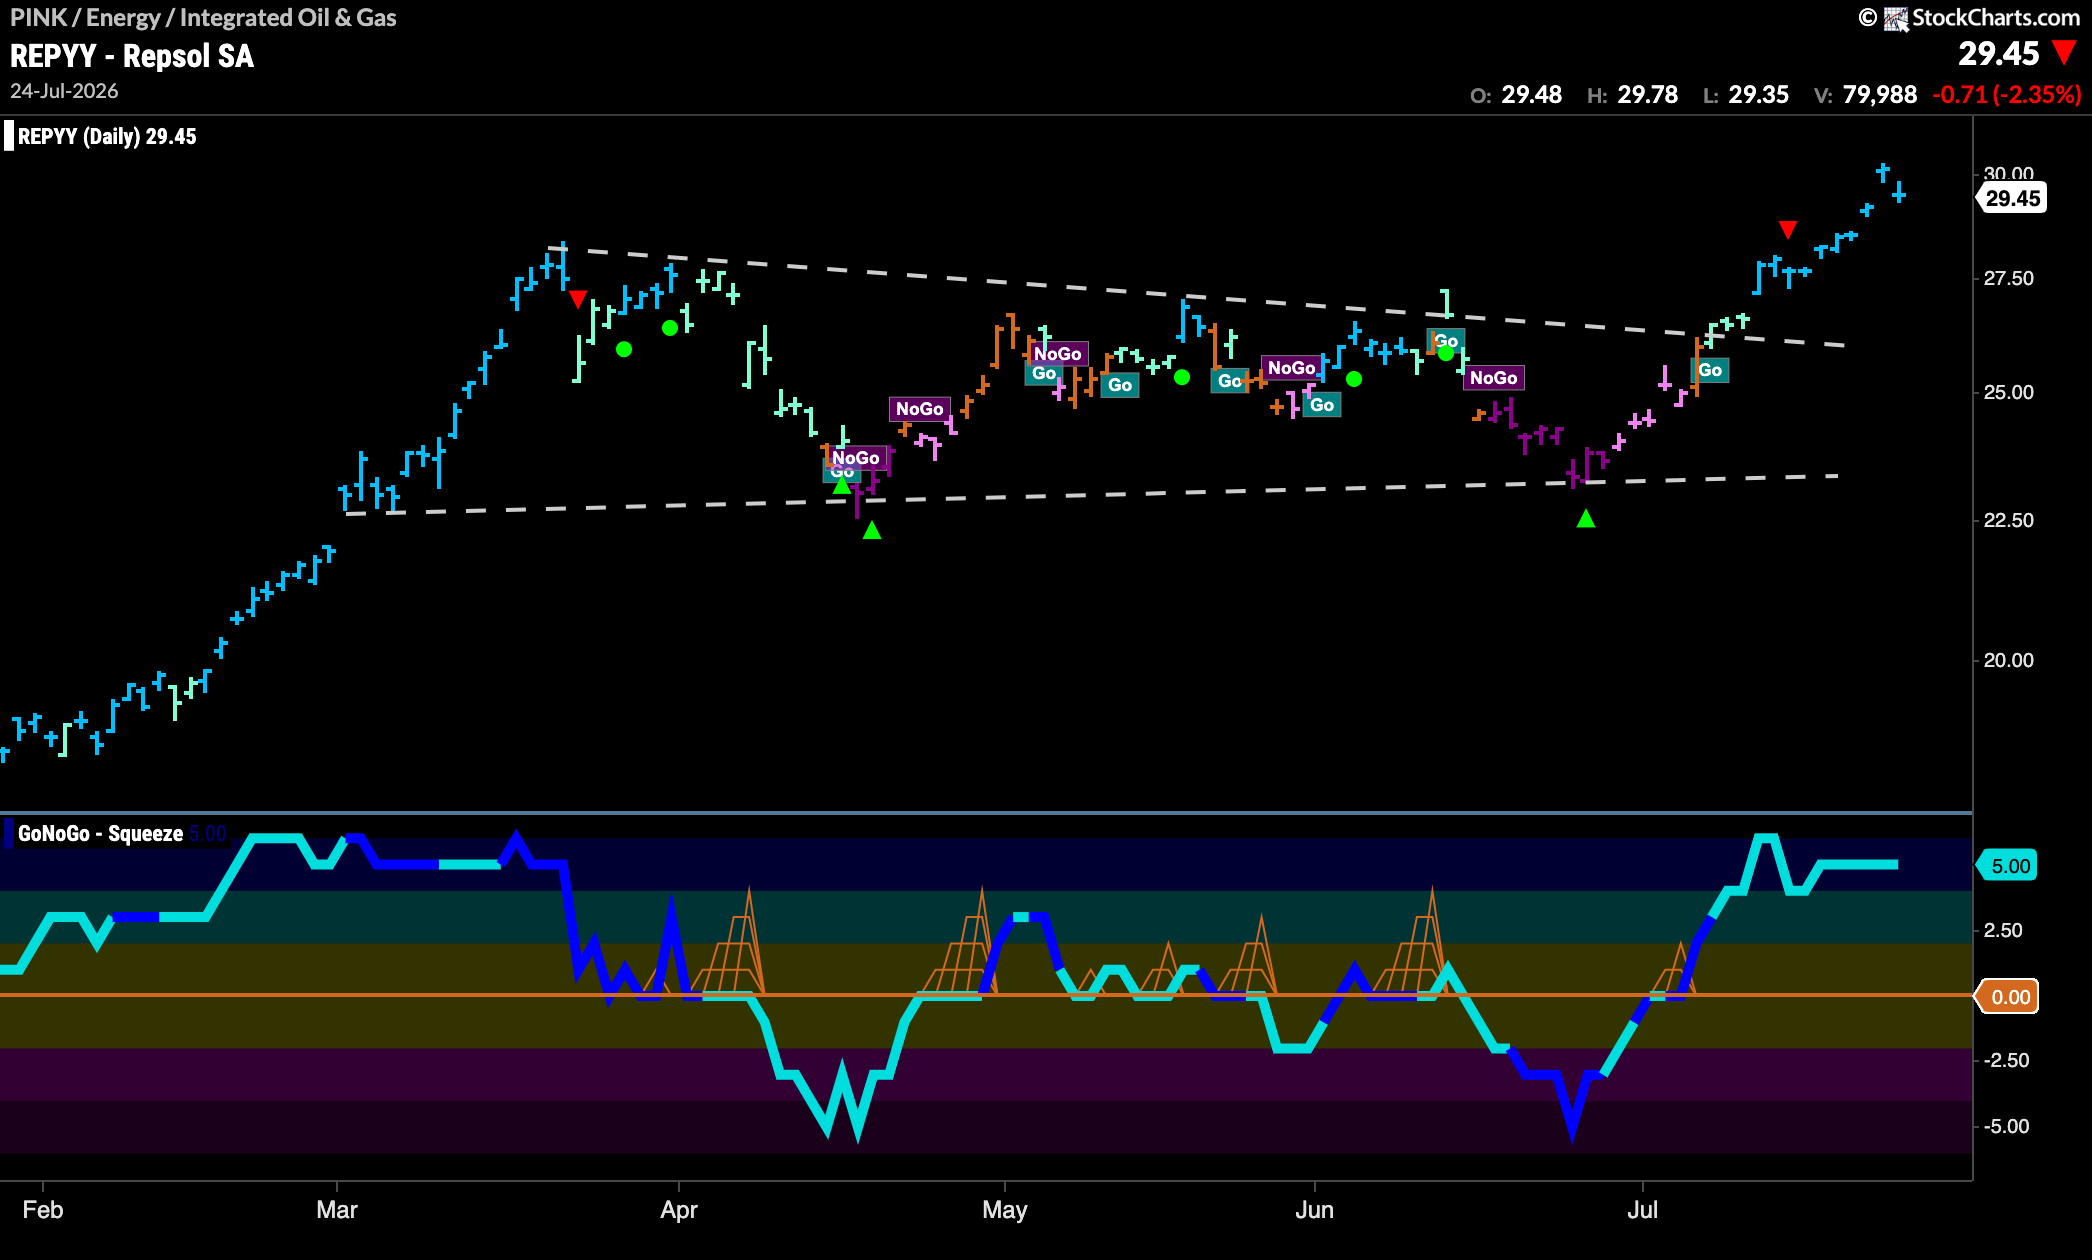
The GoNoGo Chart below shows that price has been in a “Go” trend and has made higher highs recently. We will watch to see if price can consolidate at these levels and find support going forward at prior highs if necessary. GoNoGo Oscillator remains in overbought territory at a value of 5. We will watch to see if the market can maintain this momentum.
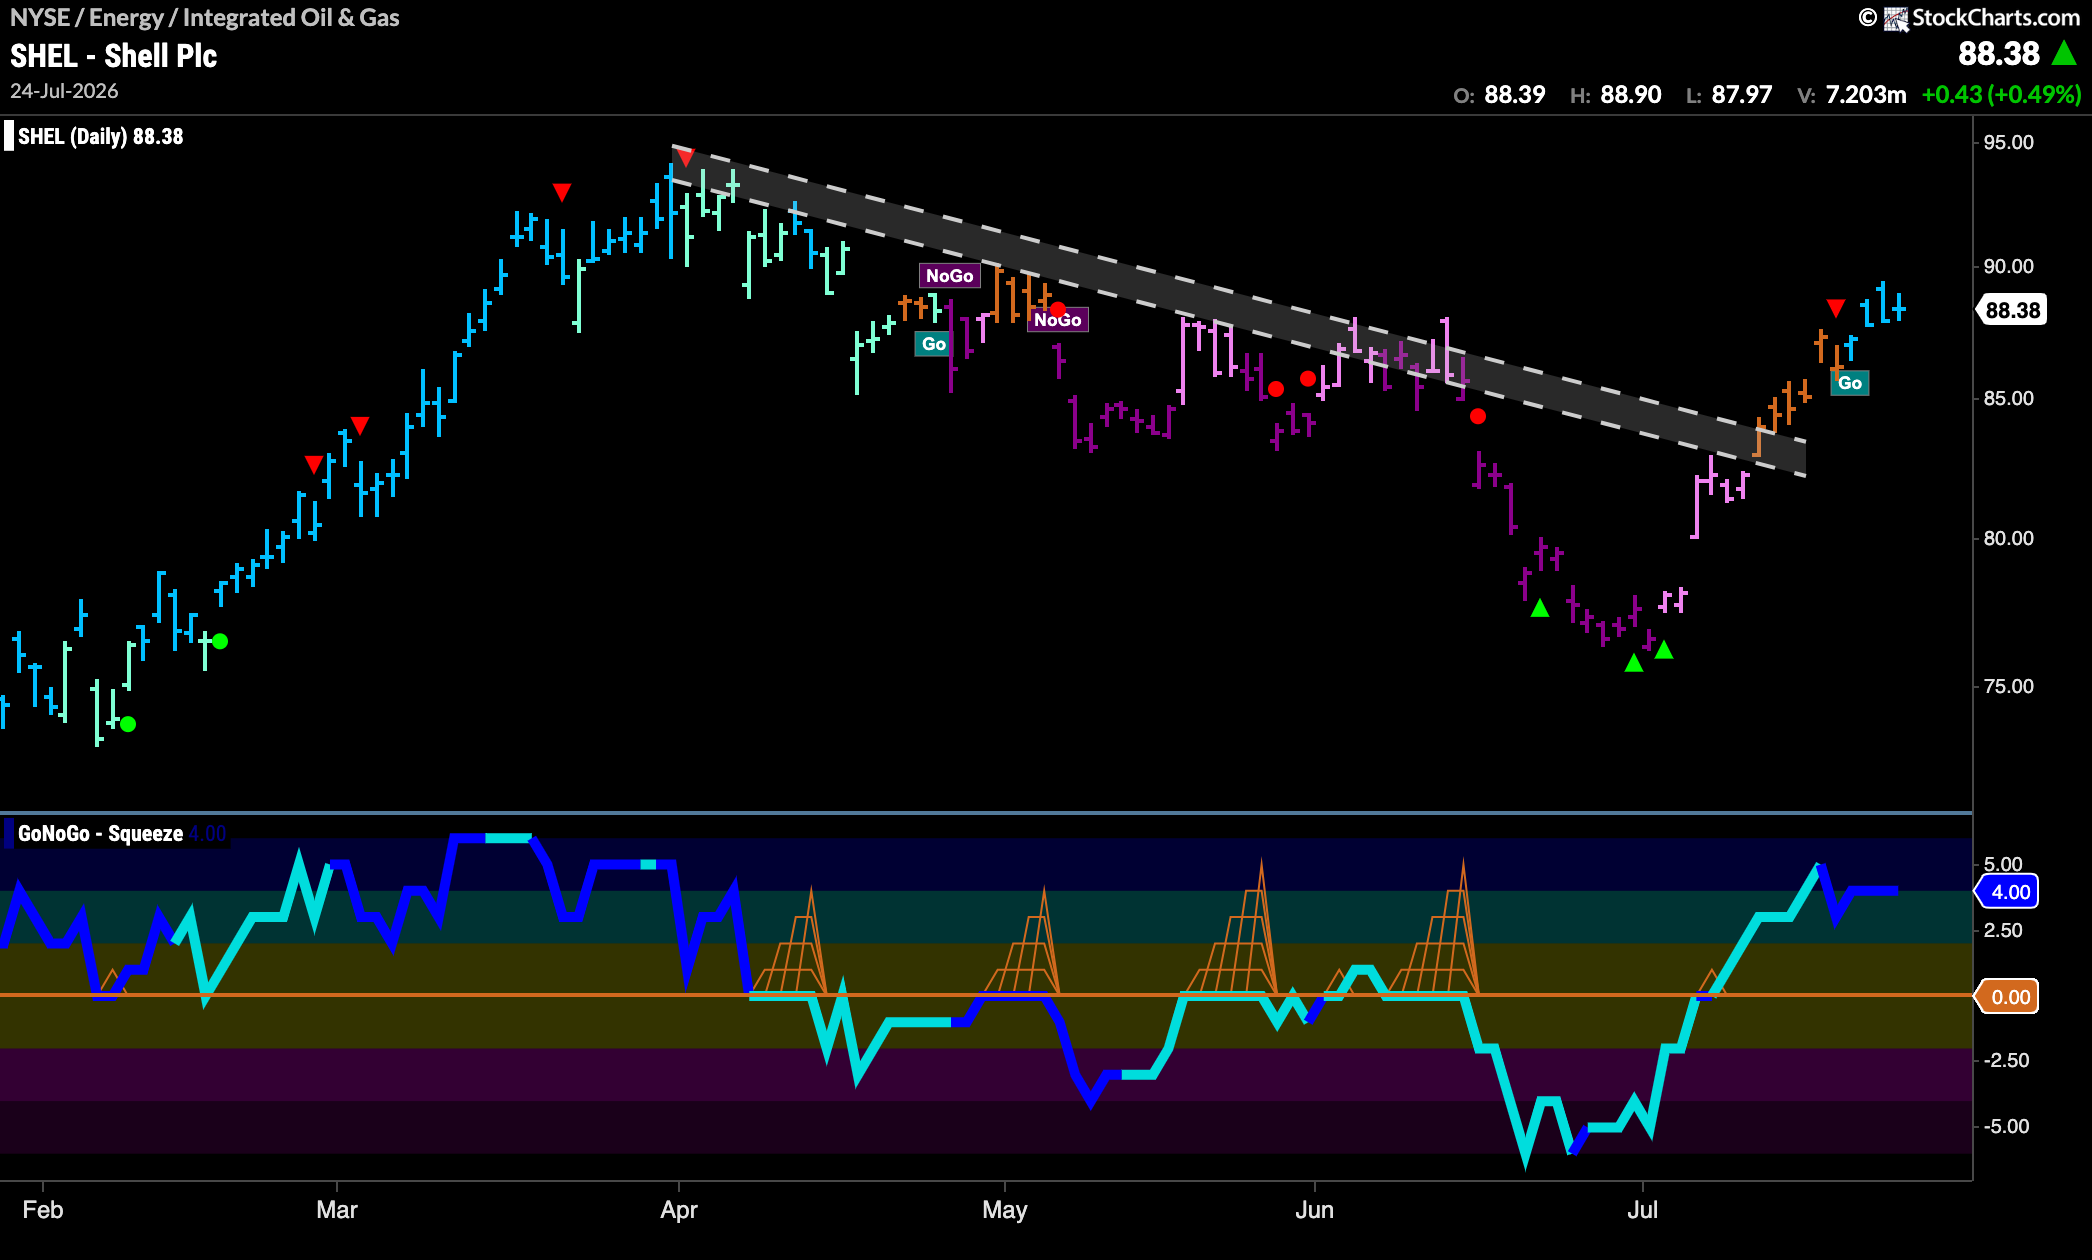
$SHEL Enters Strong “Go” Trend
The chart below shows that $SHEL entered a “Go” trend last week as price rallied out of a period of uncertainty represented by a string of amber “Go Fish” bars. We can see that momentum has remained in positive territory and heavy volume appears to confirm the new trend in price. We will watch to see if price can consolidate at these higher levels before perhaps continuing higher in the coming days.