Good morning and welcome to this week’s Flight Path. The equity trend remained this week as we saw the new “Go” trend strengthen with a week of uninterrupted bright blue bars. Treasury bond prices fell into a weaker trend as the indicator painted weaker pink “NoGo” bars. U.S. commodity prices remained in a “Go” trend and on the final bar of the week we saw strength return as GoNoGo Trend painted a strong blue bar. The dollar saw the new “NoGo” trend continue and the indicator painted consecutive purple bars as the week ended.
$SPY Soared to new Highs in “Go” Trend
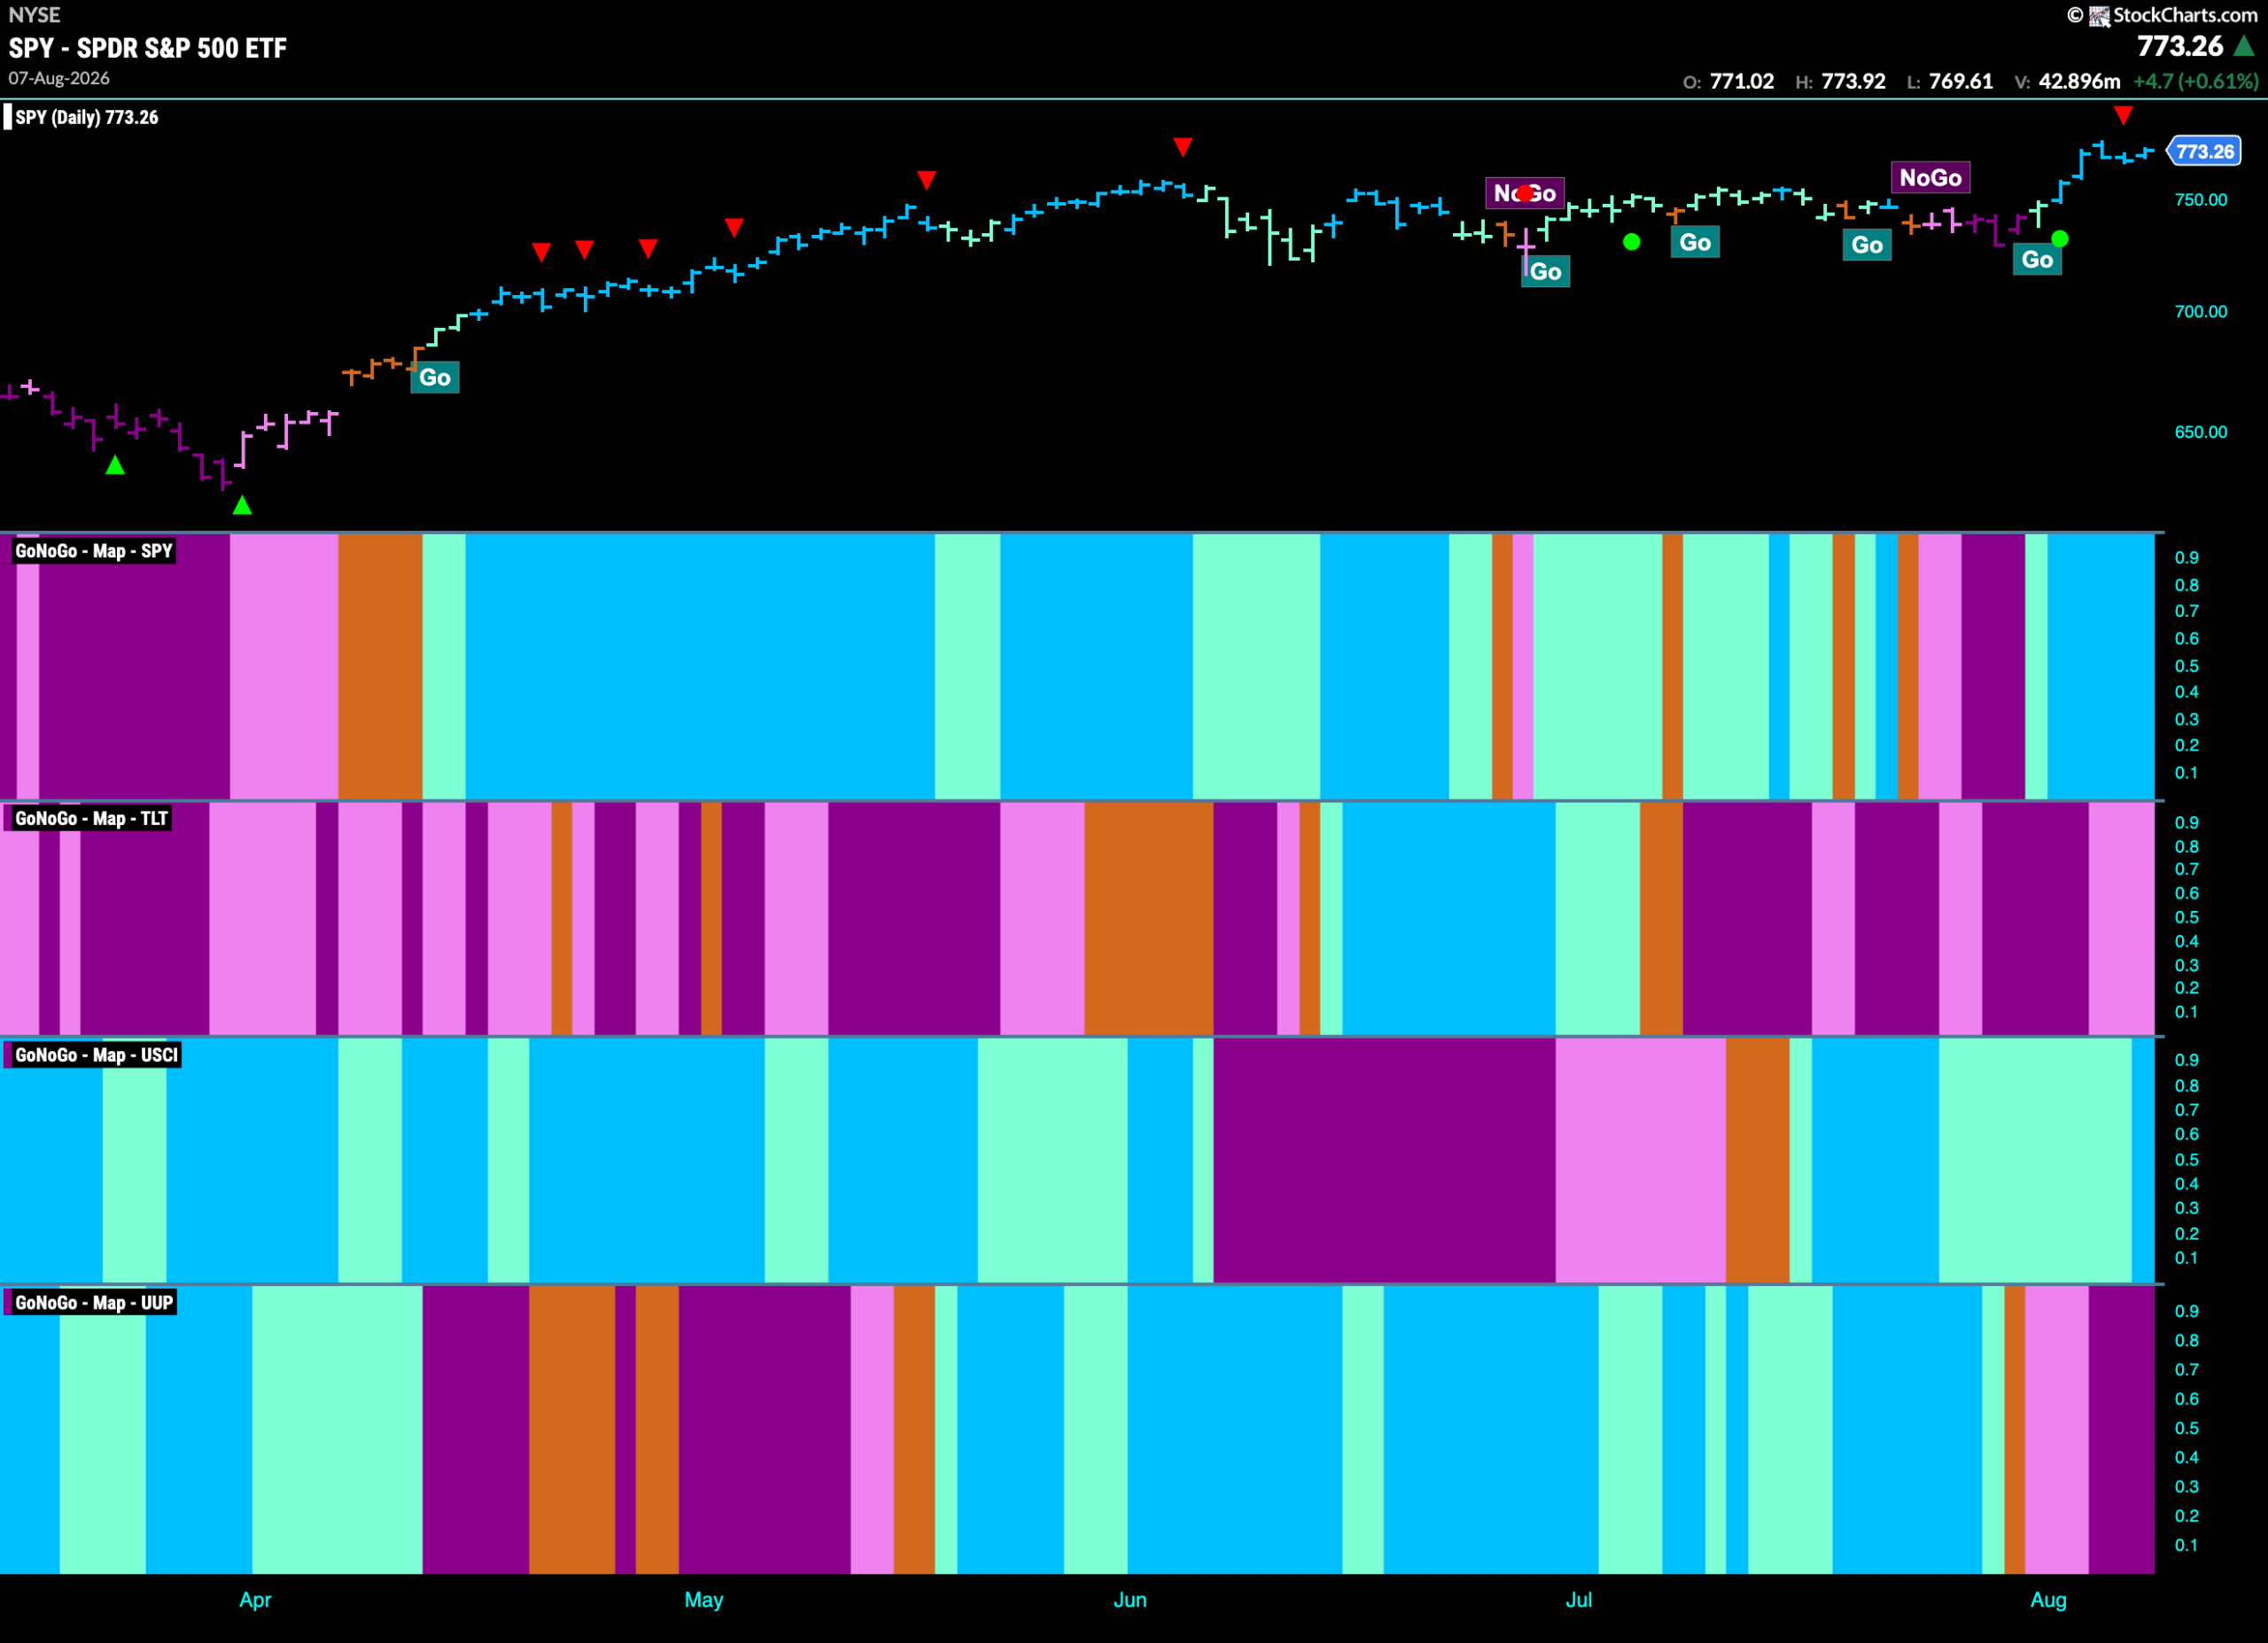
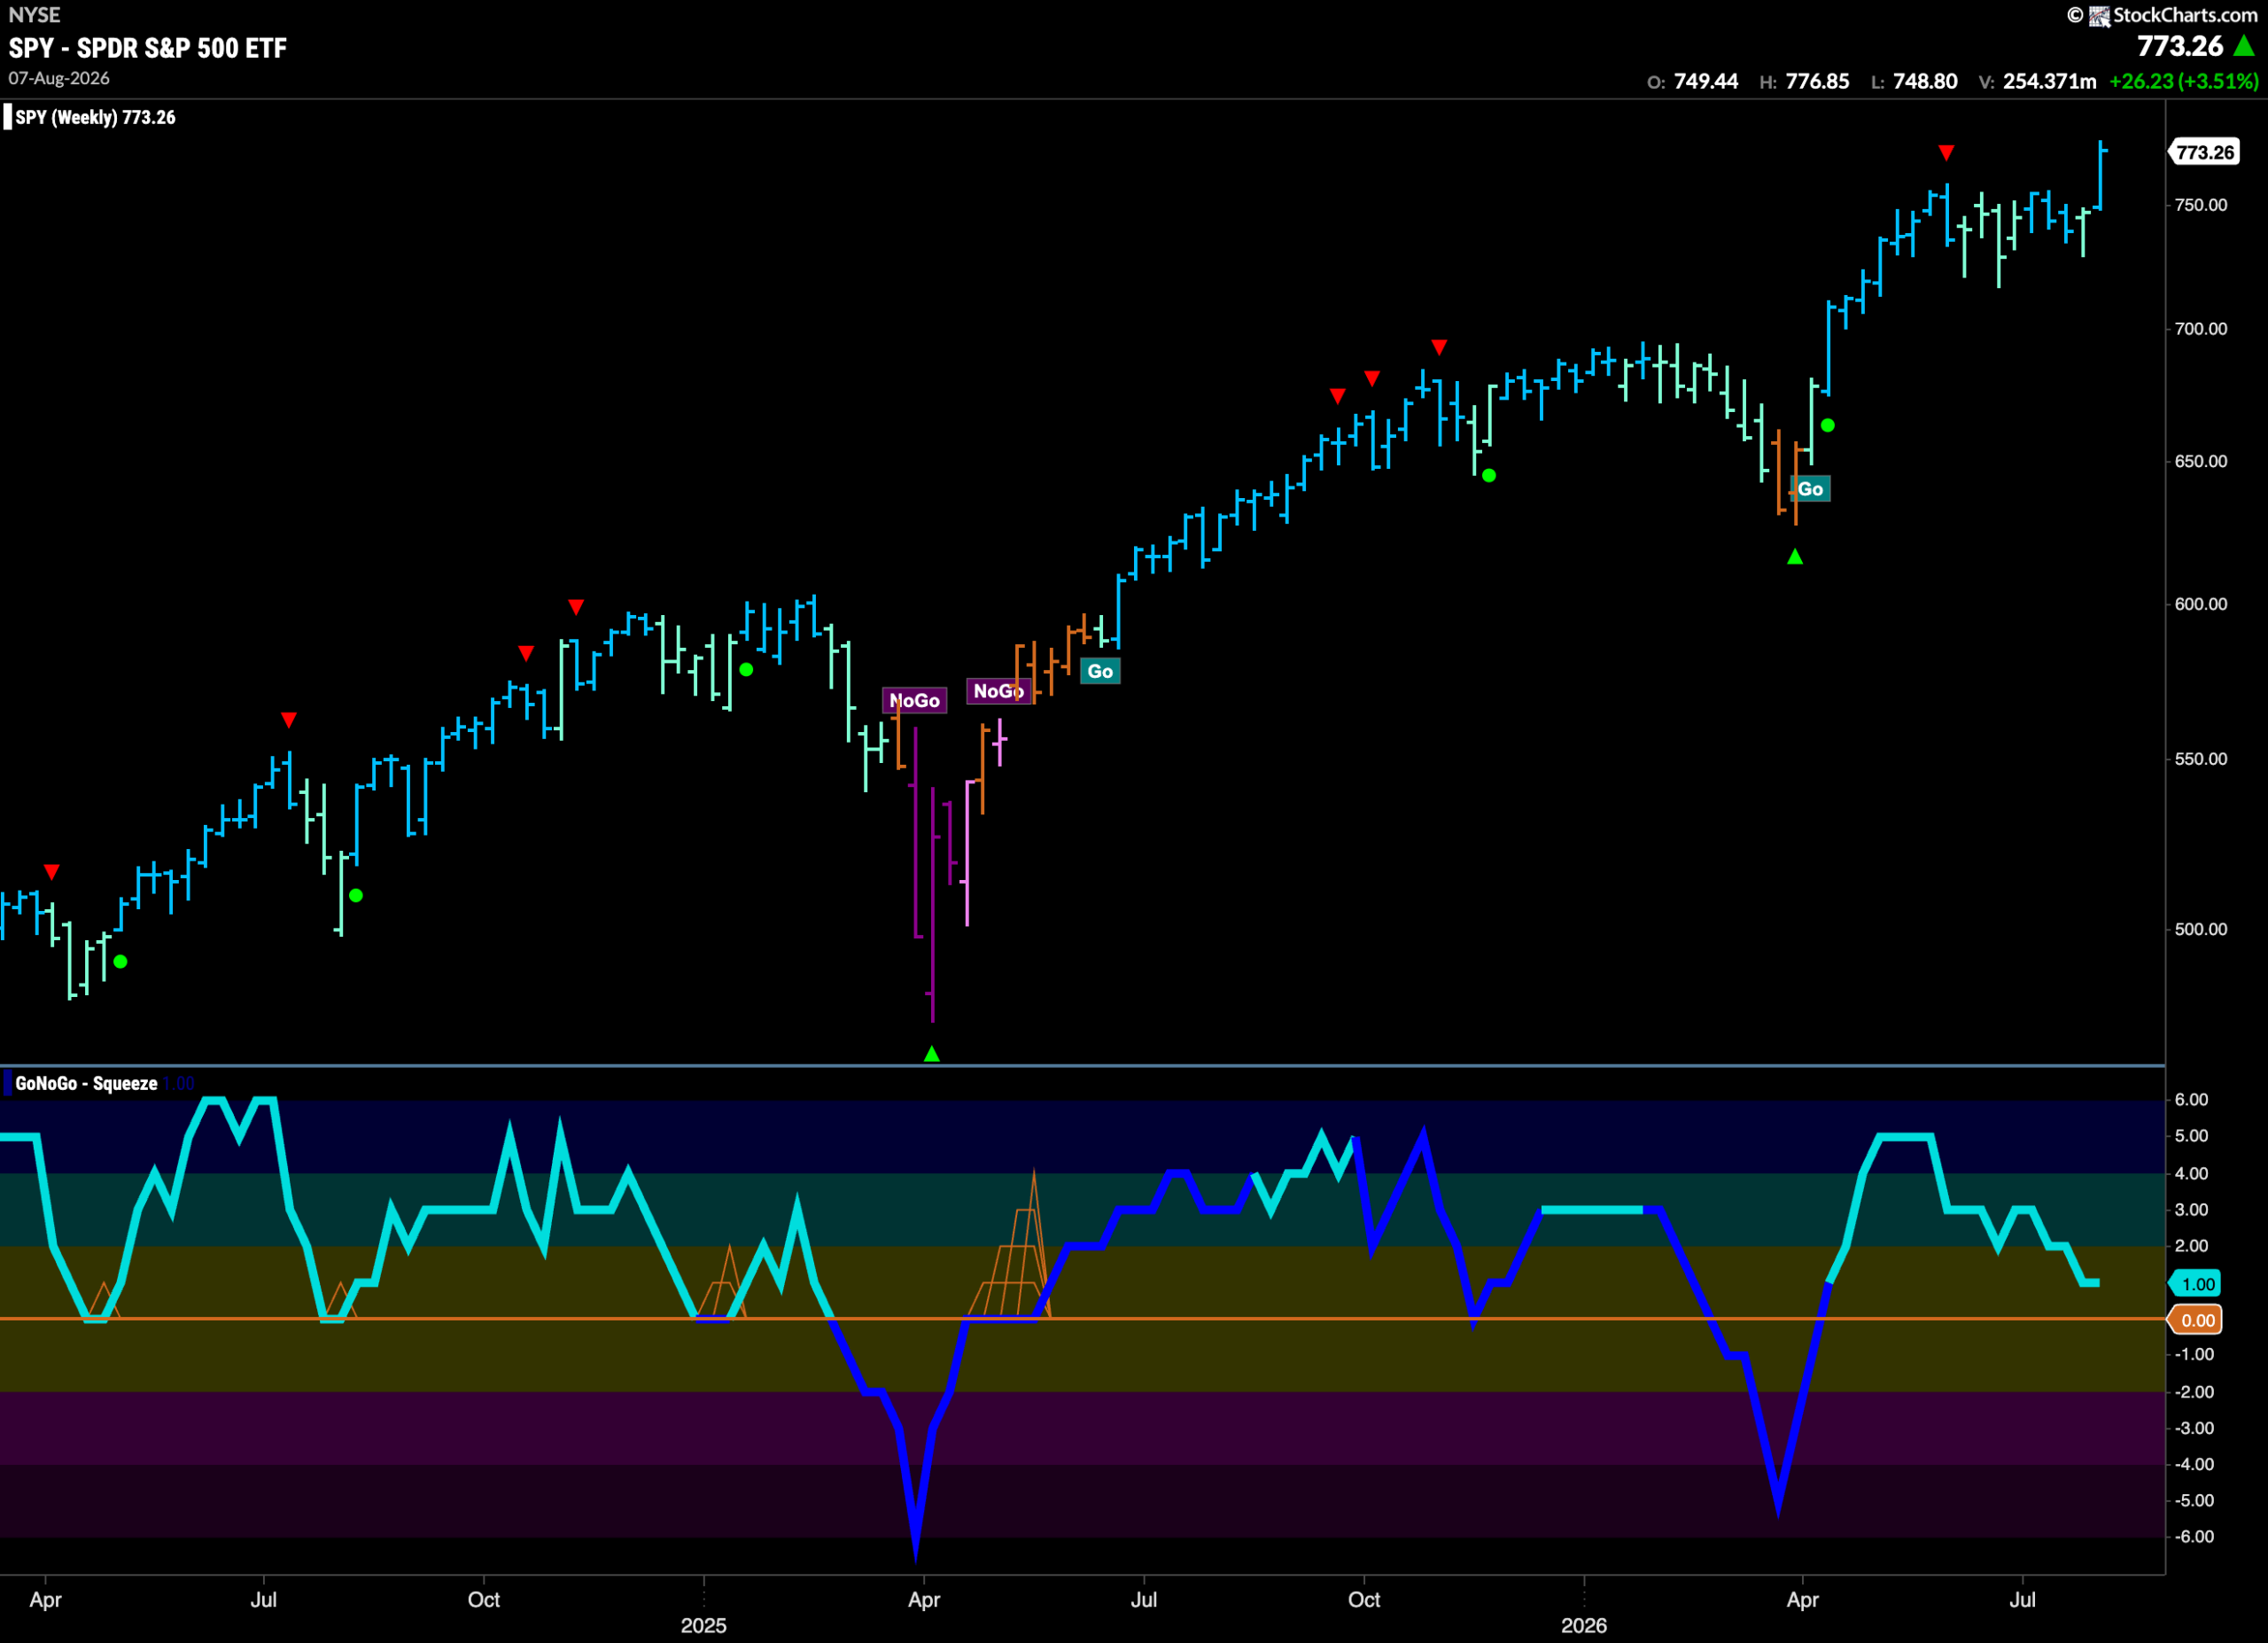
The GoNoGo chart below shows that the new “Go” trend strengthened quickly this past week as after a single aqua bar we saw strong blue bars as price climbed to new all time highs. Now we see a Go Countertrend Correction Icon (red arrow) that could signal price may struggle to go higher in the short term due to waning momentum. If we look at the lower panel, we see that GoNoGo Oscillator has fallen out of overbought territory and is now at a value of 4 with heavy volume.
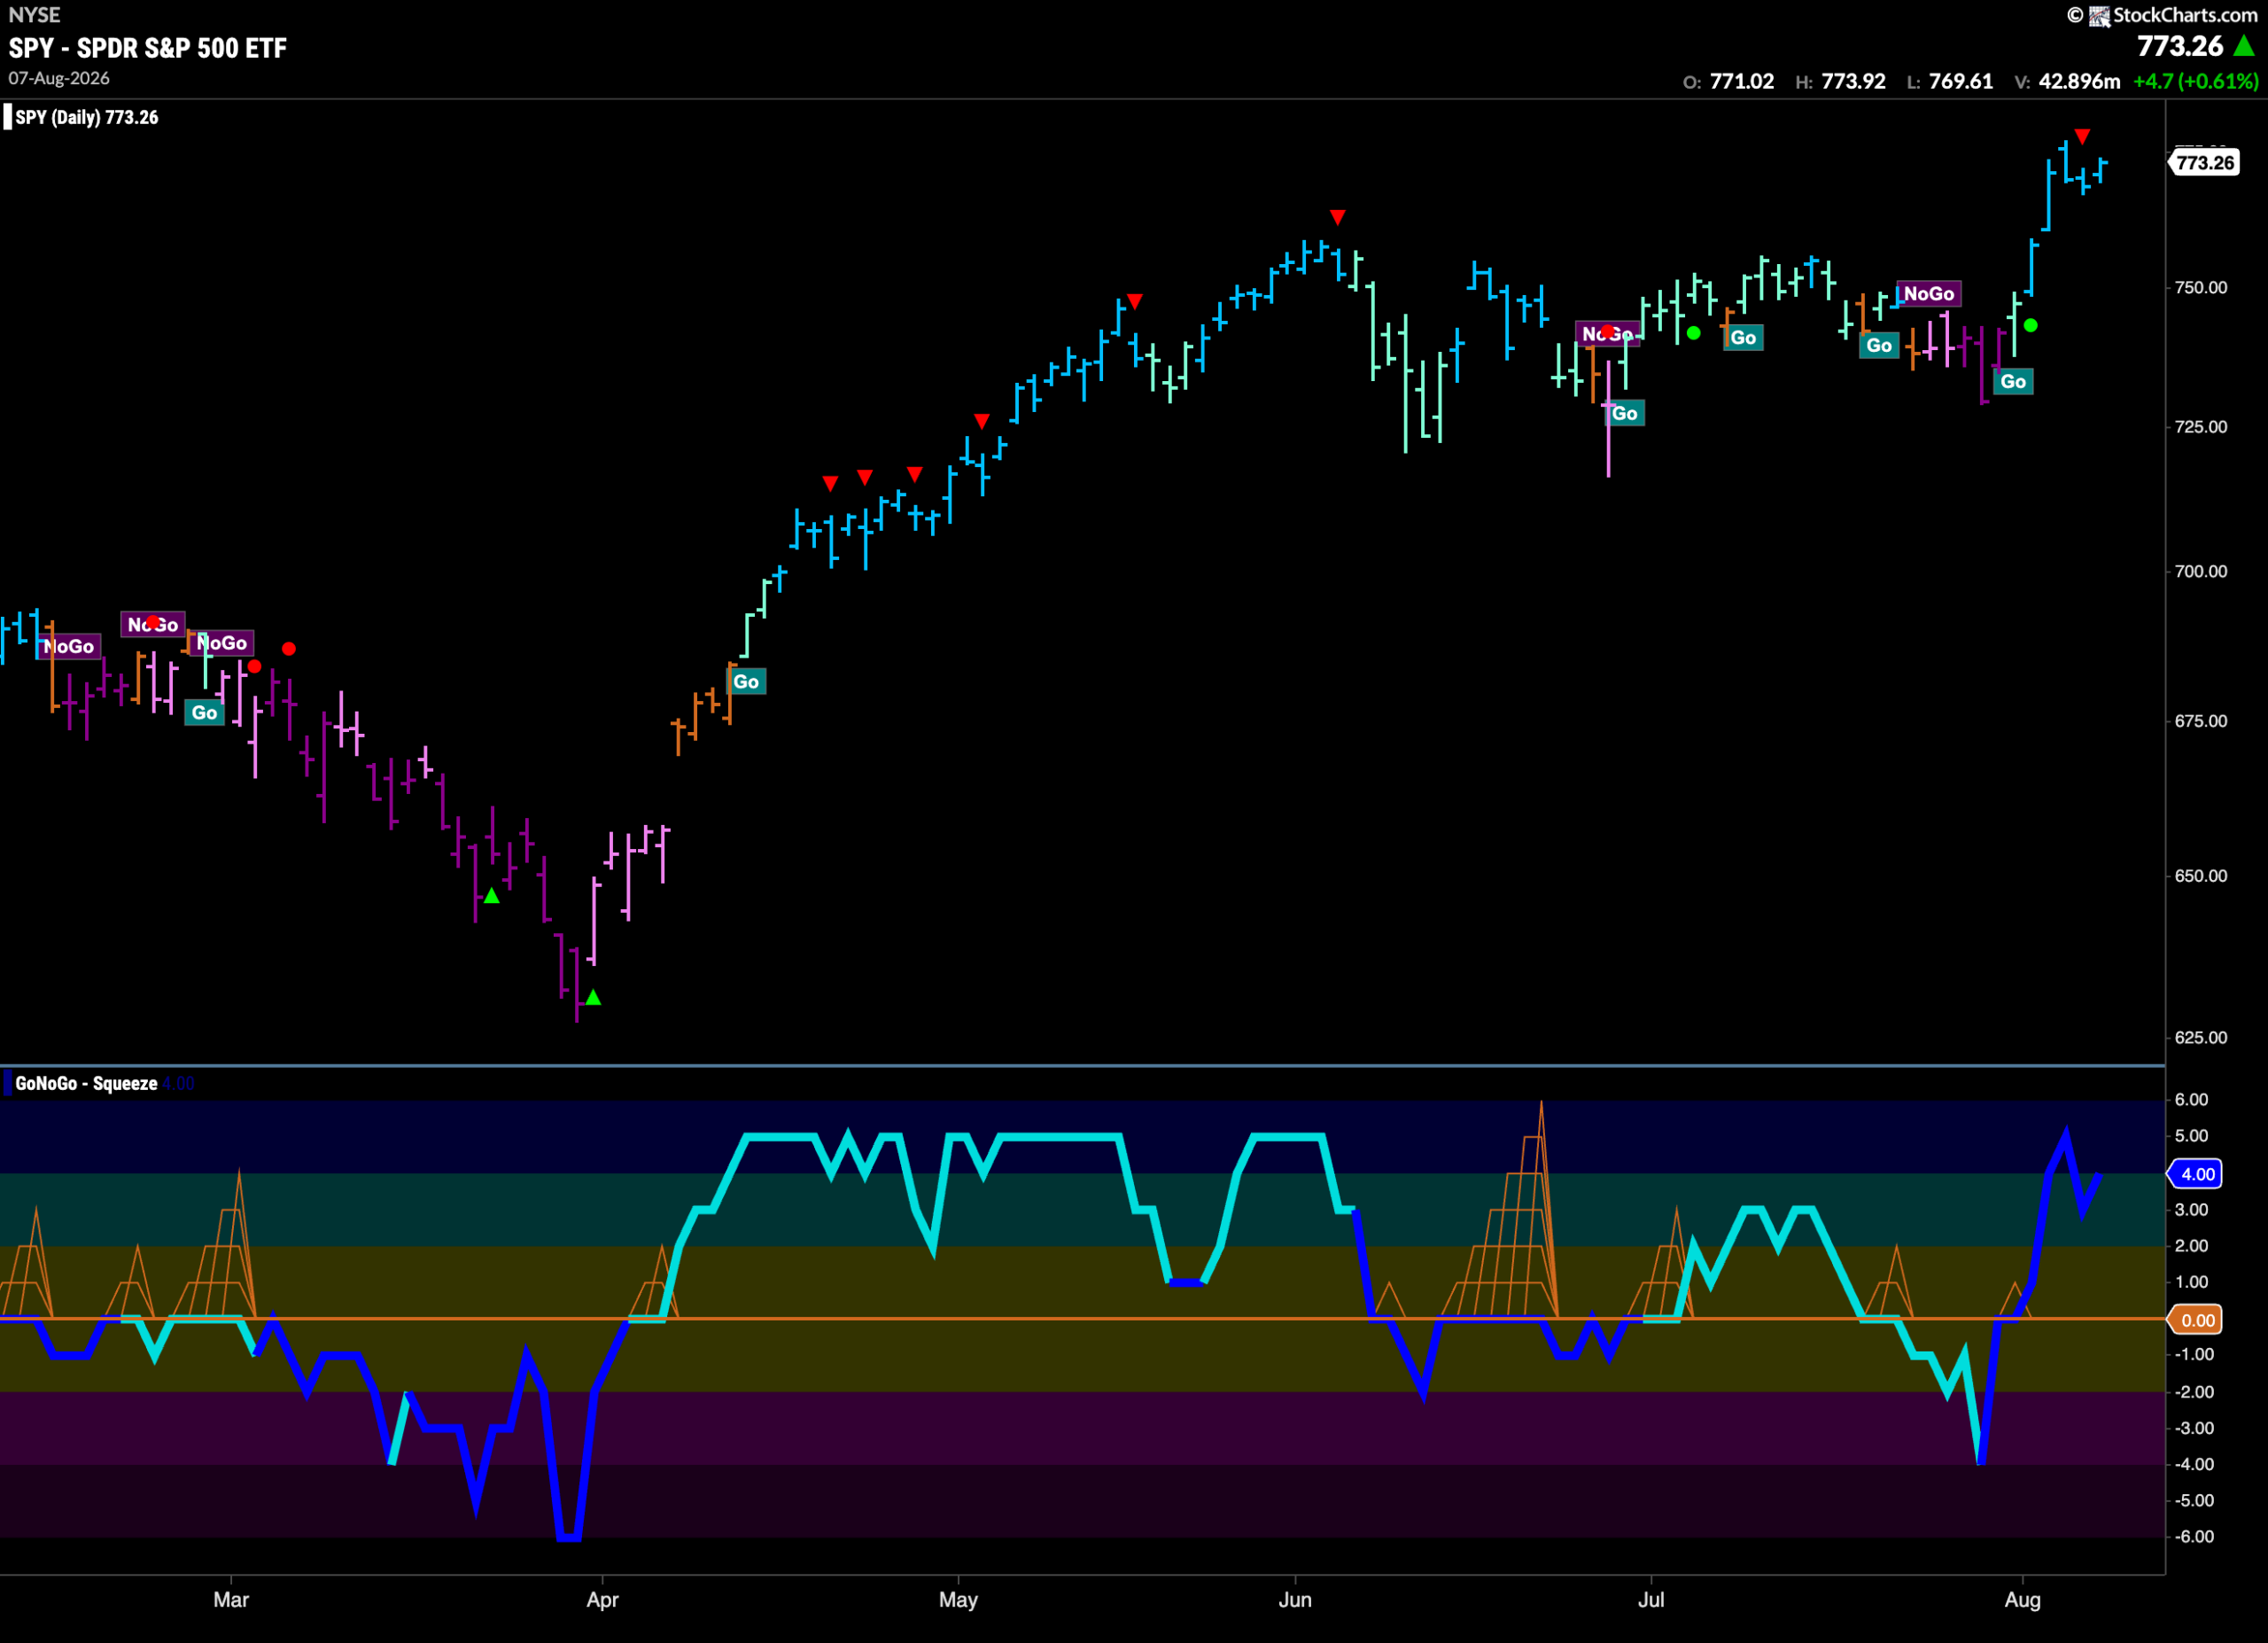
The weekly chart shows that the “Go” trend continues and this past week saw price climb to a new higher high on a fresh bright blue bar. GoNoGo Oscillator is still in positive territory but has approached the zero line. We will watch to see if it finds support should it get to that level in the coming weeks.
Treasury Rates Remain in “Go” Trend Amid Weakness
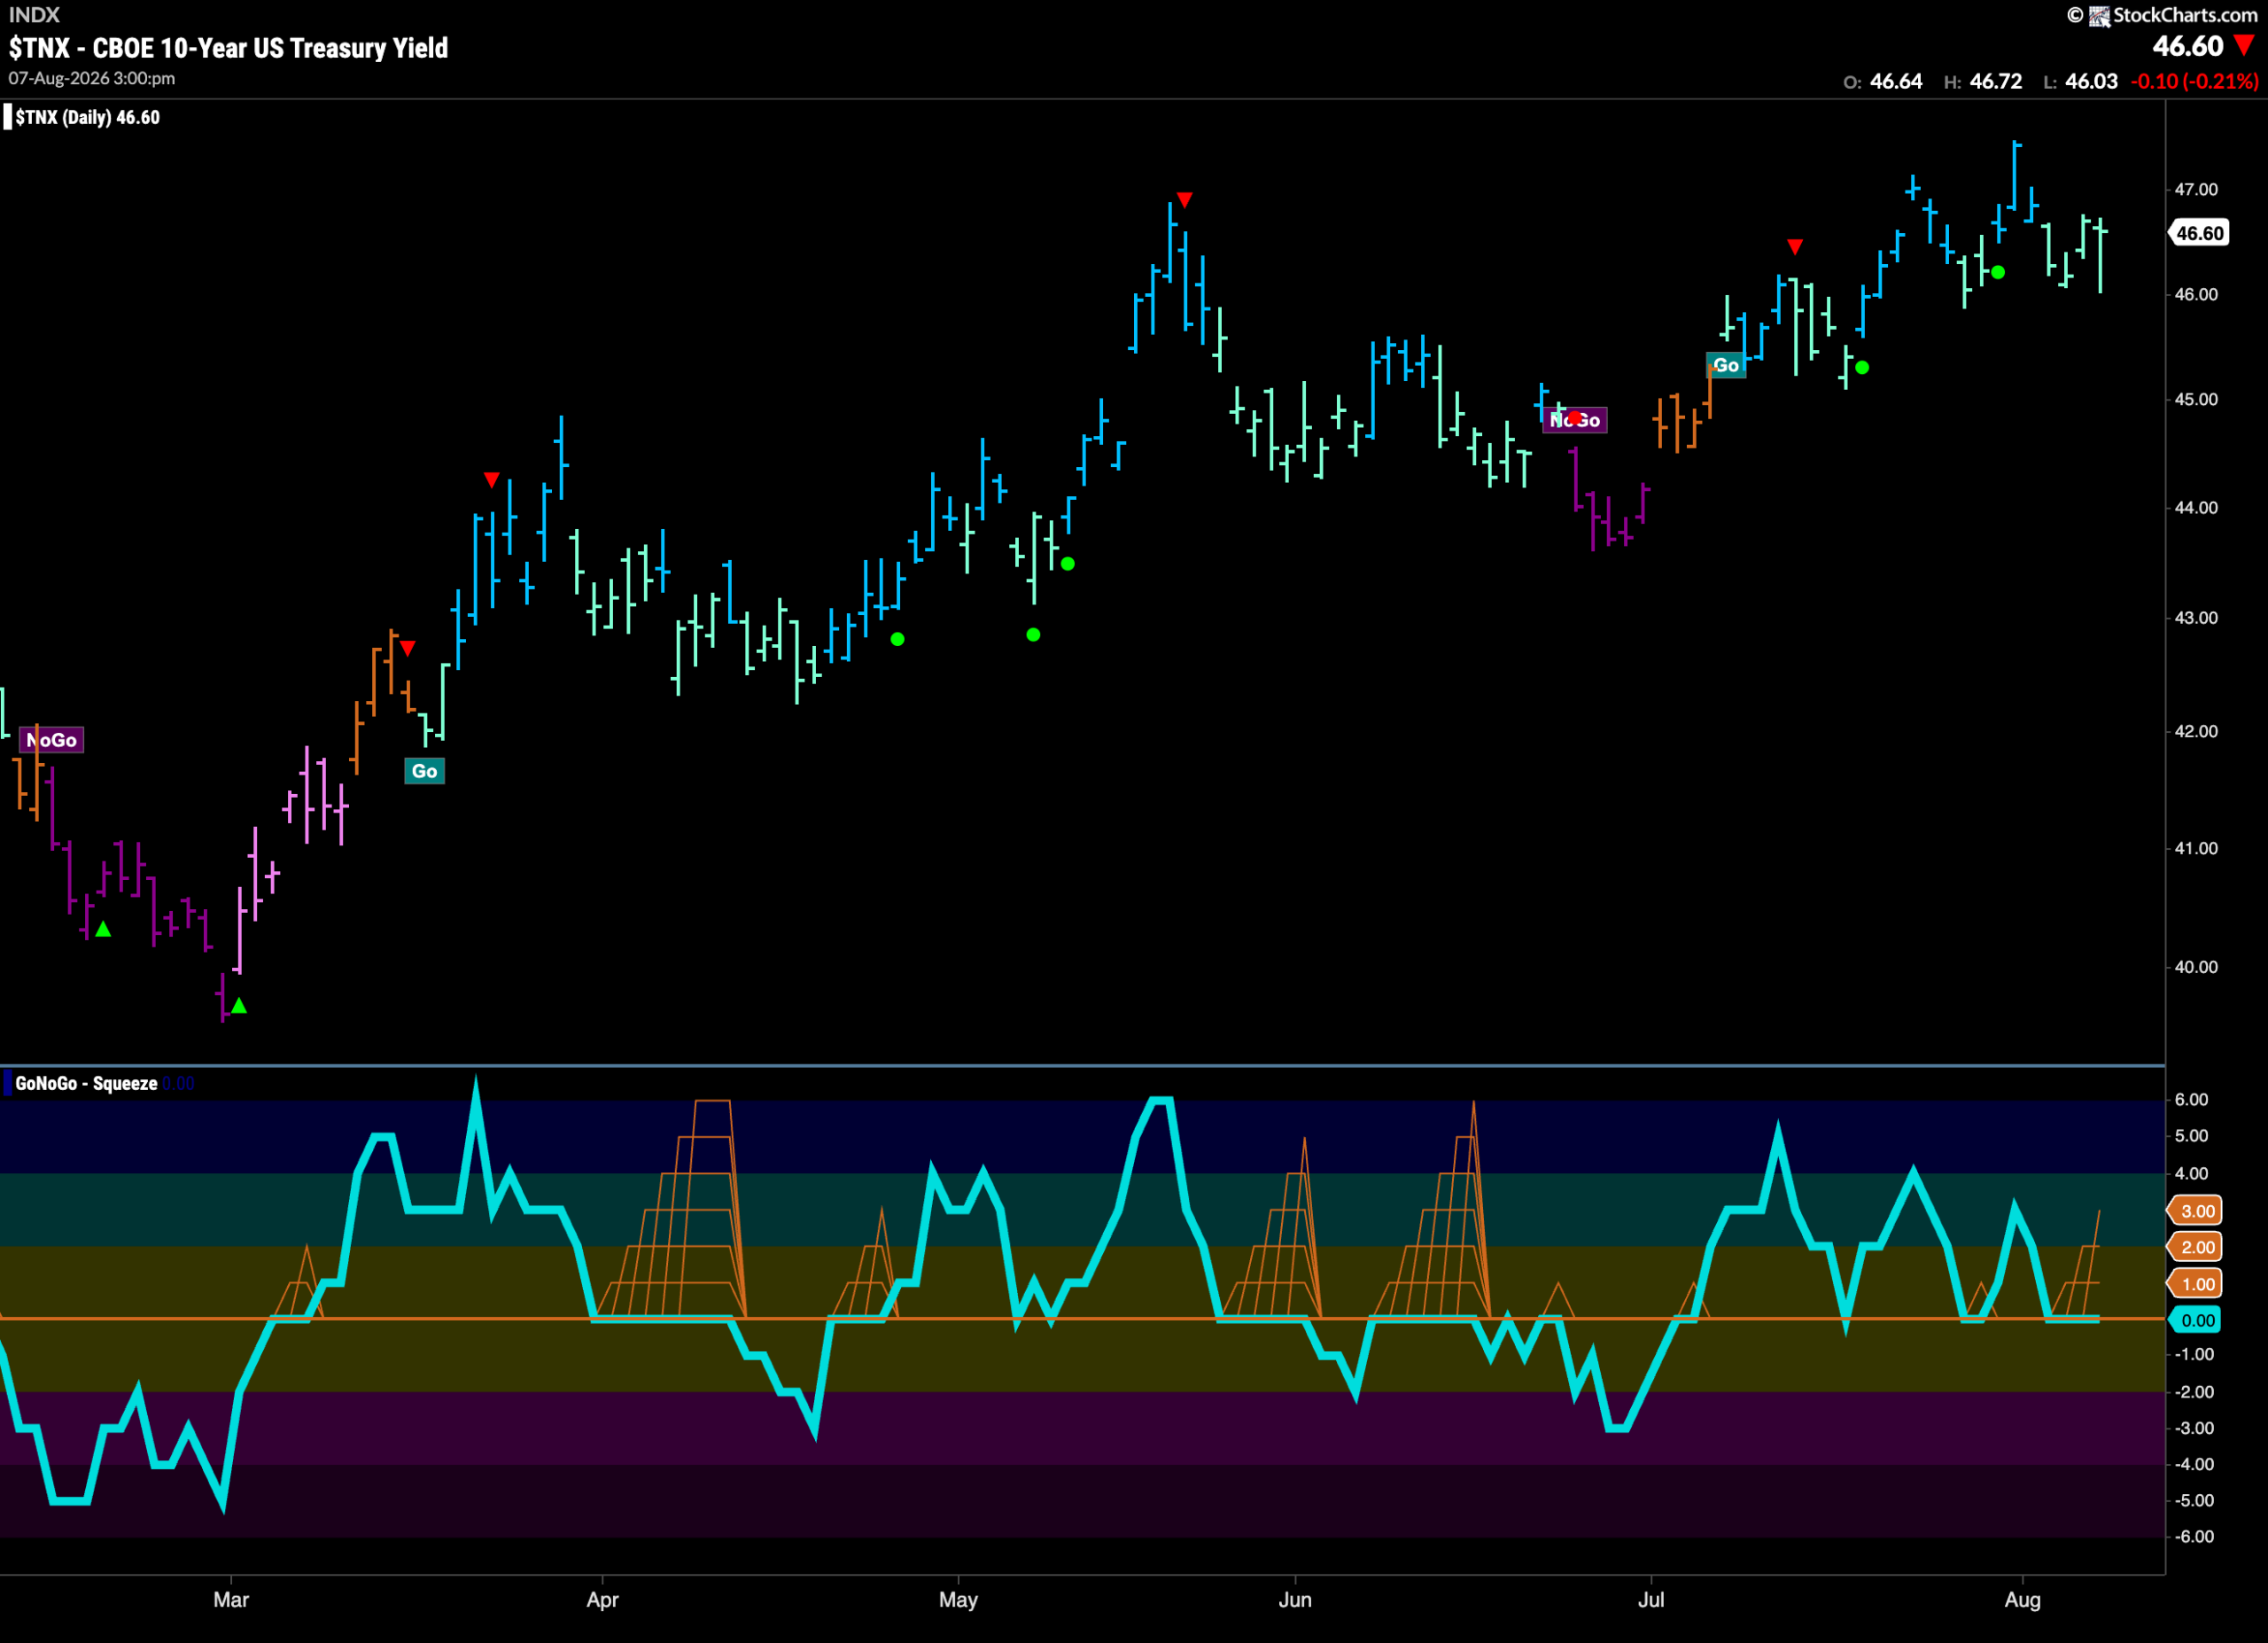
GoNoGo Trend shows that the “Go” trend remained in place after the last higher high however the indicator does display weakness with a string of paler aqua bars. GoNoGo Oscillator is testing the zero line from above and as it spends consecutive days at that level we see the climbing grid of GoNoGo Squeeze forming. We will watch to see in which direction the Squeeze is broken to hint at the next direction for rates in the coming days.
Dollar ($UUP) New “NoGo” Trend Strengthens
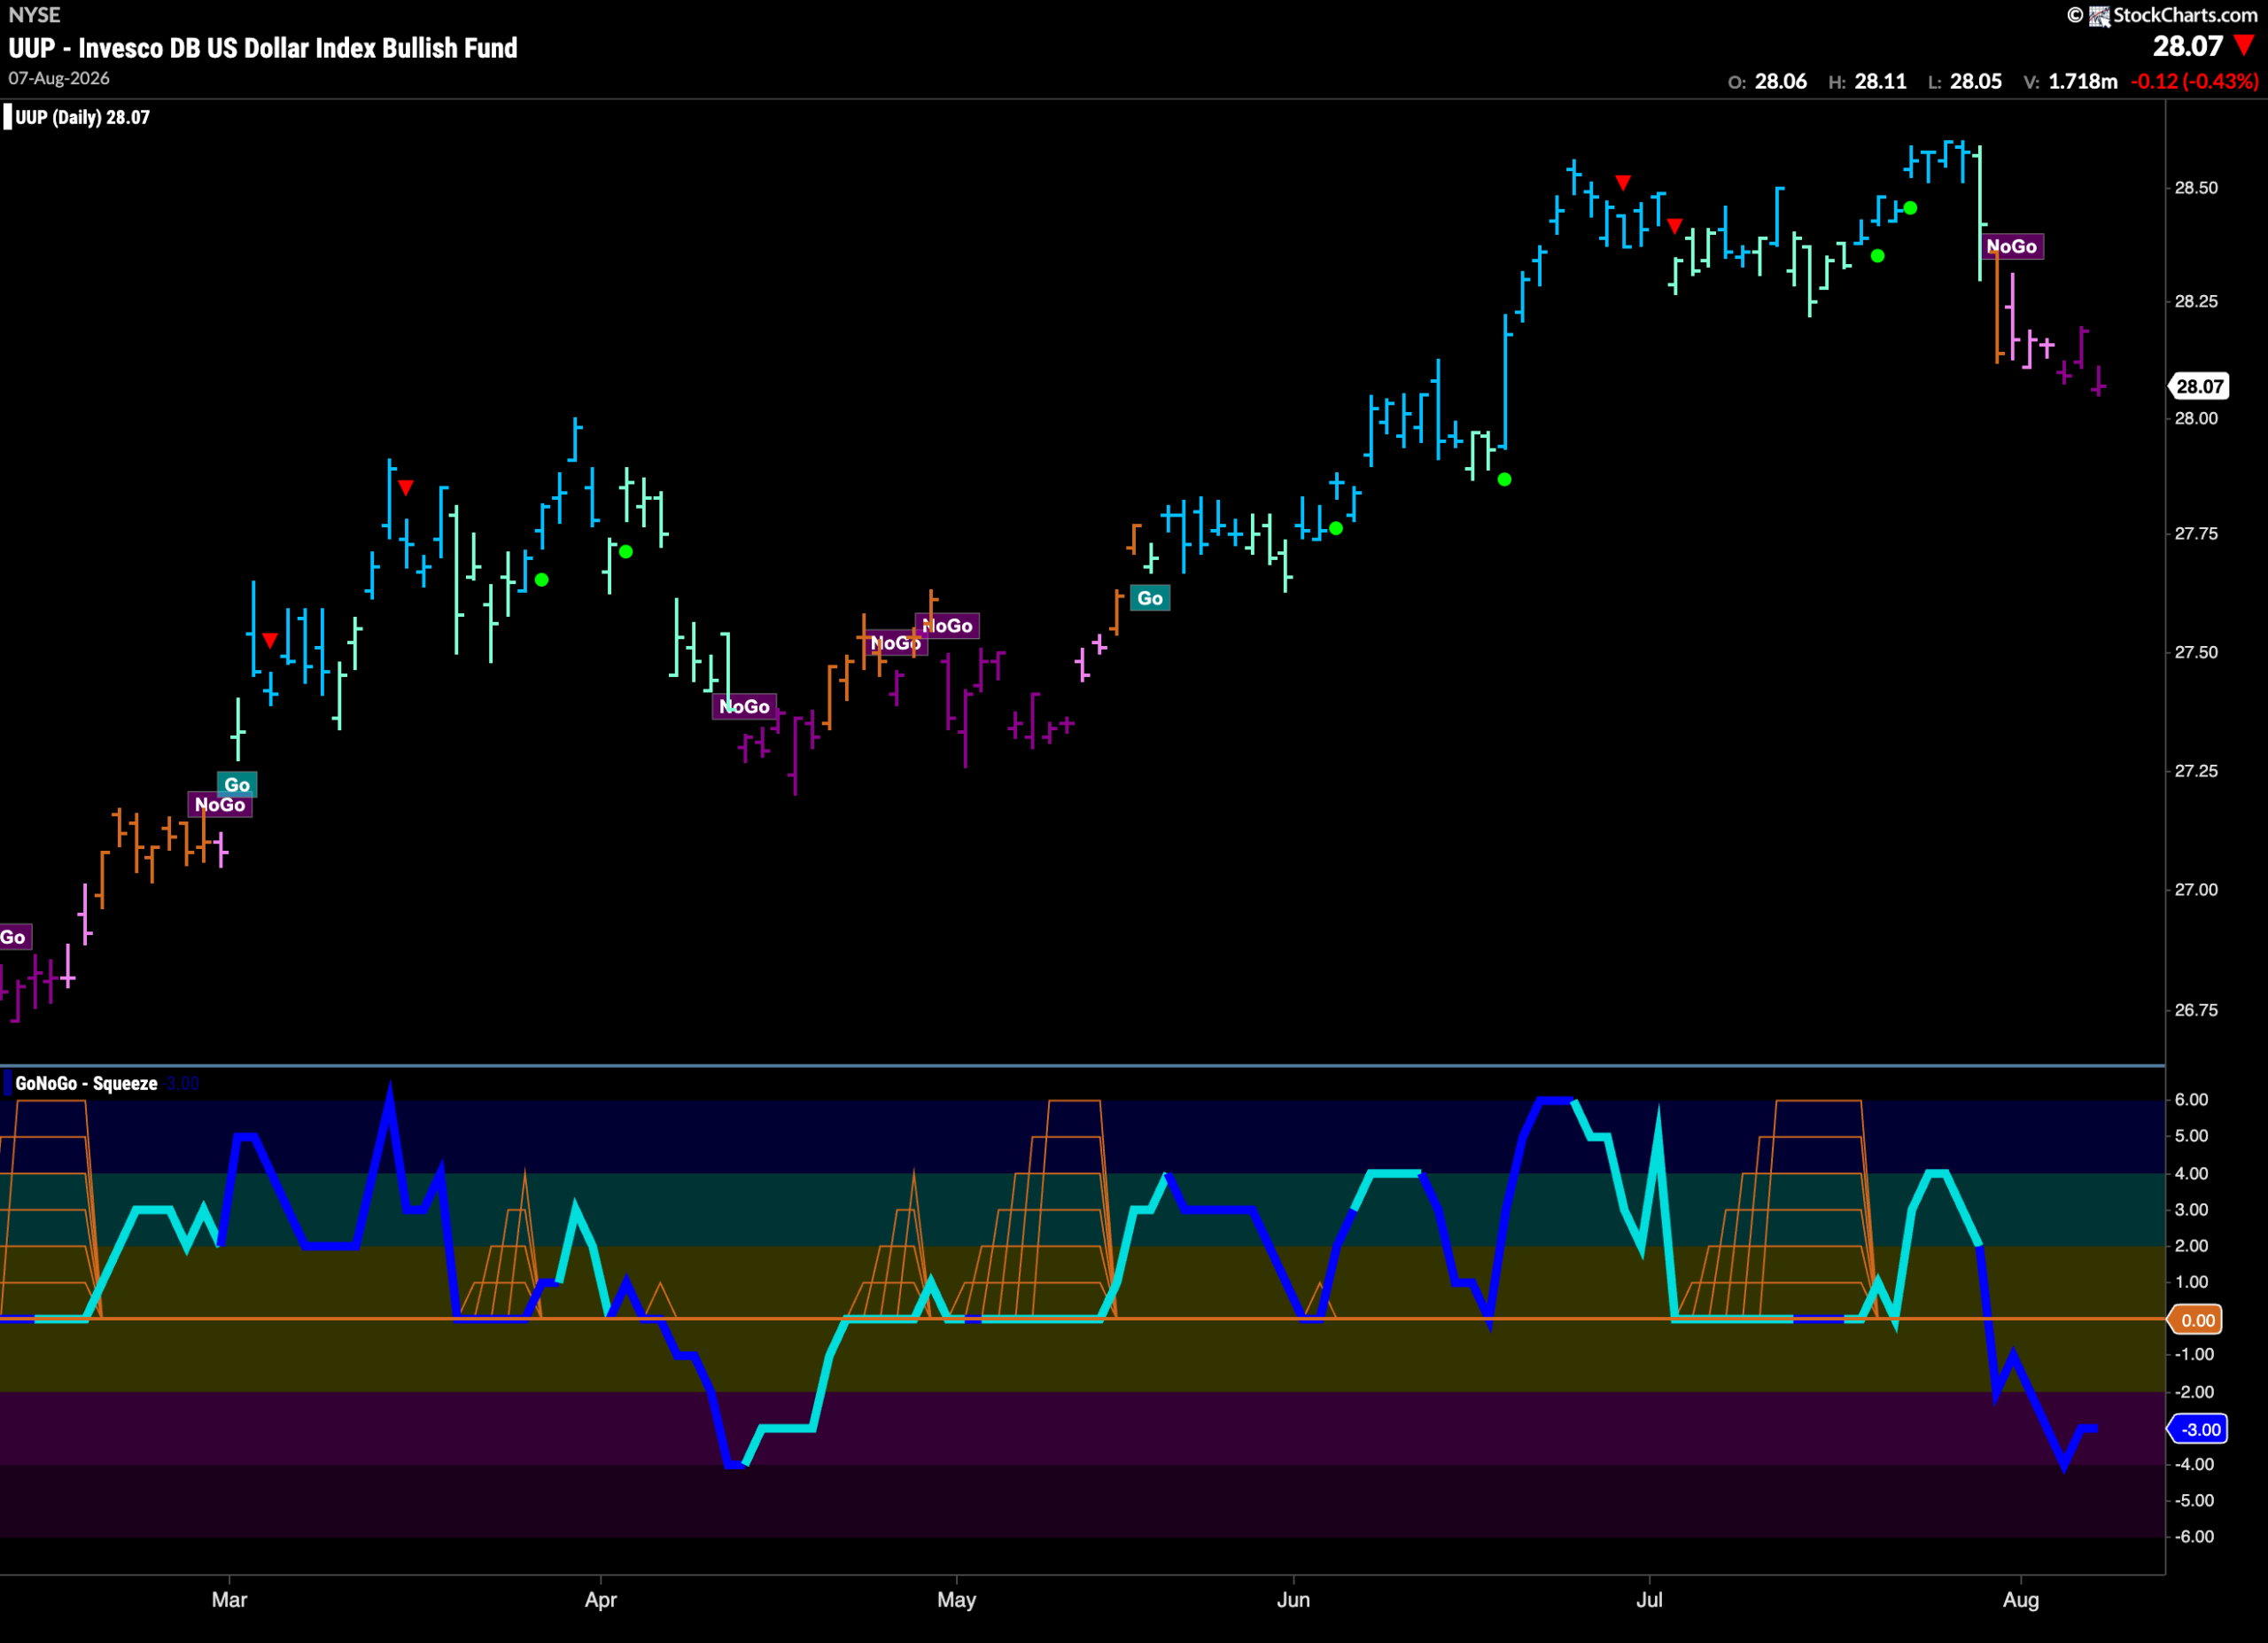
The chart below shows that the “NoGo” trend has strengthened as after pink bars we see GoNoGo Trend painting stronger purple bars. This comes as GoNoGo Oscillator remains firmly in negative territory and volume is heavy. This all points to more downside pressure for the green back in the short term.
Uncertainty Abounds For $USO
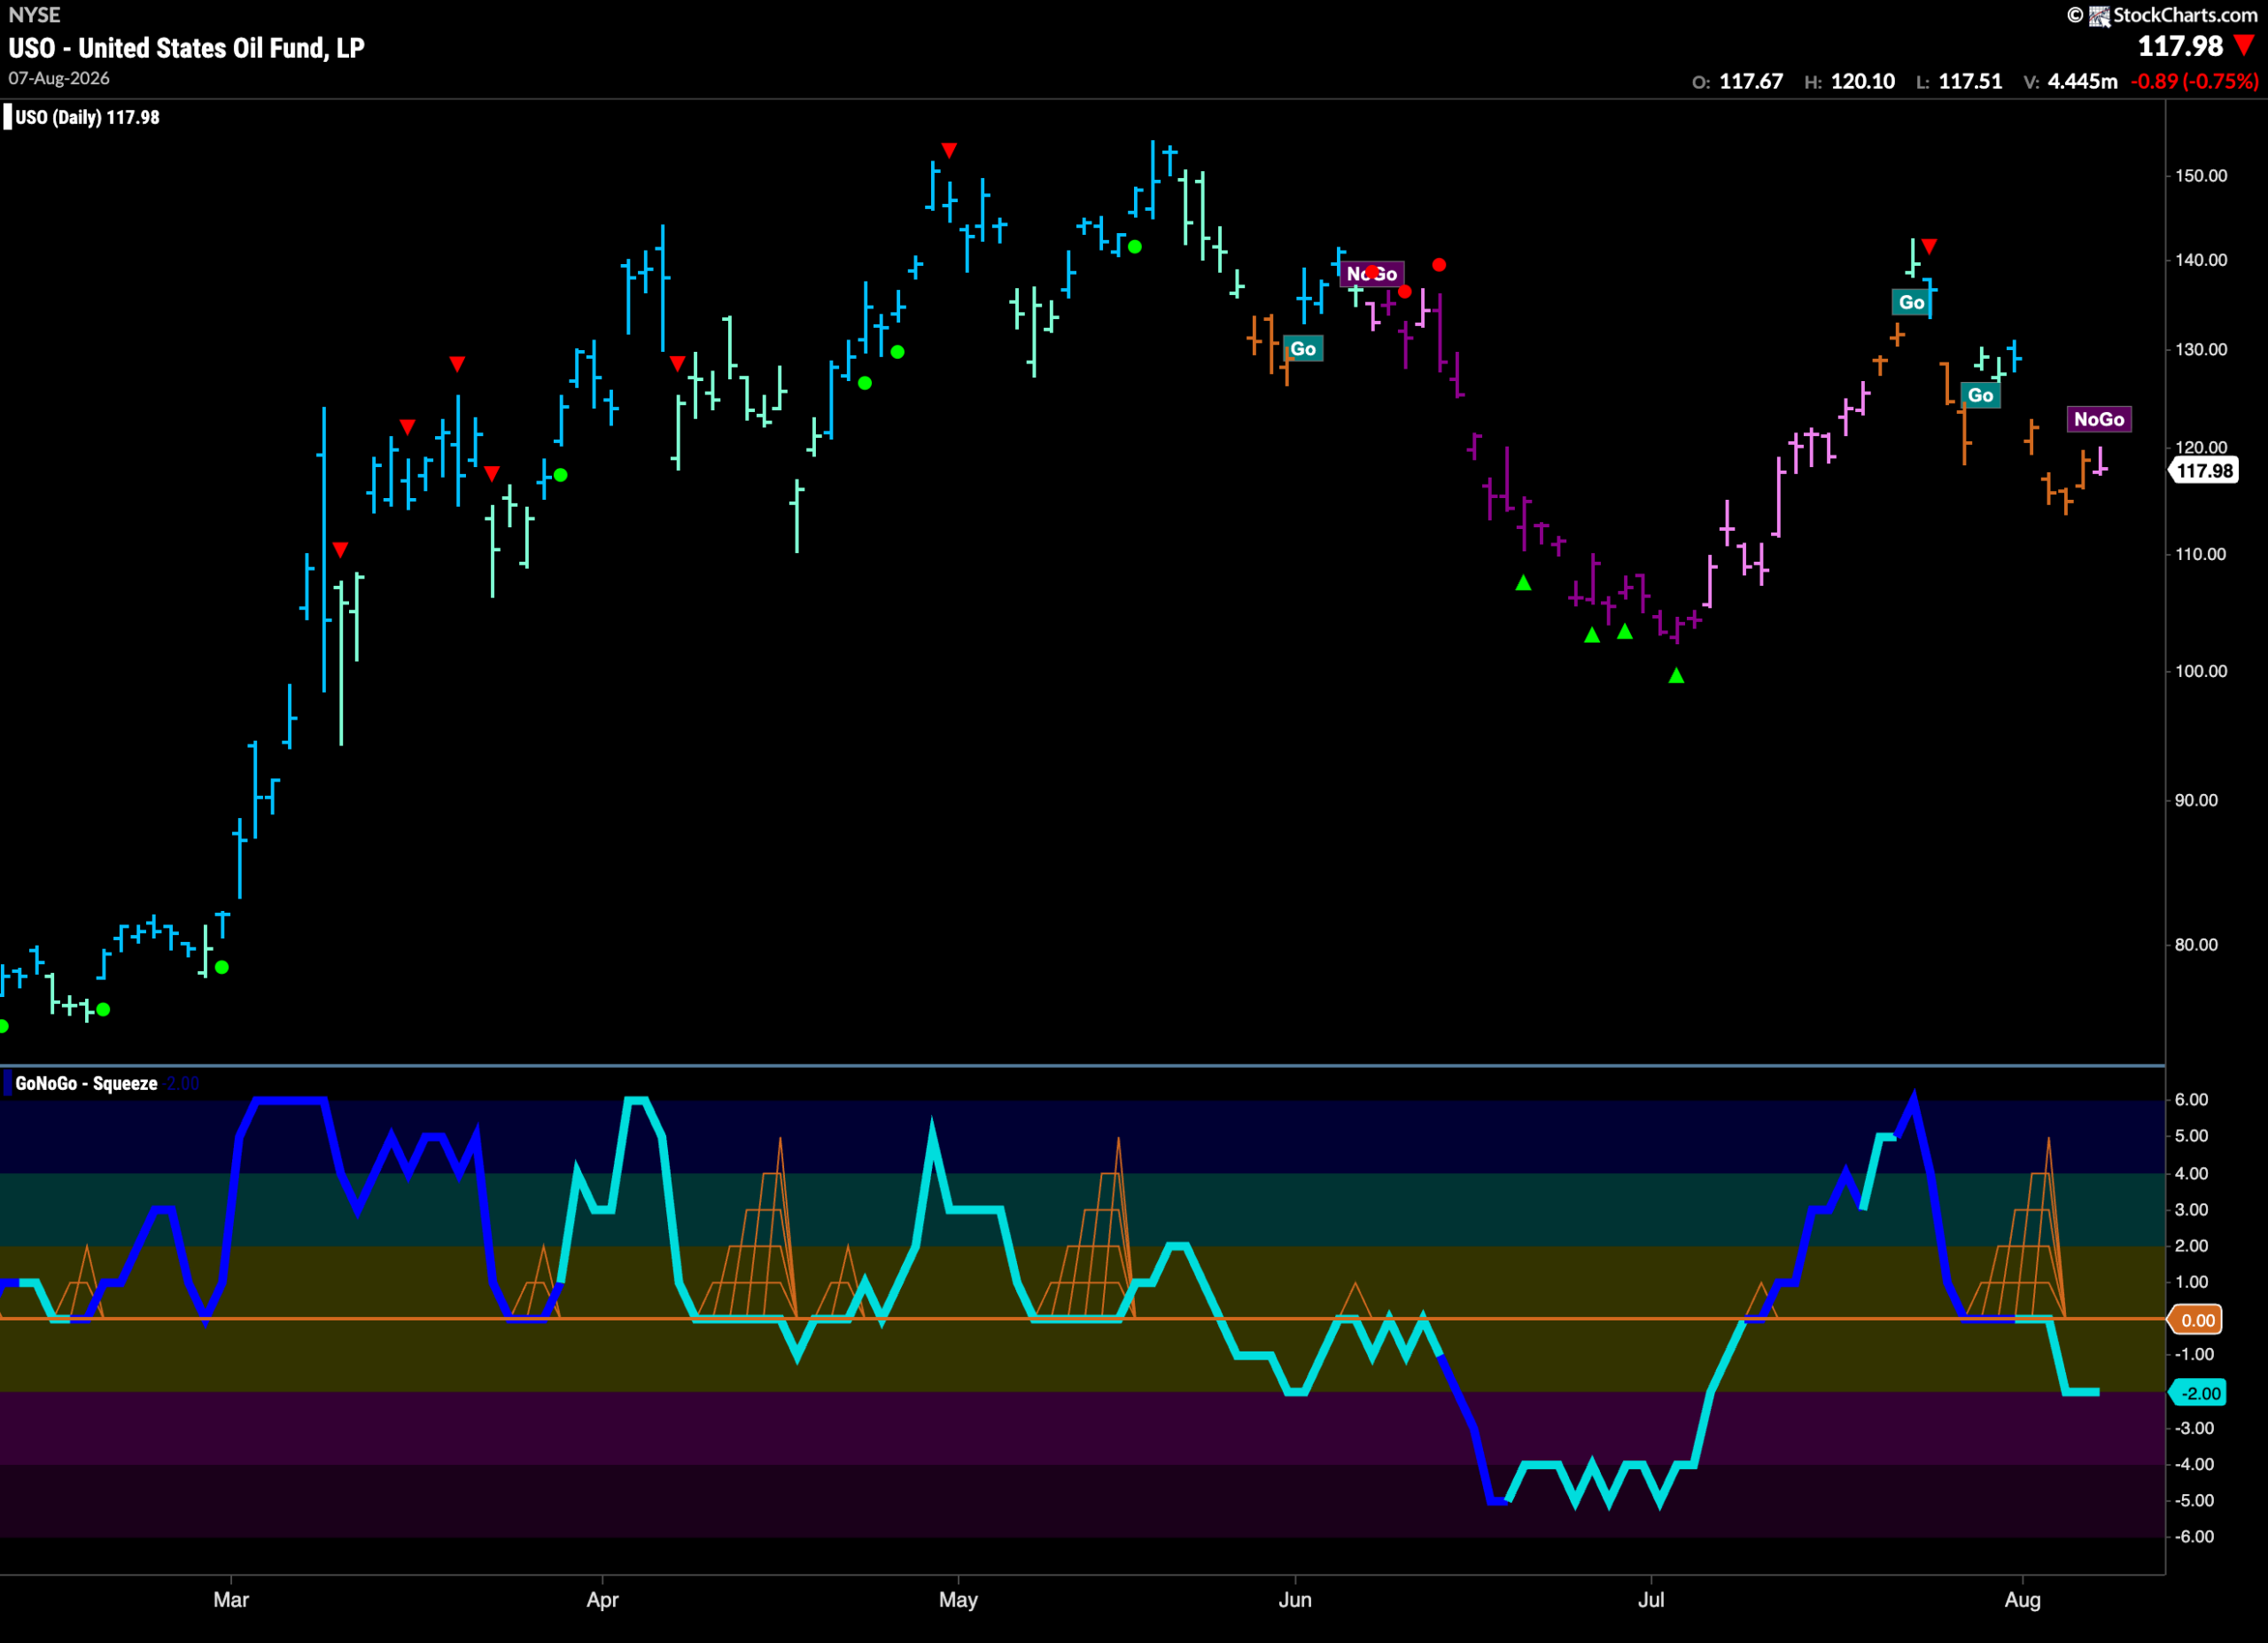
GoNoGo Trend shows that the last week was dominated by amber “Go Fish” bars of uncertainty. After a new lower low we see a first pink “NoGo” bar as a new trend tries to take hold. GoNoGo Oscillator suggests that this new trend may hold in the short term as it broke out of a GoNoGo Squeeze into negative territory and is now at a value of -2.
Gold ($GLD) Emerges from “NoGo” into New Trend
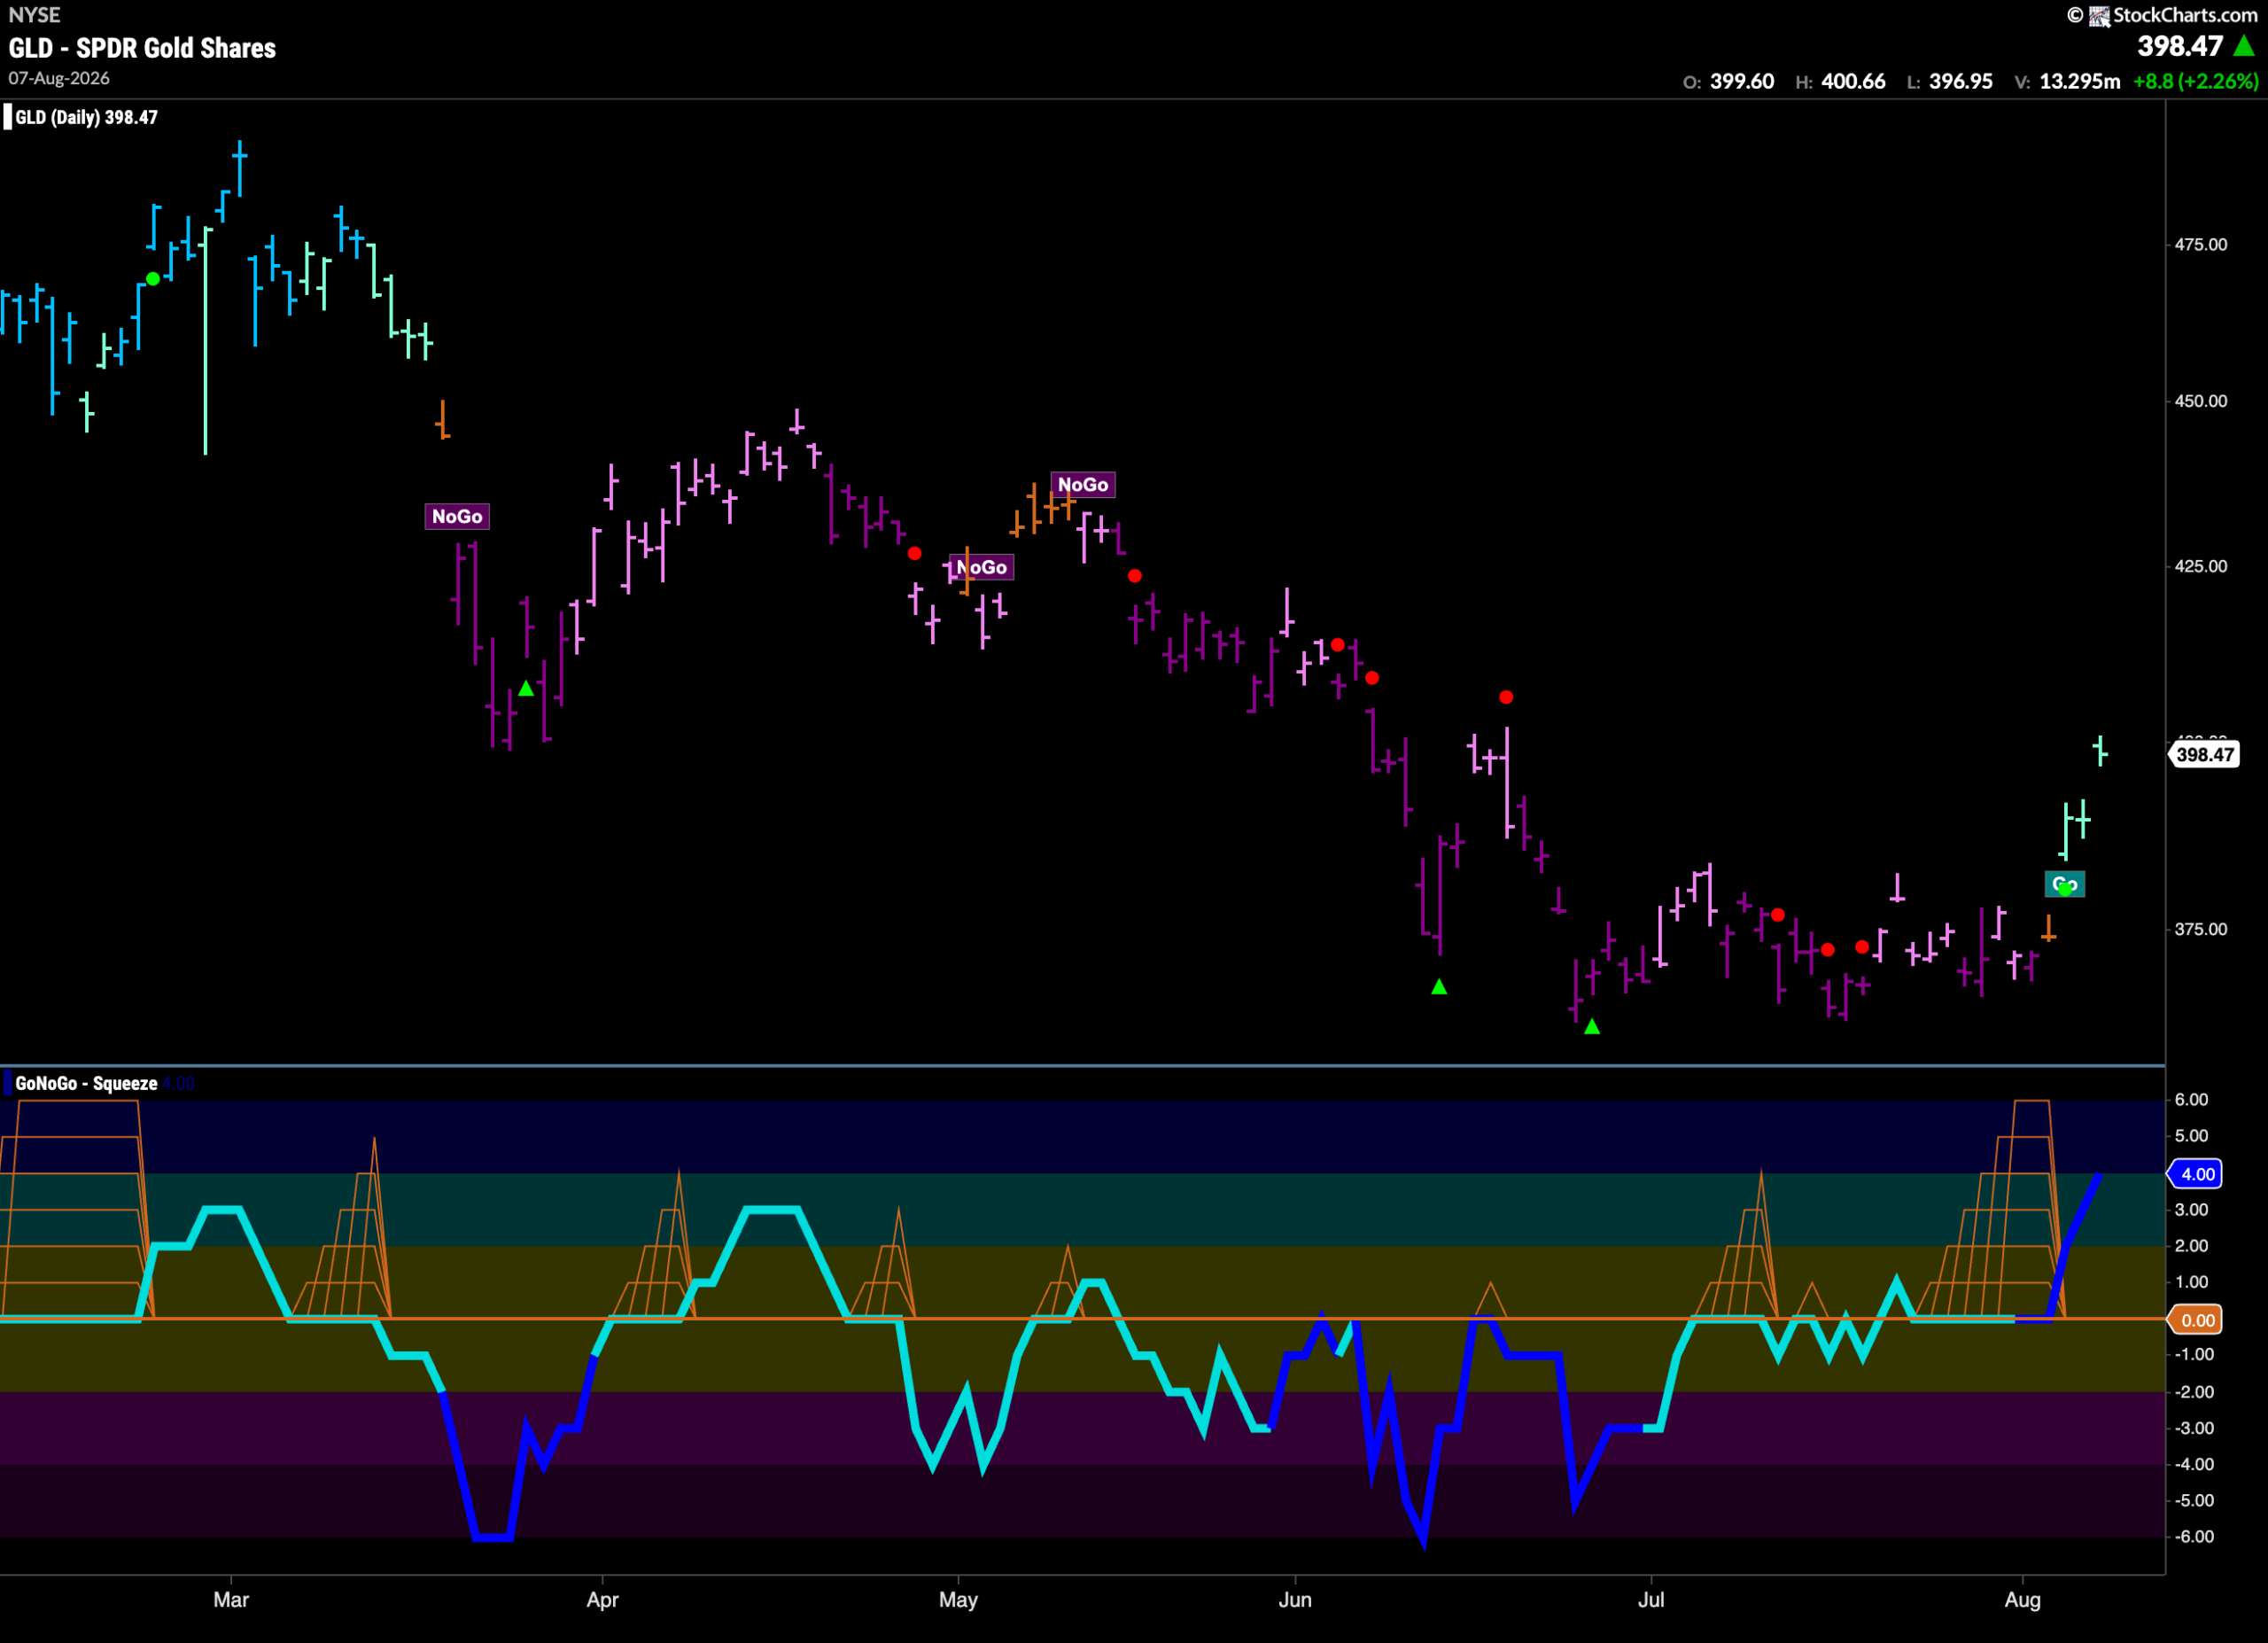
The “NoGo” trend finally ended this past week as after failing to make a lower low we saw first an amber “Go Fish” bar of uncertainty followed by a string of pale aqua bars. This came after GoNoGo Oscillator broke strongly out of a Max GoNoGo Squeeze on heavy volume. Momentum is now strongly positive at a value of 4 but not yet overbought.
Sector RelMap
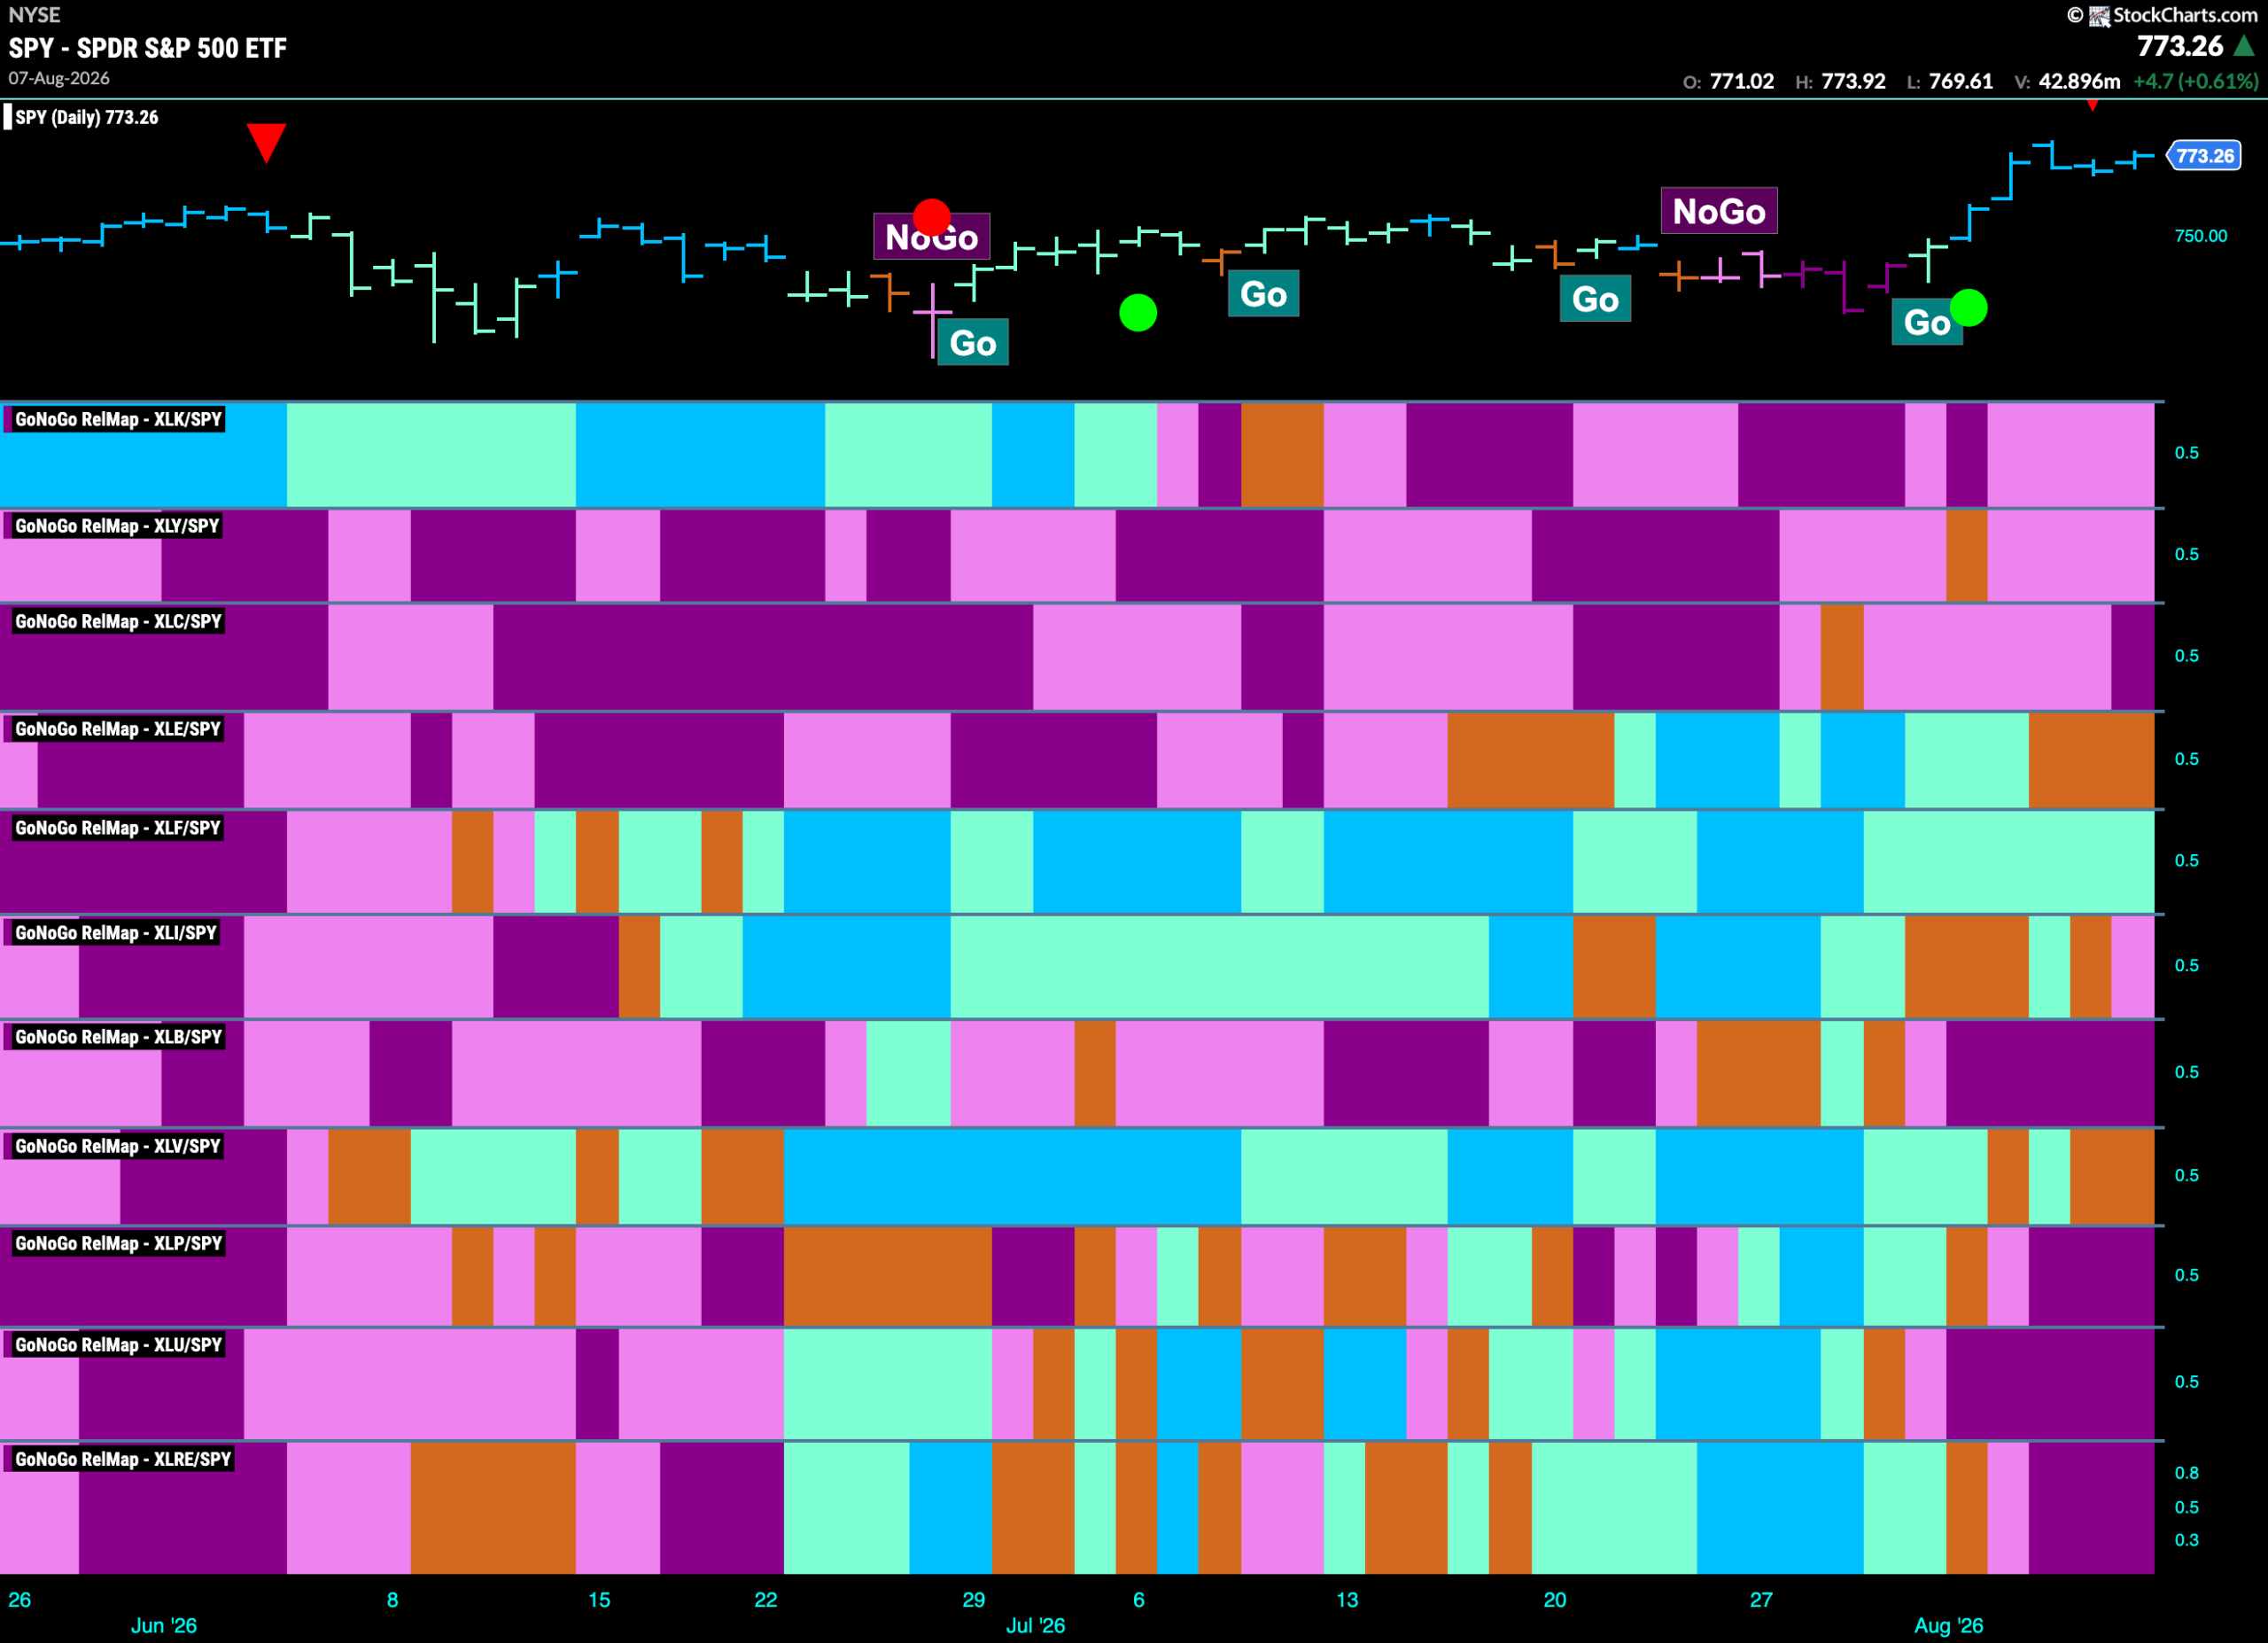
Below is the GoNoGo Sector RelMap. This GoNoGo RelMap applies the GoNoGo Trend to the relative strength ratios of the sectors to the base index. With this view we can get a sense of the relative out performance and relative underperformance of the sectors. 1 sector is in a relative “Go” trend. $XLF is painting blue relative “Go” bars.
Financials Sub-Group RelMap
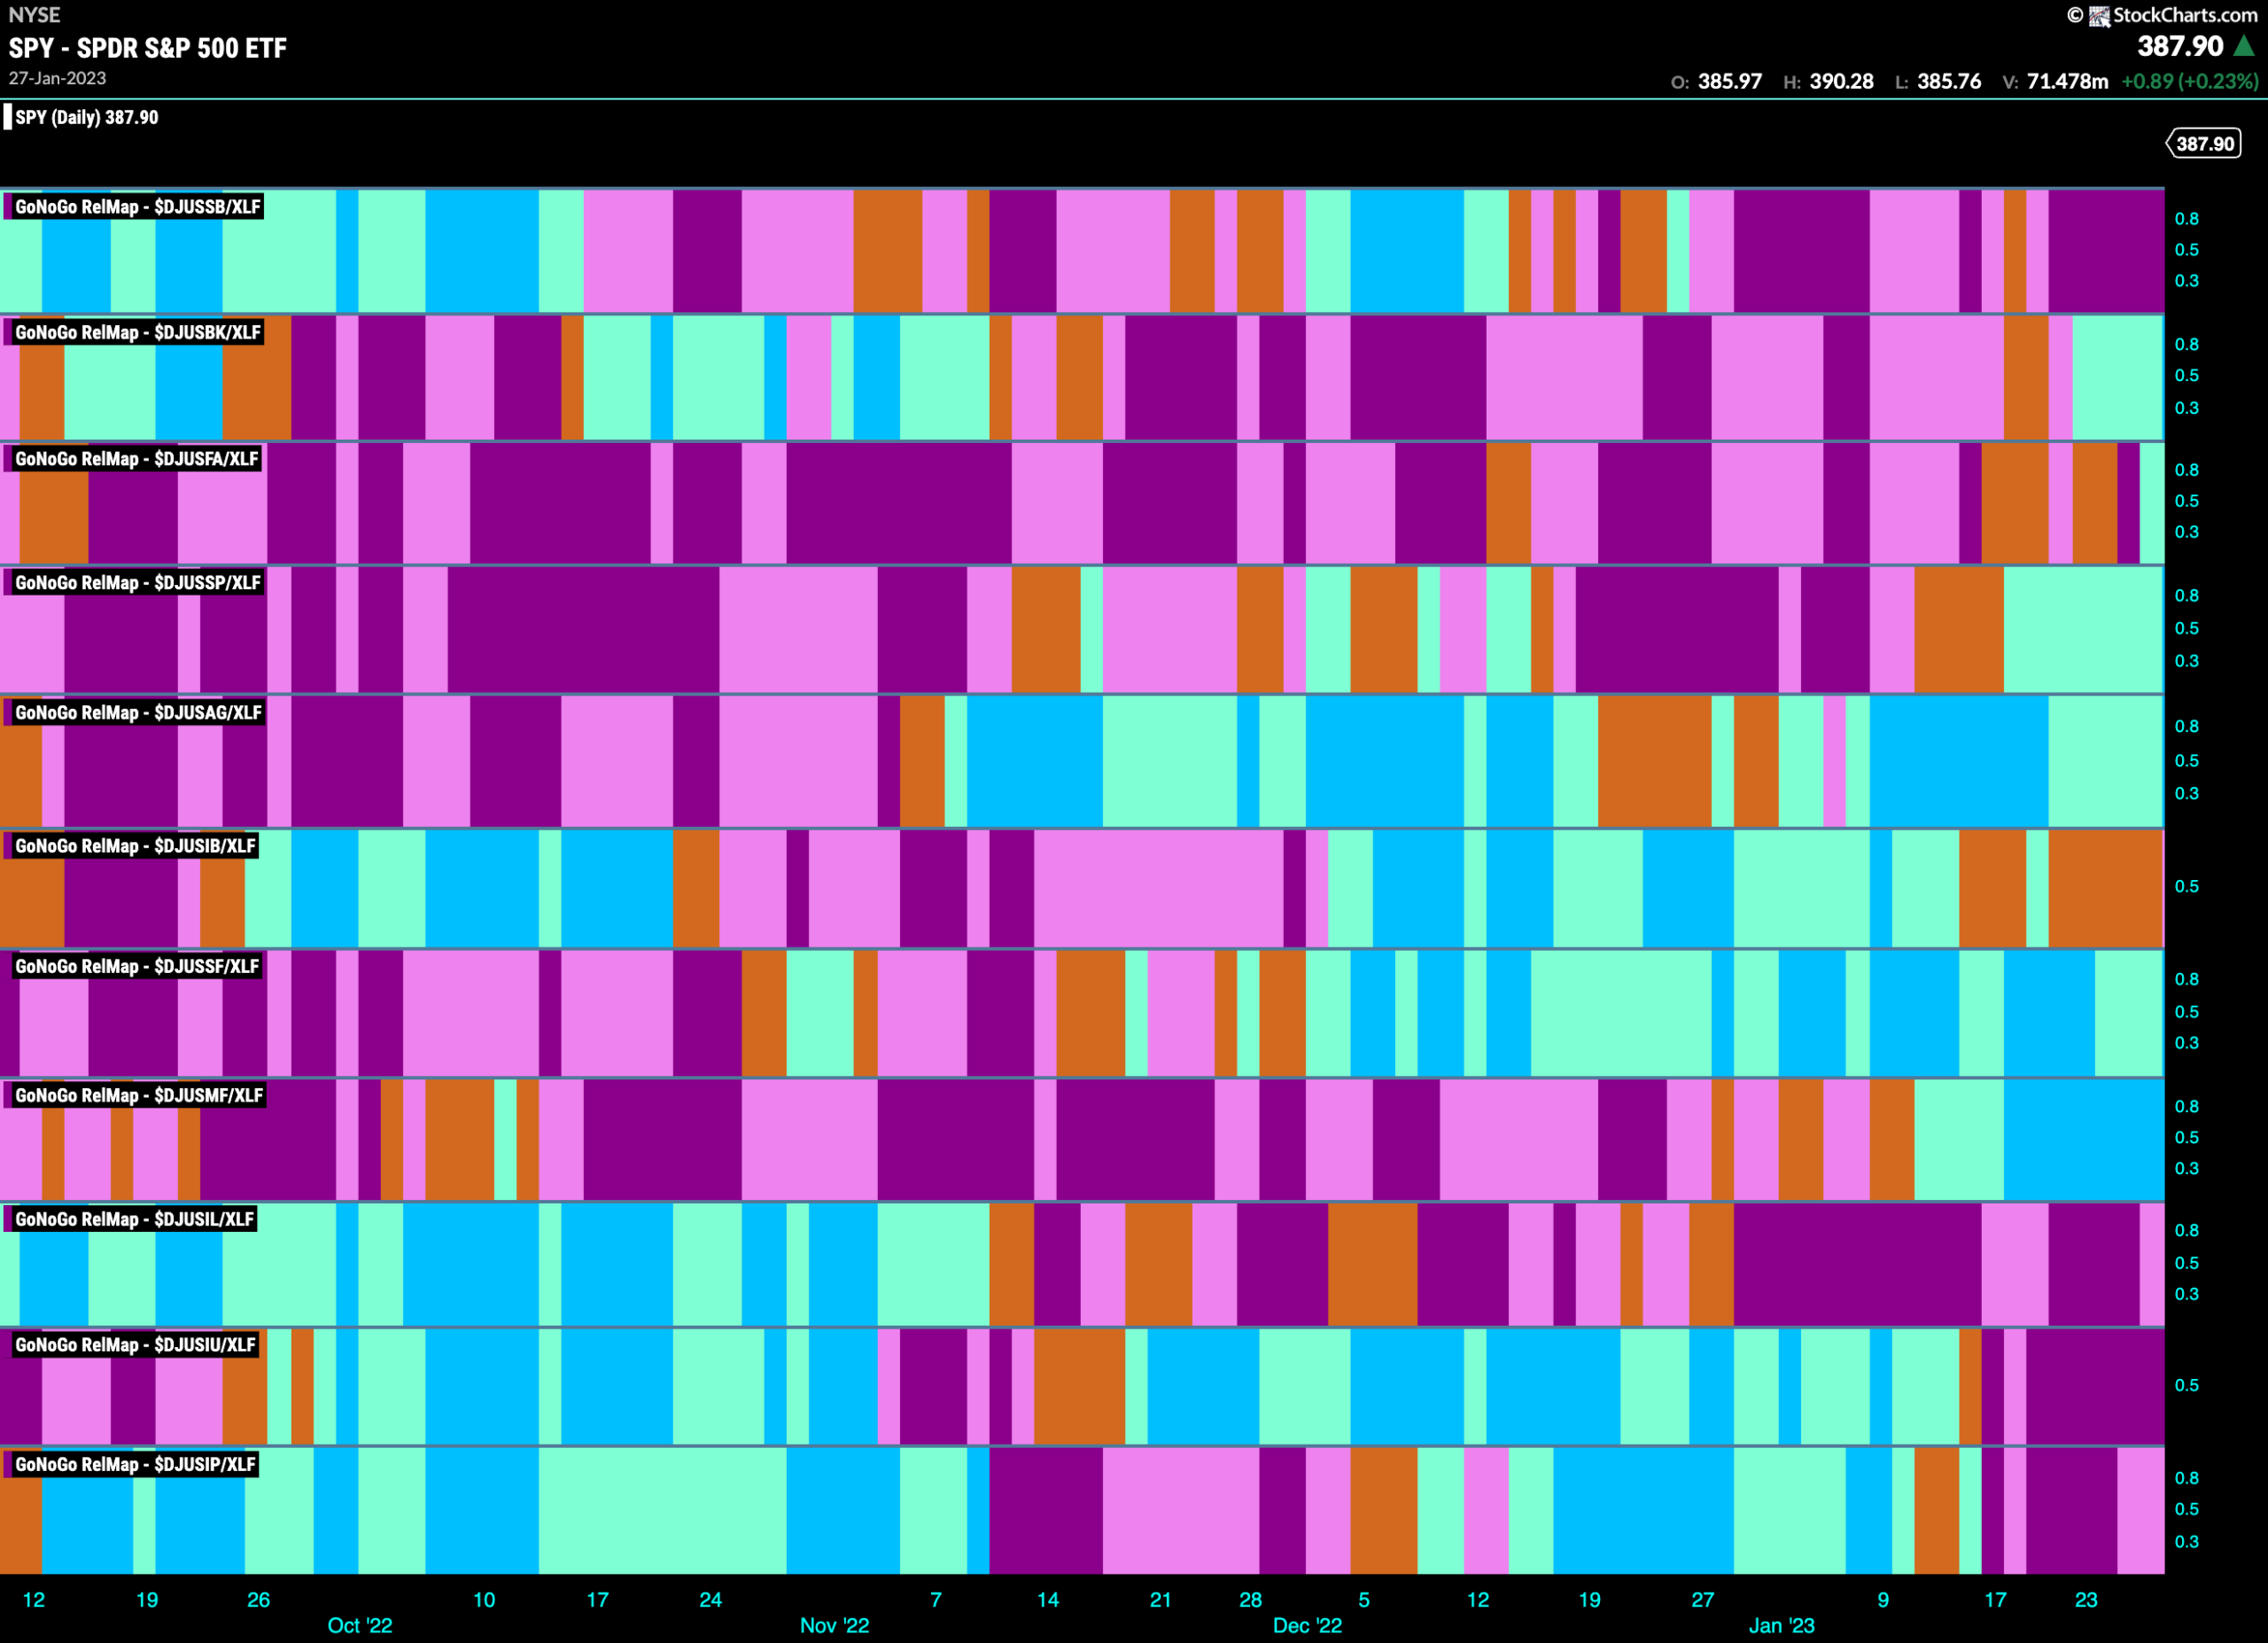
The chart below shows a relative trend breakdown of the sub groups within the financials sector this week. The Sub-Group RelMap plots the GoNoGo Trend of each sub index to the $XLF. We saw in the above GoNoGo Sector HeatMap that $XLF is painting relative “Go” bars. When we look at the below RelMap we can see that the mortgage finance index in the 7th panel has been painting “Go” bars on a relative basis for the longest time.
$EFC Looks For New High
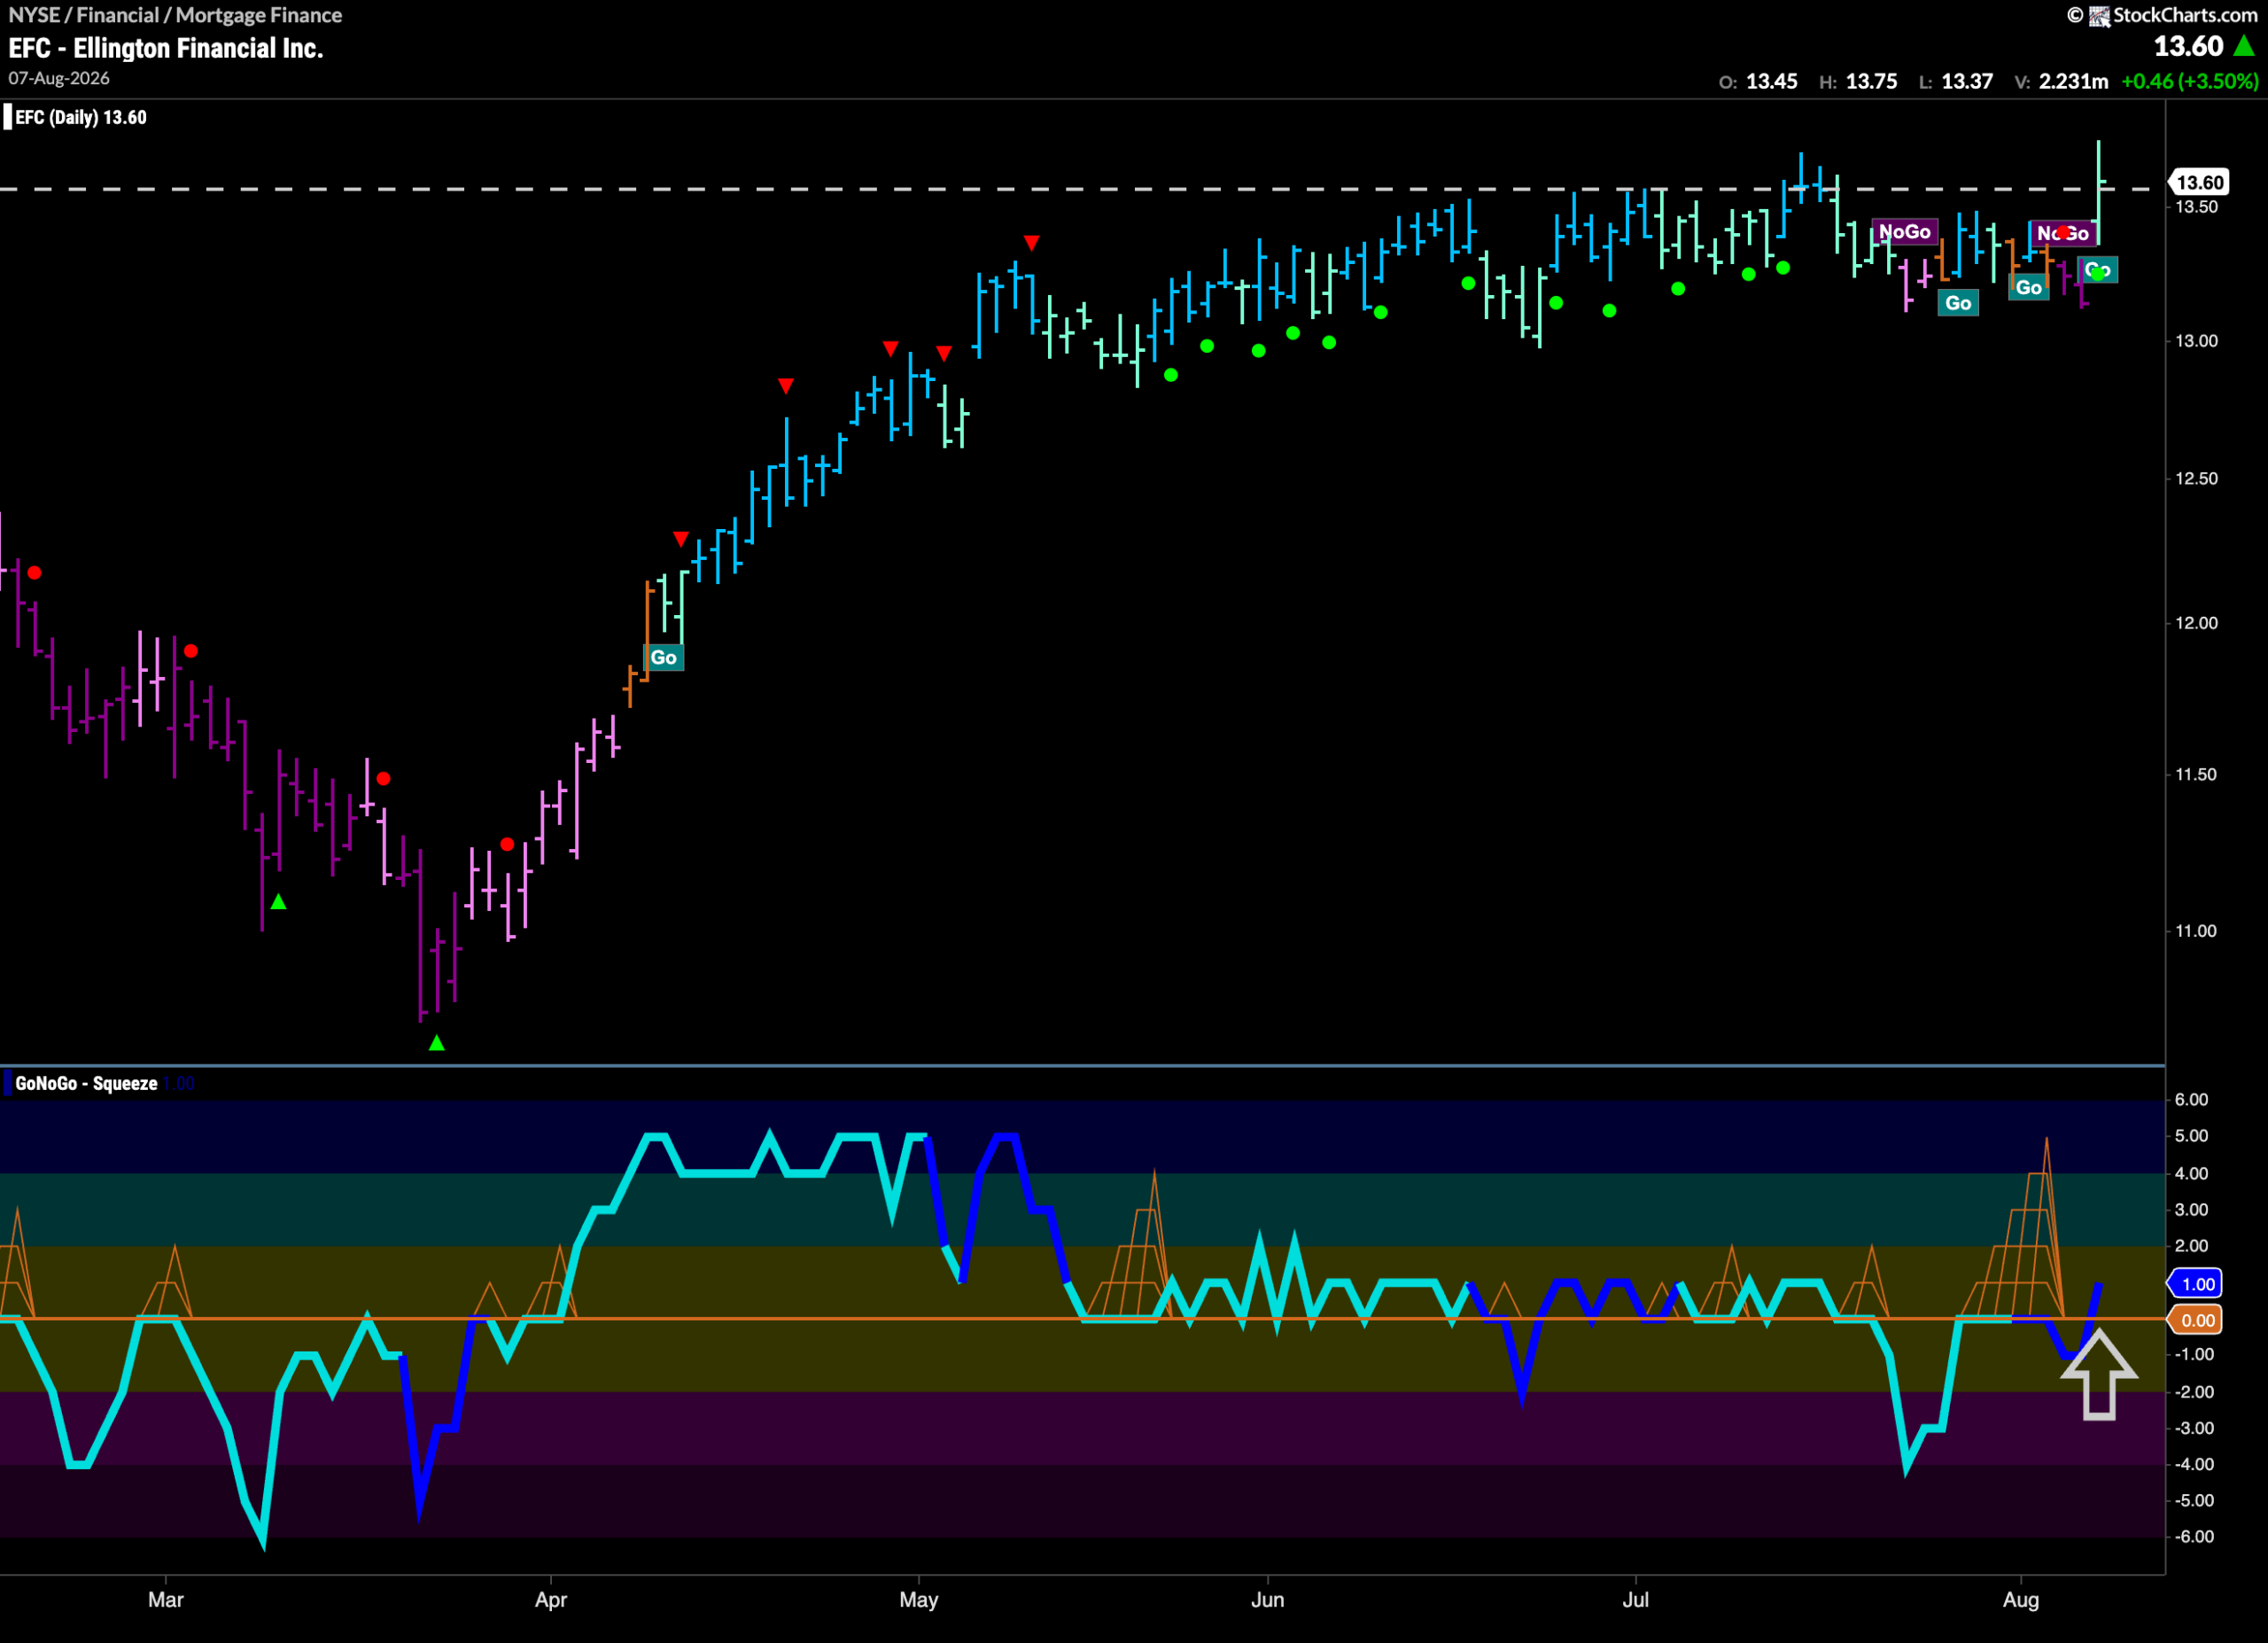
The GoNoGo Chart below shows that $EFC had been moving mostly sideways for several months. Most recently, the “Go” trend struggled, causing the indicator to display choppiness with a selection of different trend conditions. During this time, GoNoGo Oscillator failed to hold the zero line and crashed into negative territory. However, it quickly returned to test that level and we saw a GoNoGo Squeeze and now the oscillator has moved back into positive territory on heavy volume. This coincides with GoNoGo Trend painting a new “Go” bar as price tries to climb above horizontal resistance.
$ITIC Looks for New High in “Go” Trend
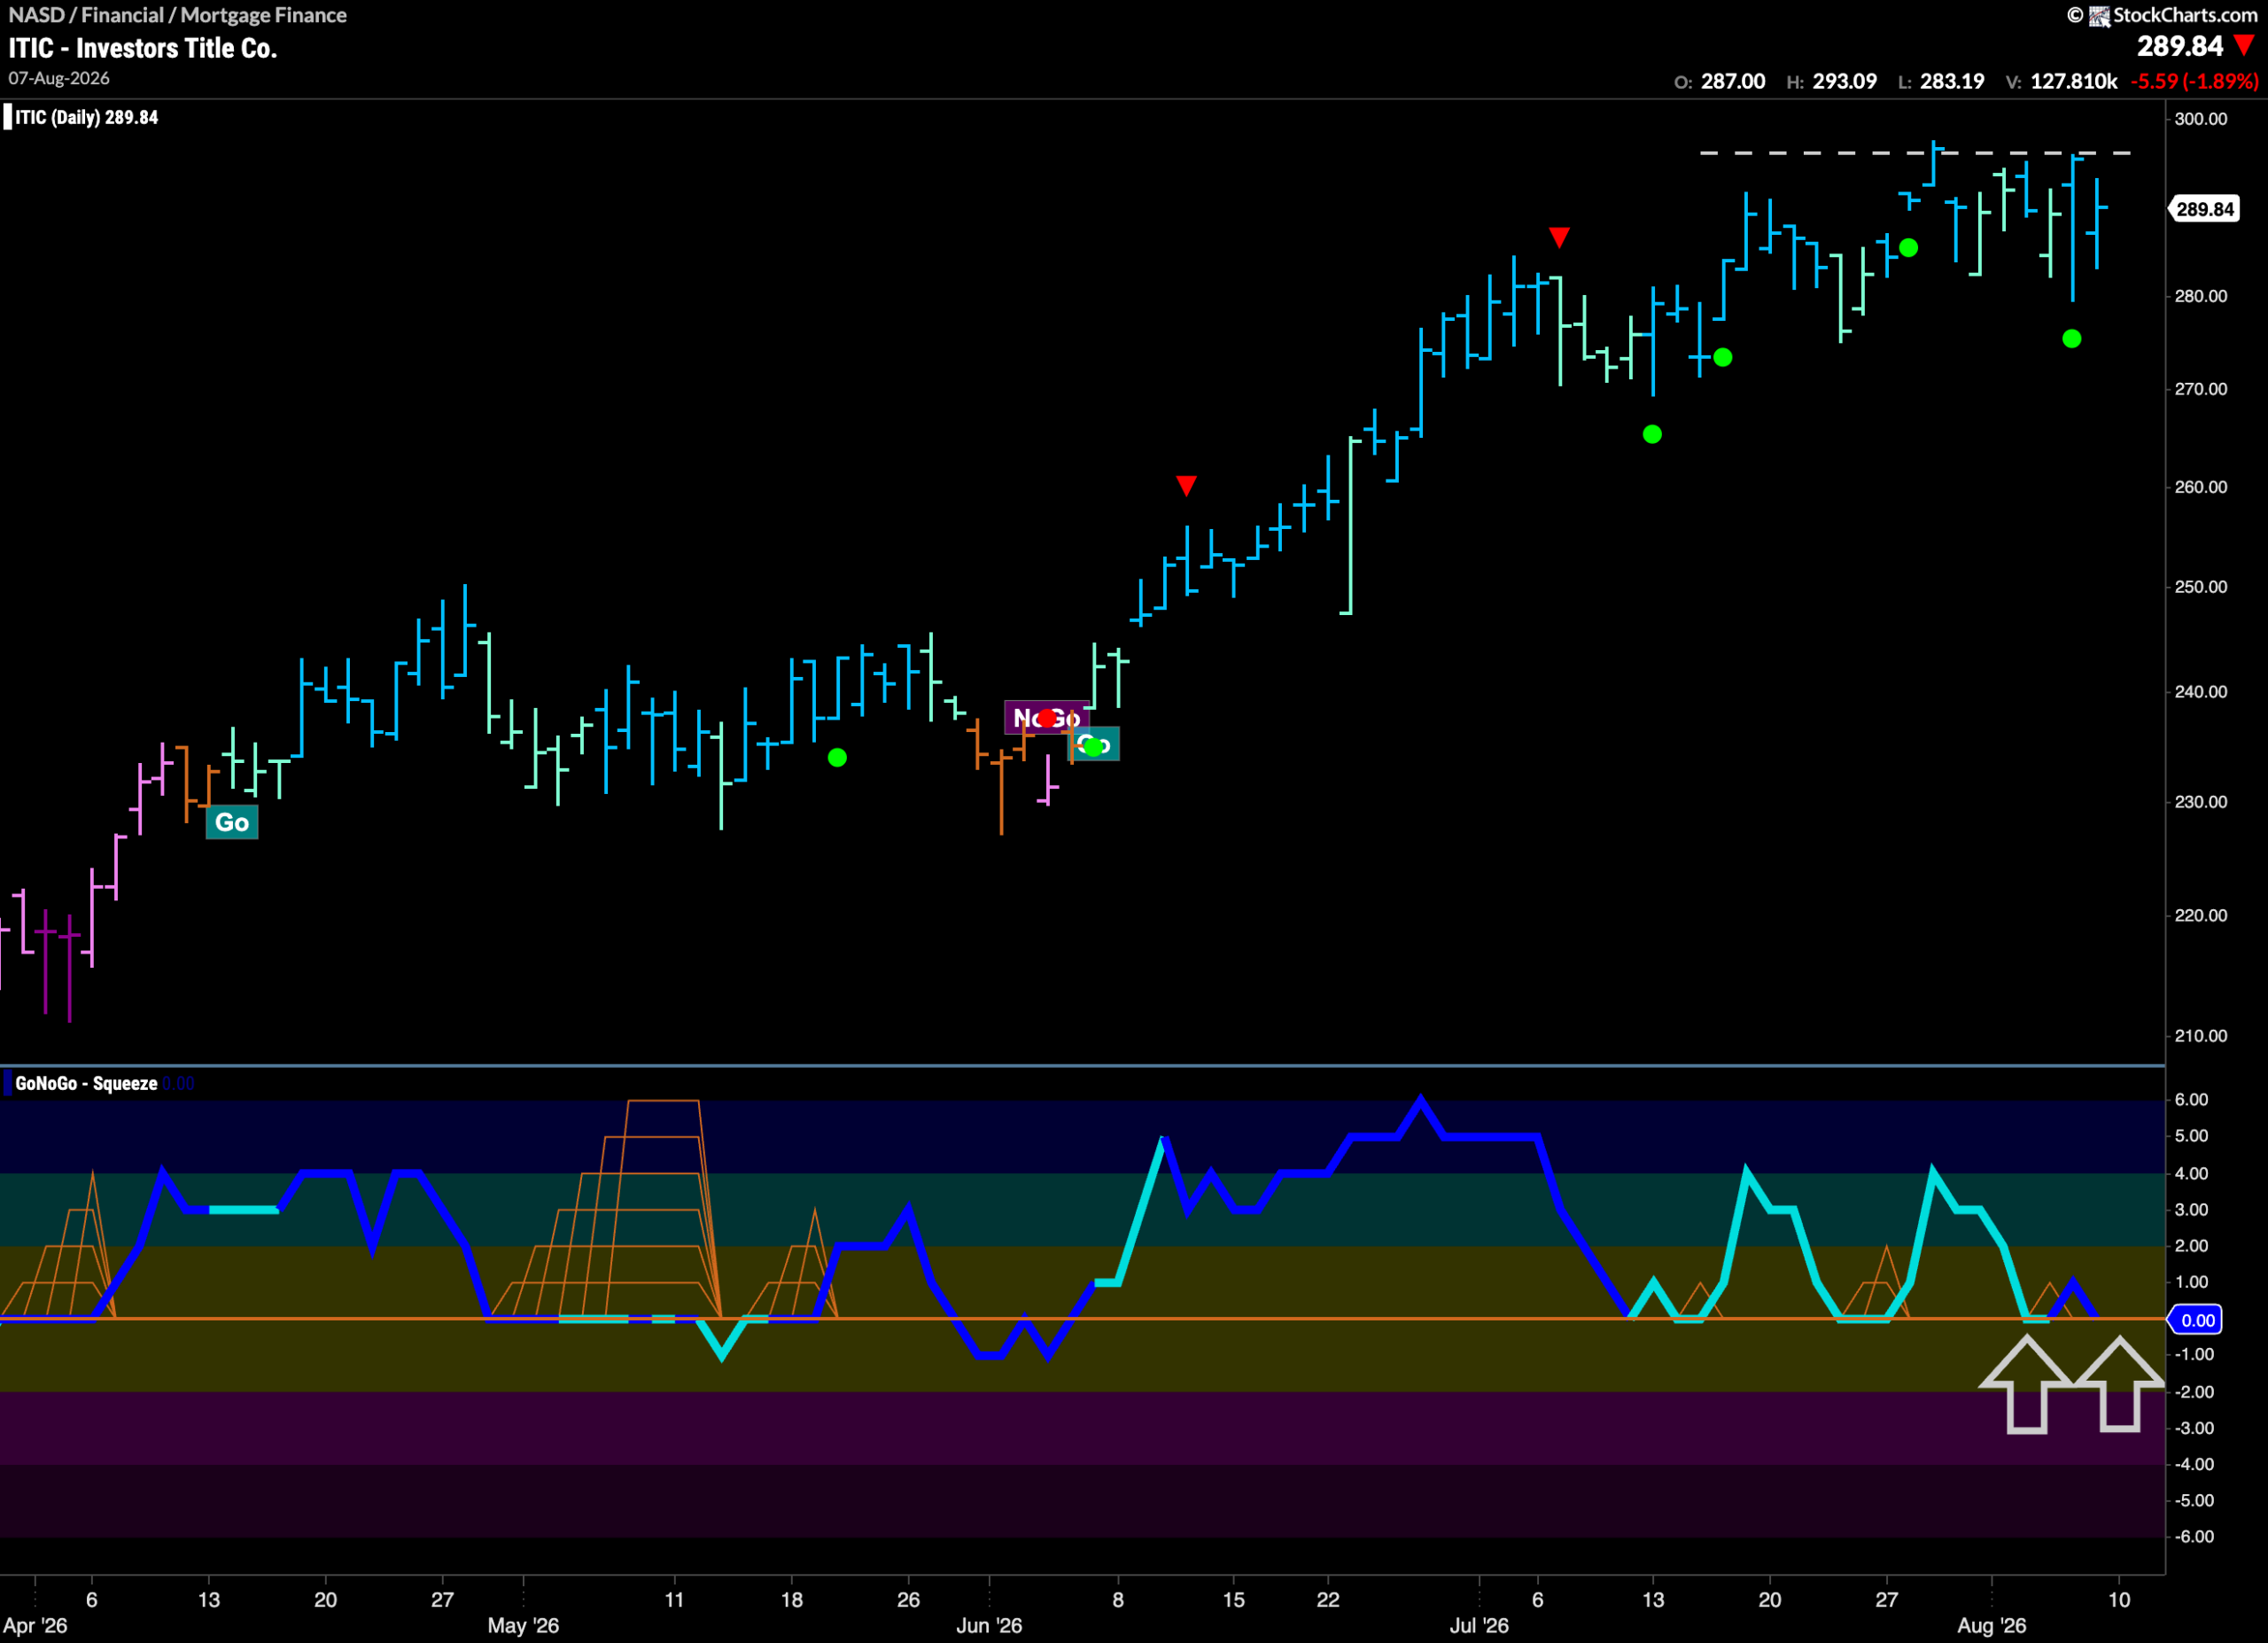
The chart below shows that $ITIC has been in a “Go” trend making higher highs and higher lows. GoNoGo Oscillator has been finding support at the zero line during the trend confirming the price movement. Now, we see GoNoGo Trend painting strong blue “Go” bars as price nudges up agains overhead resistance. We will watch to see if the zero line continues to hold as support for the oscillator. If it does, and momentum can bounce back into positive territory then we will expect price to make an attack on a new higher high.