
Bullish head and shoulders appears on Cheniere Energy Partners.
Using the GoNoGo Charts with traditional technical analysis can be valuable and I am such a proponent of doing this because understanding the trend and momentum at all the significant moments in a patter such as this is hugely beneficial.
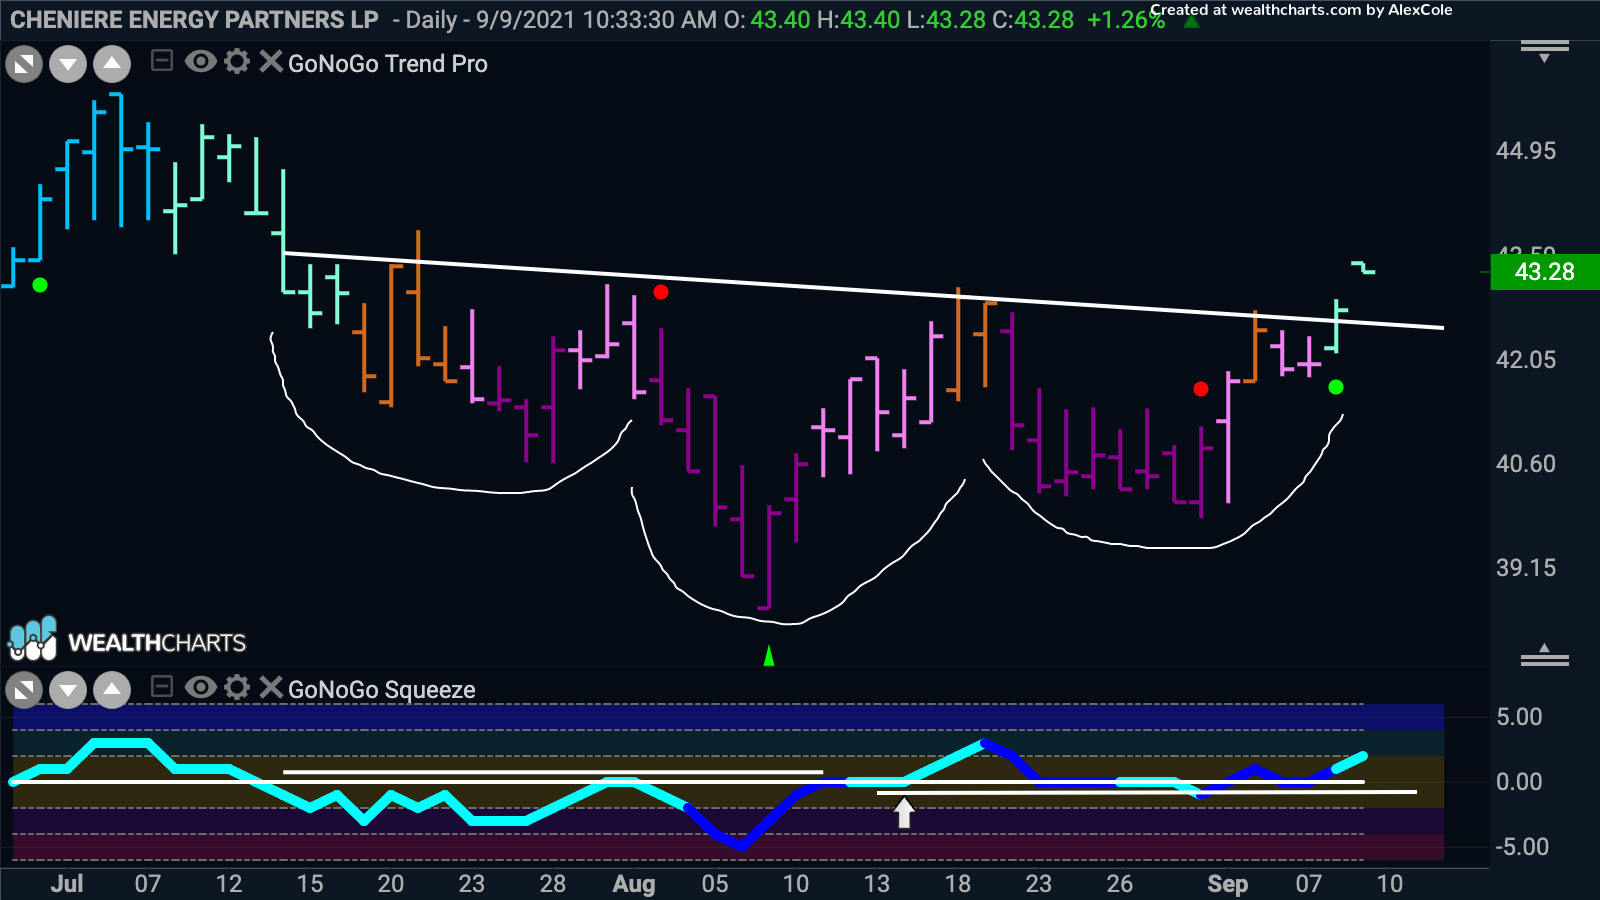
Below is the GoNoGo Chart of Cheniere Energy Partners. I have crudely annotated the bullish head and shoulders, the slightly downward sloping neckline, the shoulders and the head. Now, if you are familiar with pattern analysis we know that there is other information that can add weight to the conviction of the pattern. For example, volume in general should be specific to the ups and downs of the shoulders. With GoNoGo Charts, we can simplify the requirements that we look for. Using GoNoGo we like to see the GoNoGo Trend start to be unable to maintain the colors of the trend during the right half of the pattern. In this case, as the head rises to the neckline on the 18th of August we see two amber “Go Fish” bars representing uncertainty in the health of the “NoGo” trend. Finally as price breaks above the neckline we see “Go” colors following another amber “Go Fish” bar. Remember, that color change at important levels such as breaking above resistance also adds weight to the analysis. The GoNoGo Oscillator also gives us important information. In a pattern such as this, we like to see it break above the zero line during the right side of the pattern. Here this happens as we rally out of the low of the head. This shows us that momentum is positive while we are completing this bullish head and shoulders pattern adding to the analysis suggesting that a break of the neckline was forthcoming.
Price may well retest the neckline, but look for the oscillator to continue to find support at the zero line and ultimately for price to test the prior highs above $45.70.


