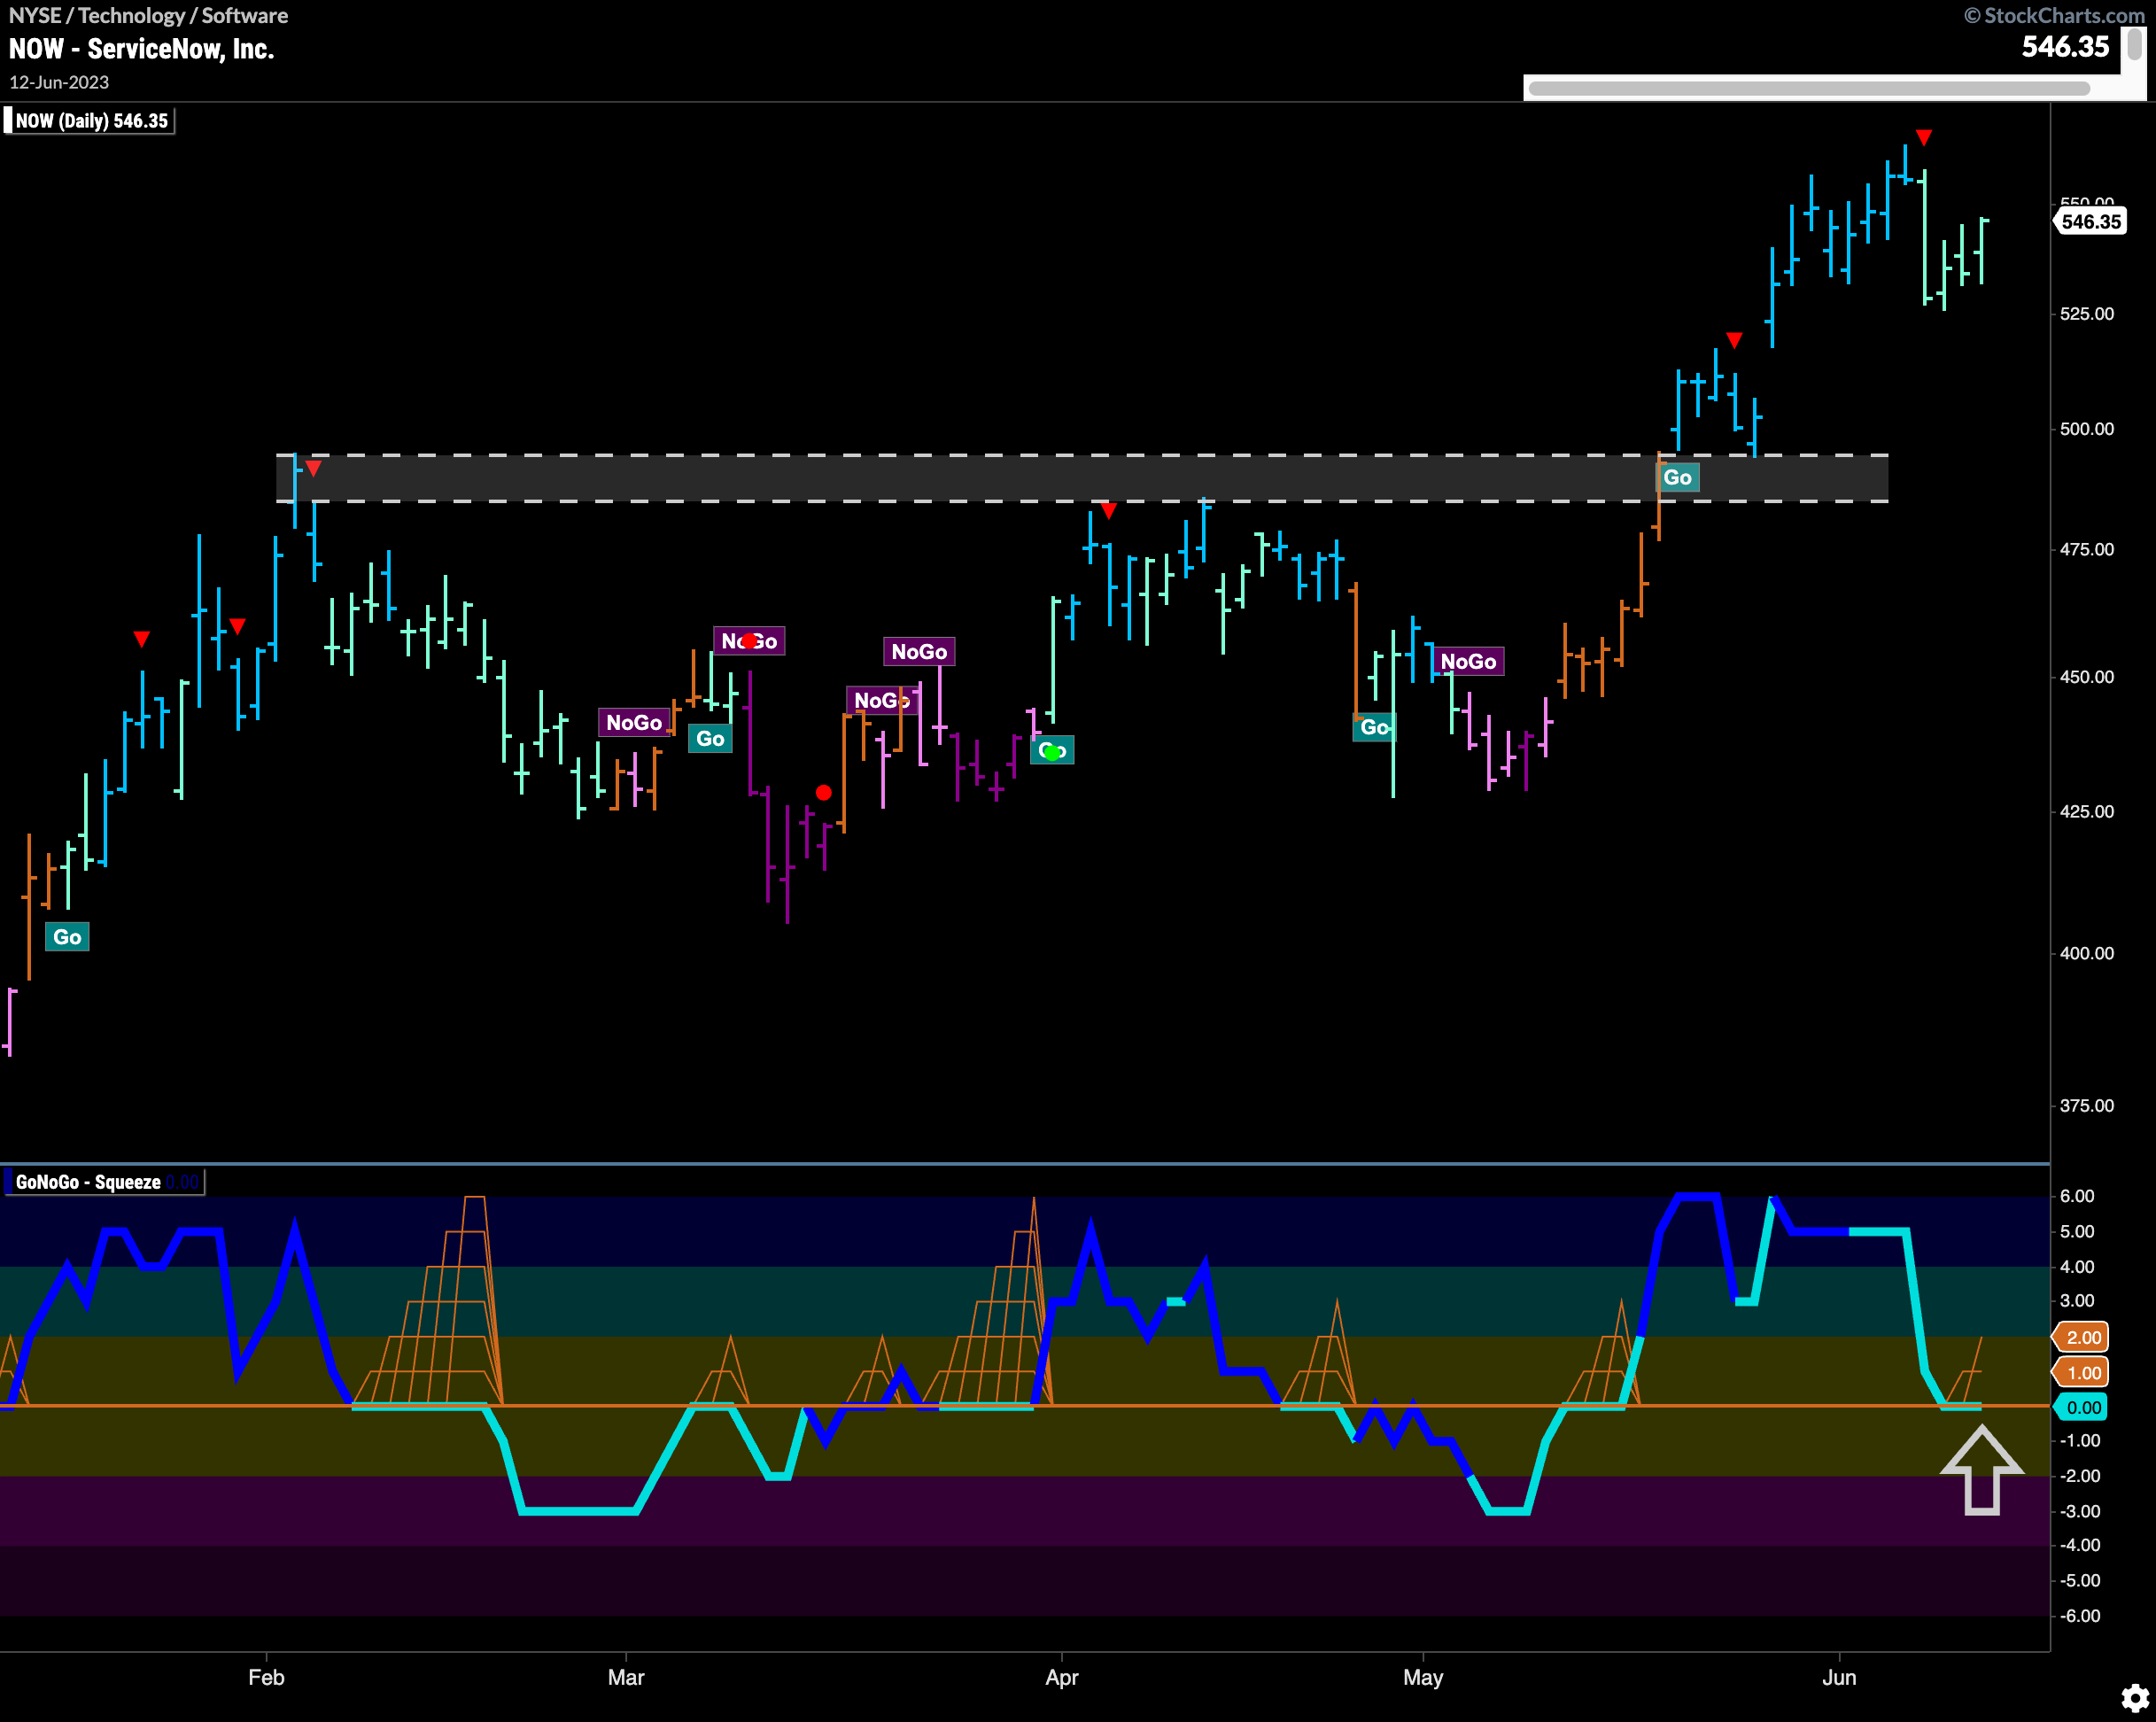

$NOW is in a “Go” trend but painting weaker aqua bars.
This comes after a new high was made and we saw the GoNoGo Chart flag a Go Countertrend Correction Icon (red triangle). This tipped us off to the fact that price may struggle in the short term. Price has fallen from the high and now we see GoNoGo Oscillator testing the zero line from above. We will look for it to find support at this objective level and if it does then we will know that the “Go” trend is healthy, and that momentum is resurgent in the direction of the trend. We will see a Go Trend Continuation Icon (green circle) under the price bar if this happens. We would then look for price to make an attempt at a new higher high.


