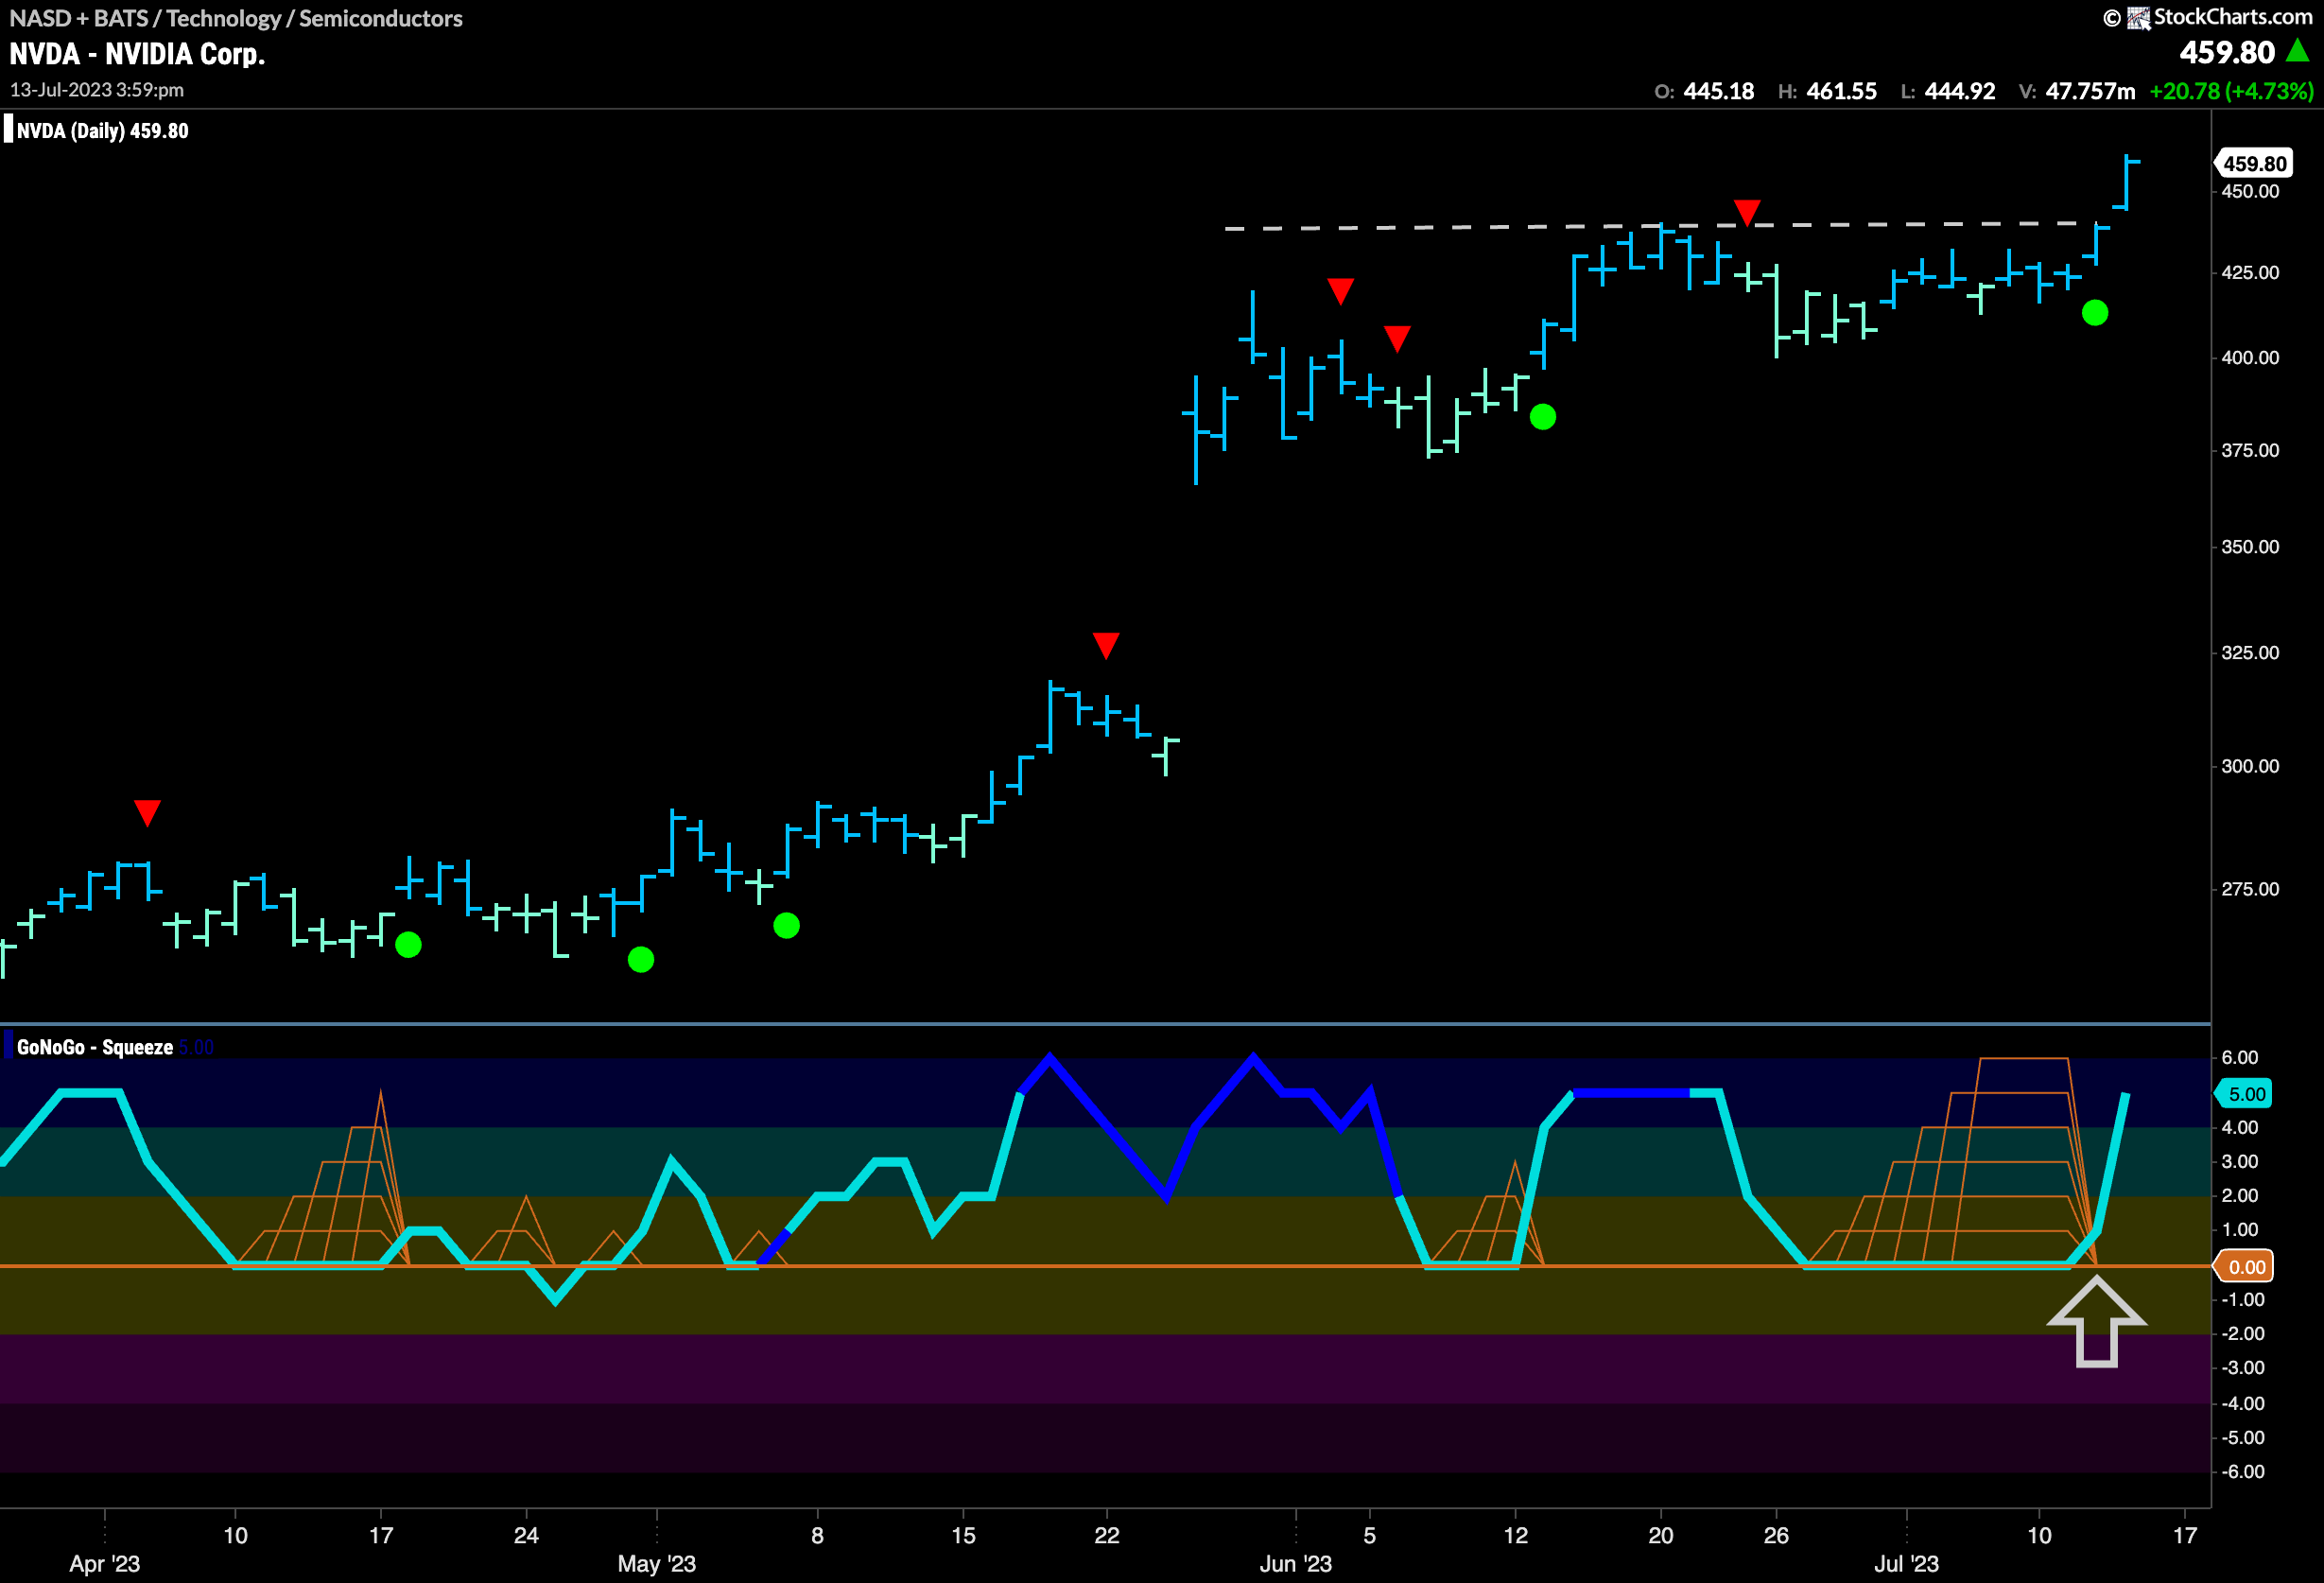

The “Go” trend has been very strong for $NVDA.
$NVDA entered a “Go” trend in January at less than $170. Now, it is trading at almost $460. Can it go higher still? This week we saw strong blue “Go” bars as price broke above horizontal resistance. This mostly sideways consolidation/correction came as investors digested gains and GoNoGo Charts flagged Go Countertrend Correction Icons (red arrows). This price action caused GoNoGo Oscillator to fall to the zero line where it stayed, allowing the climbing grid of GoNoGo Squeeze to rise to its Max. We were watching in which direction the oscillator would break out of the Squeeze and this break was decisive in the positive direction. Now, with momentum resurgent in the direction of the “Go” trend, we see a Go Trend Continuation Icon (green circle) under the price bar as price hits a new high.


