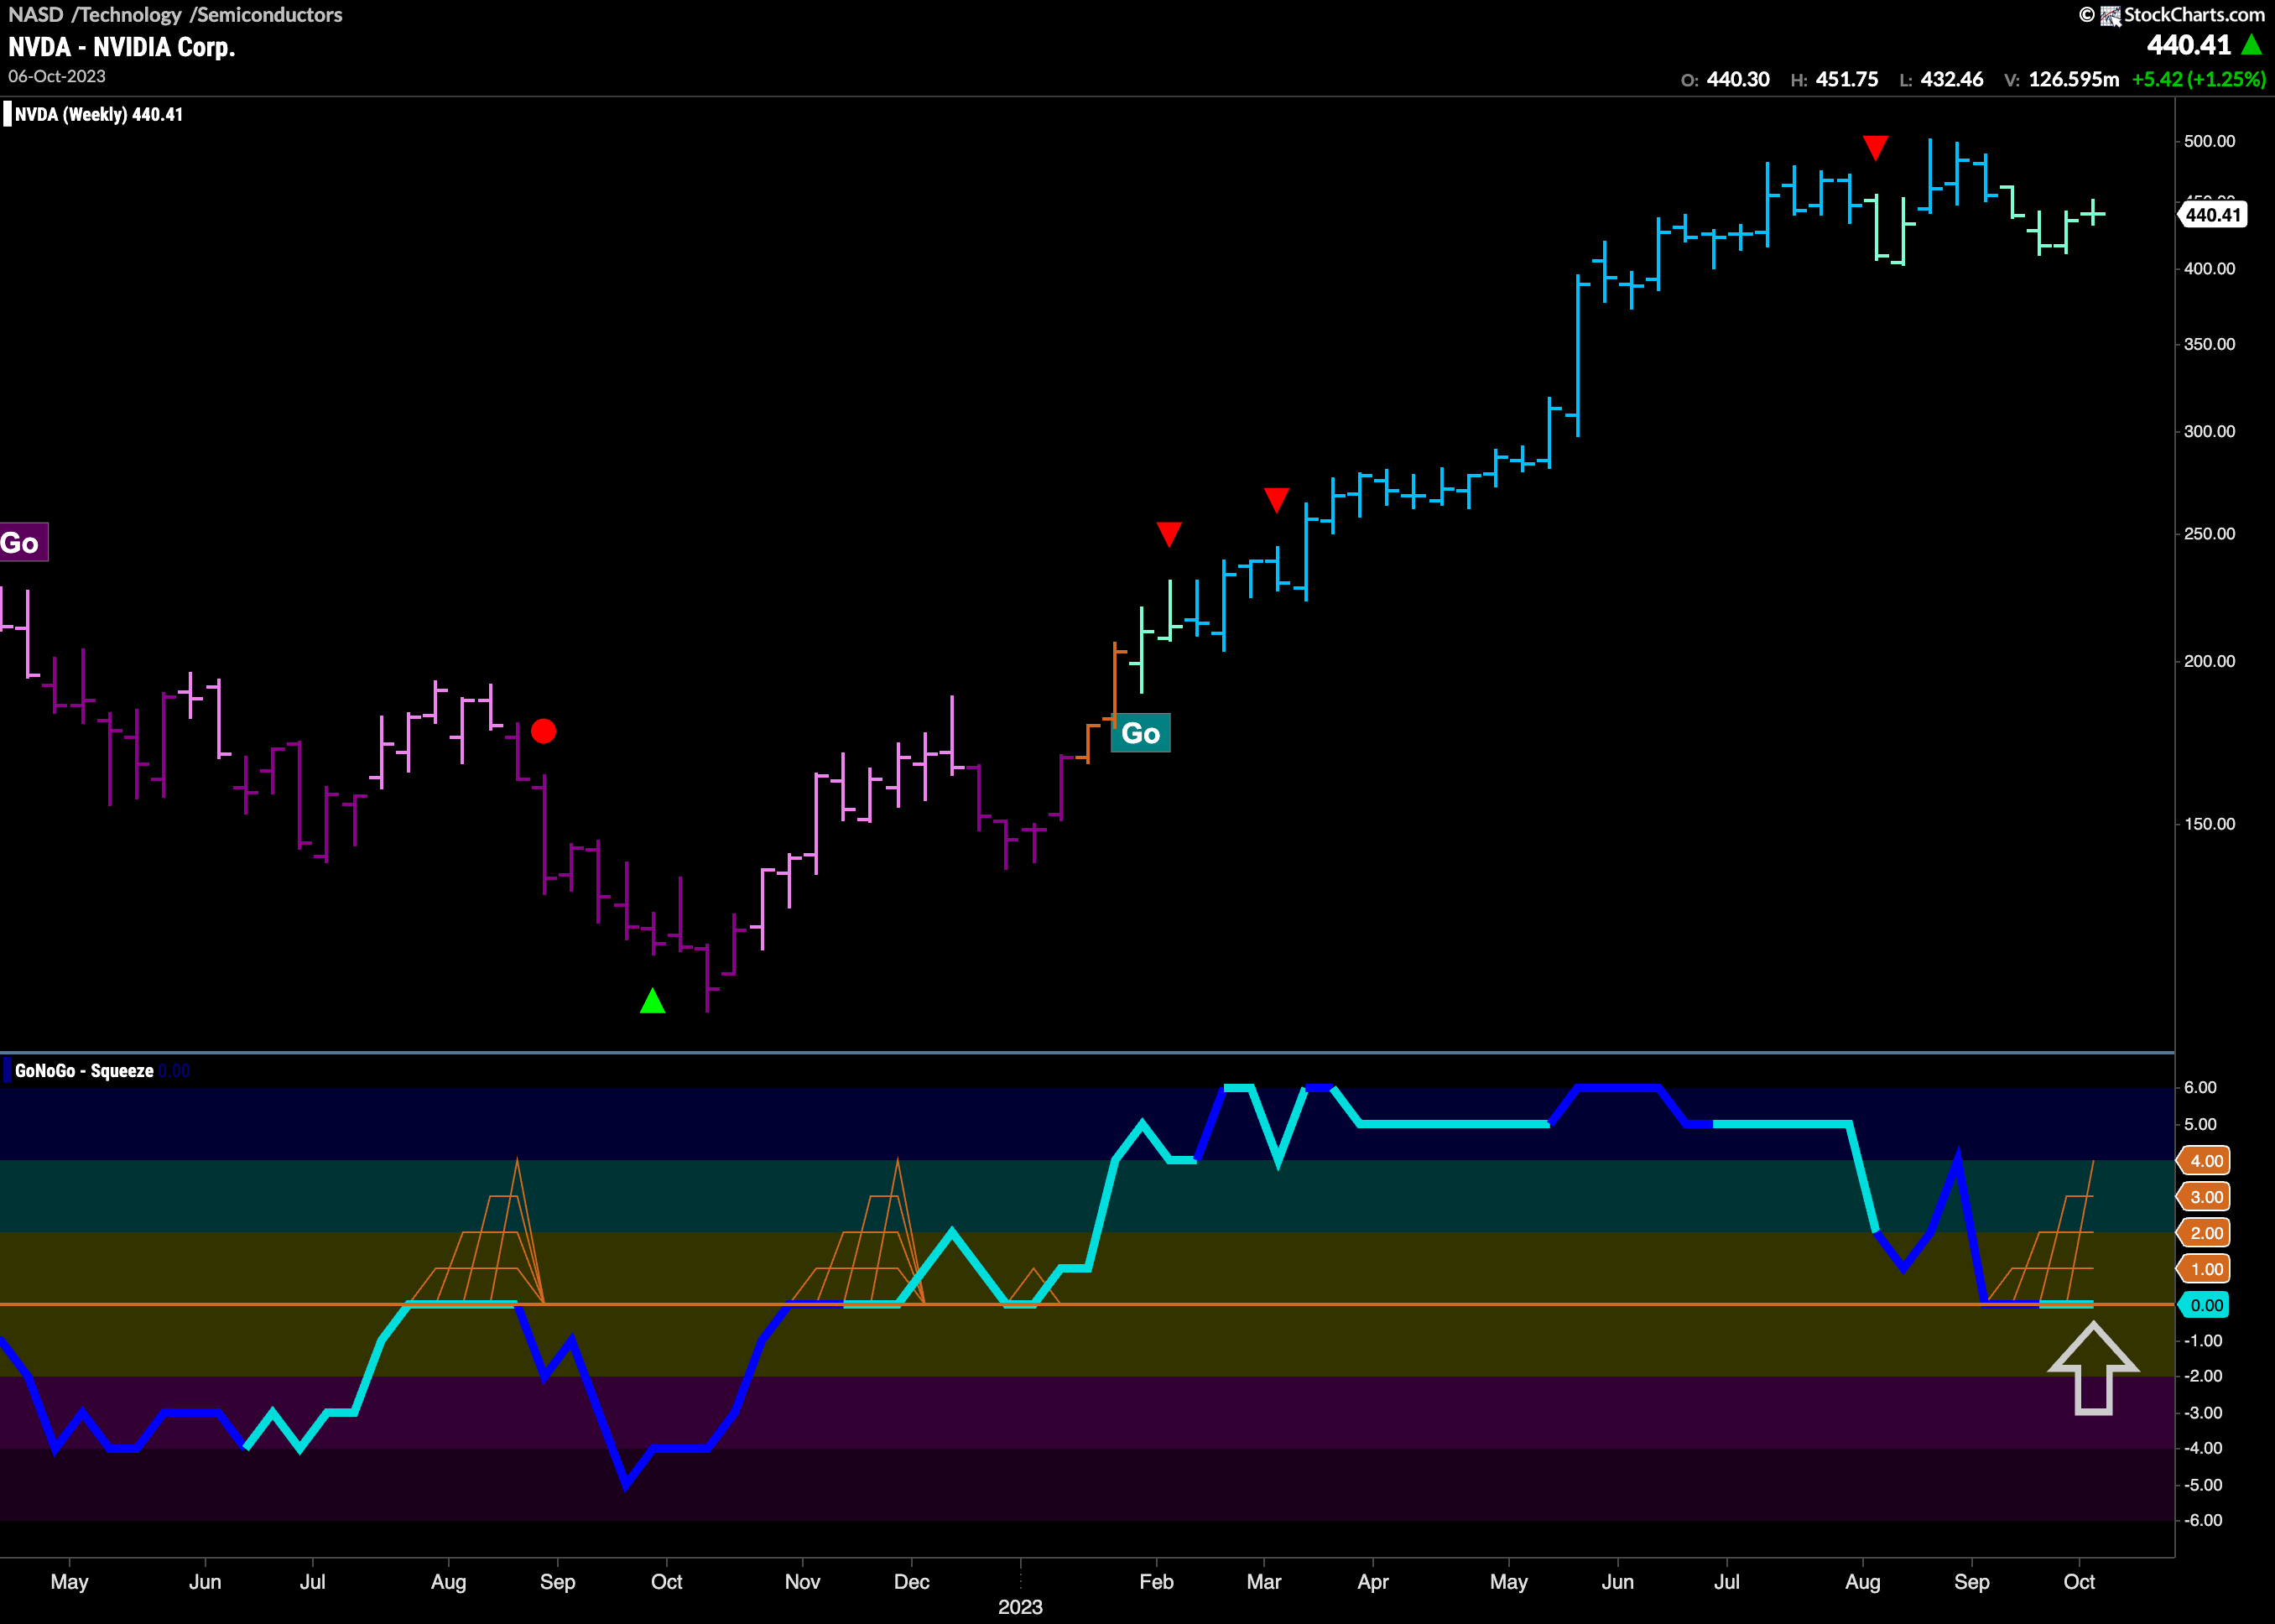

$NVDA has been in a strong “Go” trend for most of this year when looking at a weekly chart.
We can see that during this time, GoNoGo Oscillator has been in positive territory. Now, after a Go Countertrend Correction Icon (red arrow) in August, GoNoGo Oscillator has fallen to test the zero line from above. GoNoGo Trend has also shown the trend to have weakened as it paints a whole month of aqua bars. With GoNoGo Oscillator resting at the zero line we see the climbing grid of GoNoGo Squeeze climbing and this reflects the apparent tug of war between buyers and sellers at this level. For the “Go” trend to continue on the weekly basis, it will be important to see the GoNoGo Squeeze broken into positive territory. This will tell us that momentum is resurgent in the direction of the “Go” trend, and we would expect an attack on a new higher high. If the oscillator fails to find support at zero, that would give us reason to believe a deeper correction could be on the cards.


