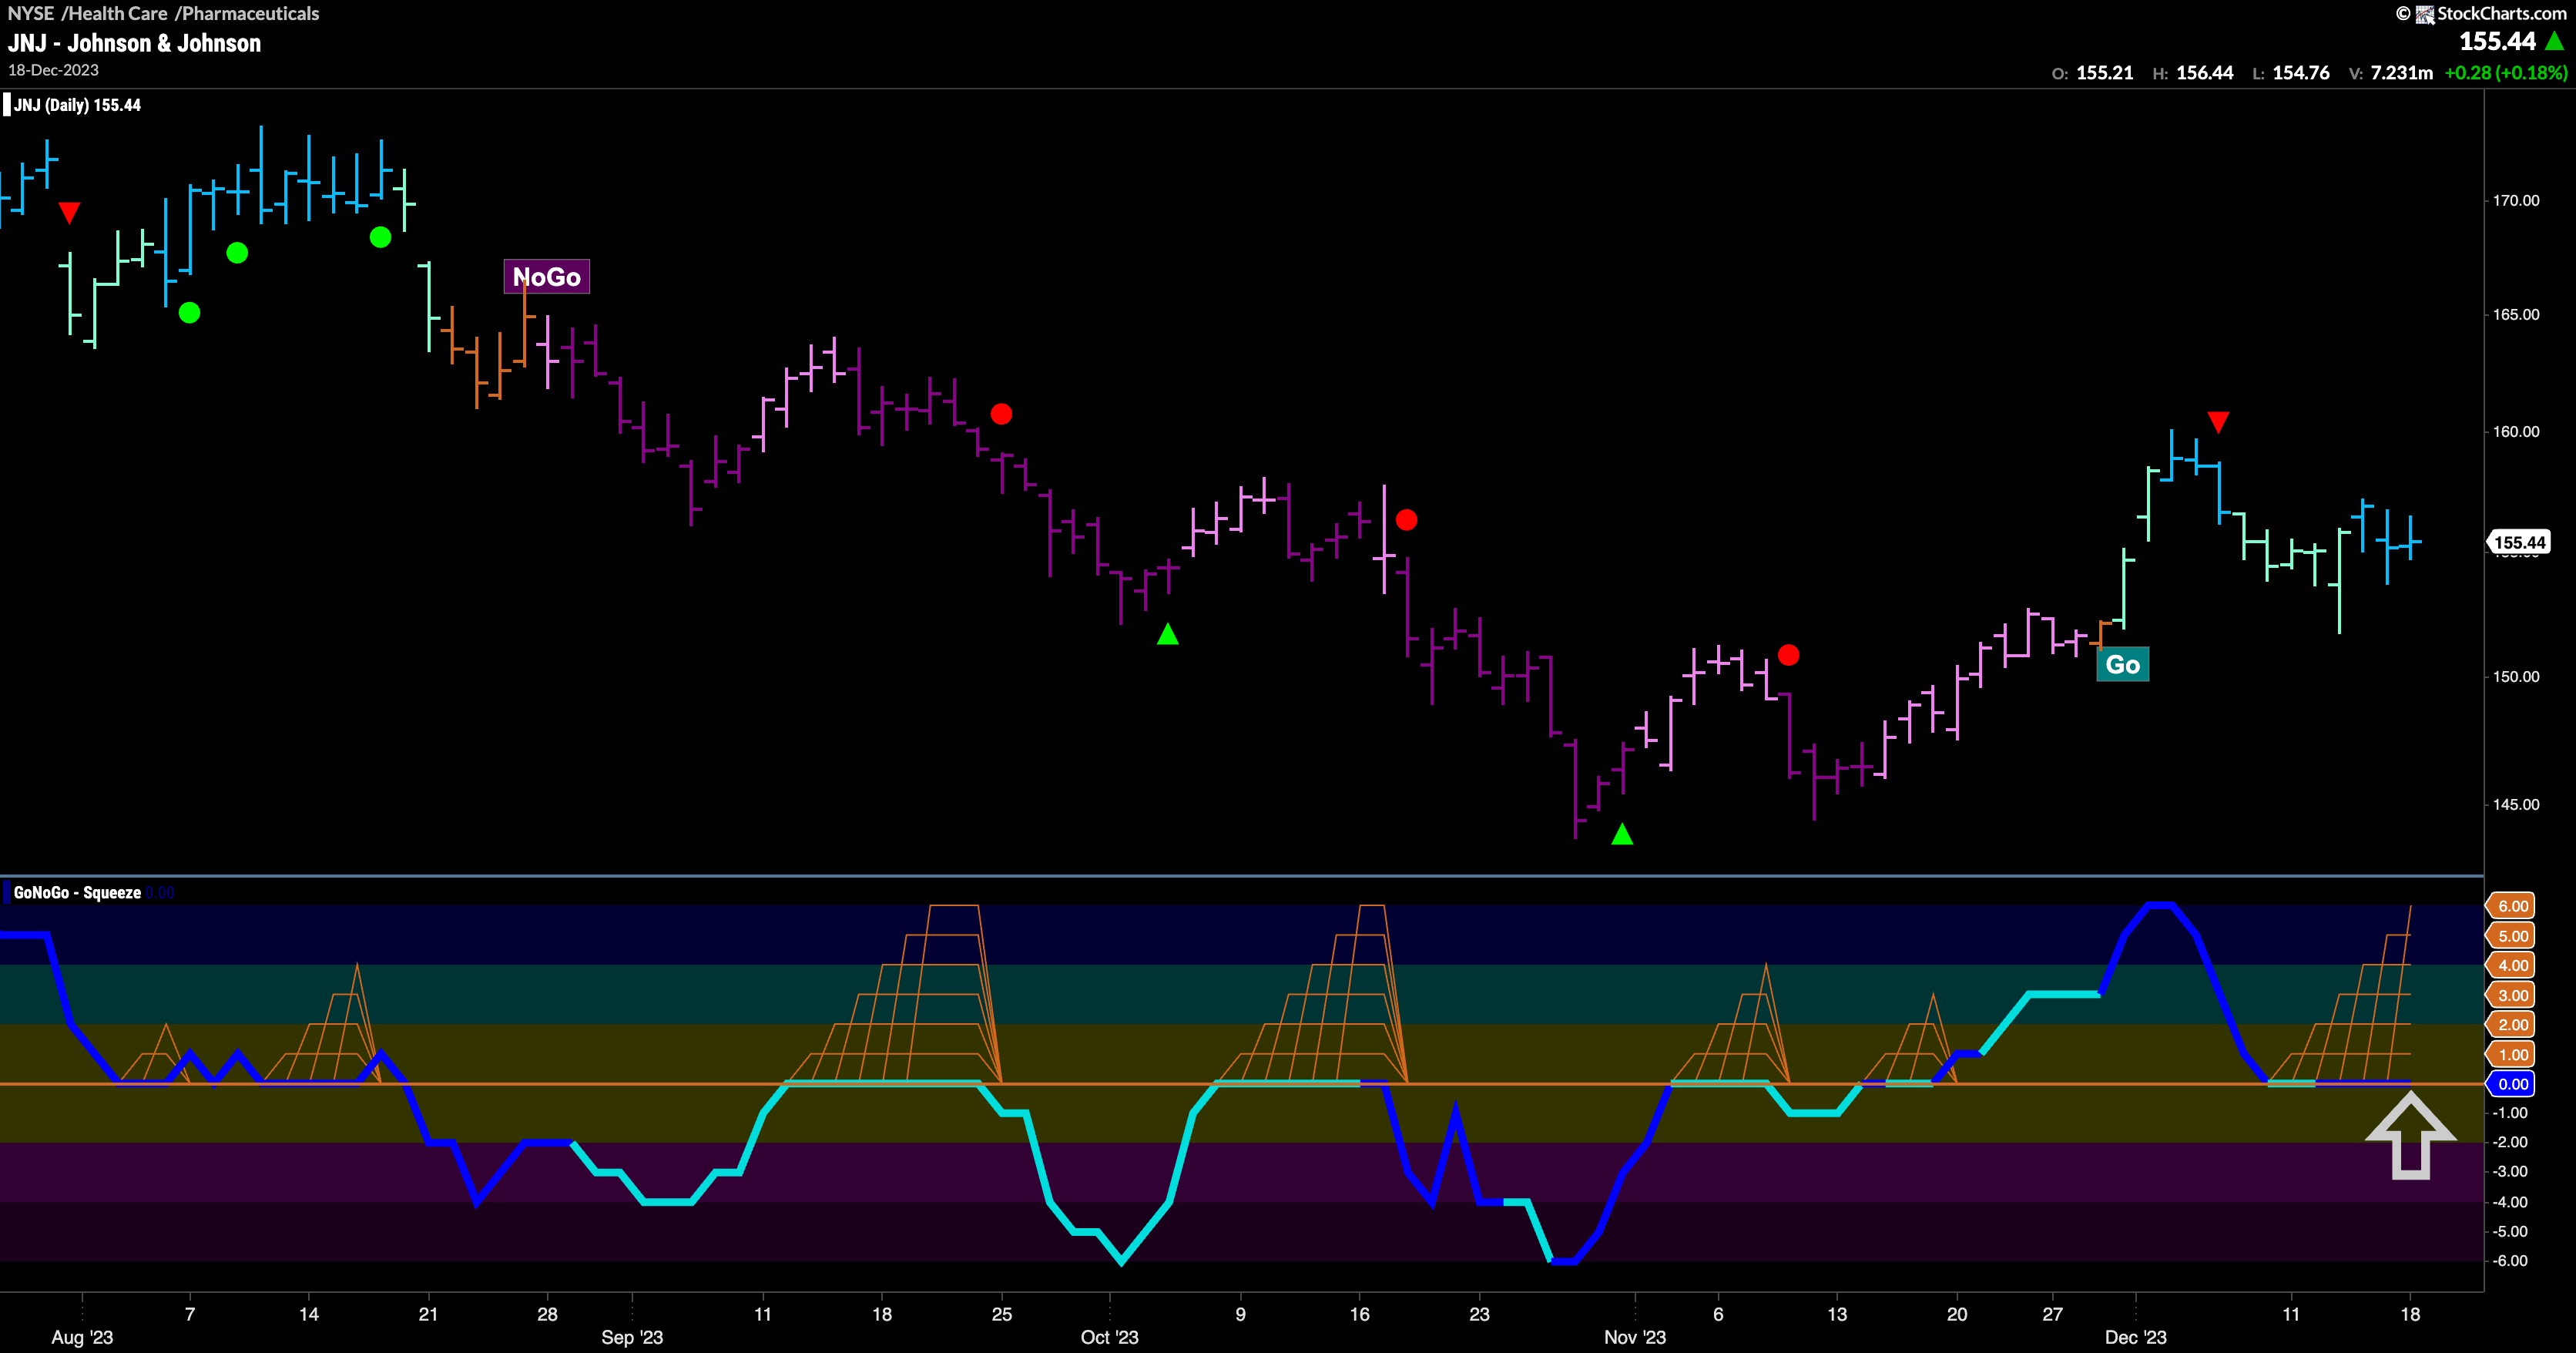

At the very end of November, GoNoGo Trend identified a “Go” trend for $JNJ.
Before that, as price found a base, GoNoGo Oscillator rose to test the zero line from below and then broke through into positive territory. As you can see, “things were different this time”. Previously during the “NoGo” trend, each time the oscillator had rallied to test the zero line it had been rejected, several times out of the Max GoNoGo Squeeze. This last time, GoNoGo Oscillator broke above zero. GoNoGo Trend then rewarded the rally in price by recognizing a “Go” trend which took price to a new higher high. After that most recent high however, we saw a Go Countertrend Correction Icon (red arrow) suggesting that price may struggle to go higher in the short term. Price has duly pulled back causing GoNoGo Oscillator to retreat to test the zero line once more, this time from above. Having remained at zero for several bars, we see another Max GoNoGo Squeeze grid reflecting the tug of war between buyers and sellers. If the Squeeze is broken into positive territory, we would consider this to be a sign of Go Trend Continuation and therefore and opportunity to “buy the dip”, the first of its kind, in this new “Go” trend. We would then look for price to make an attempt to set a new high.


