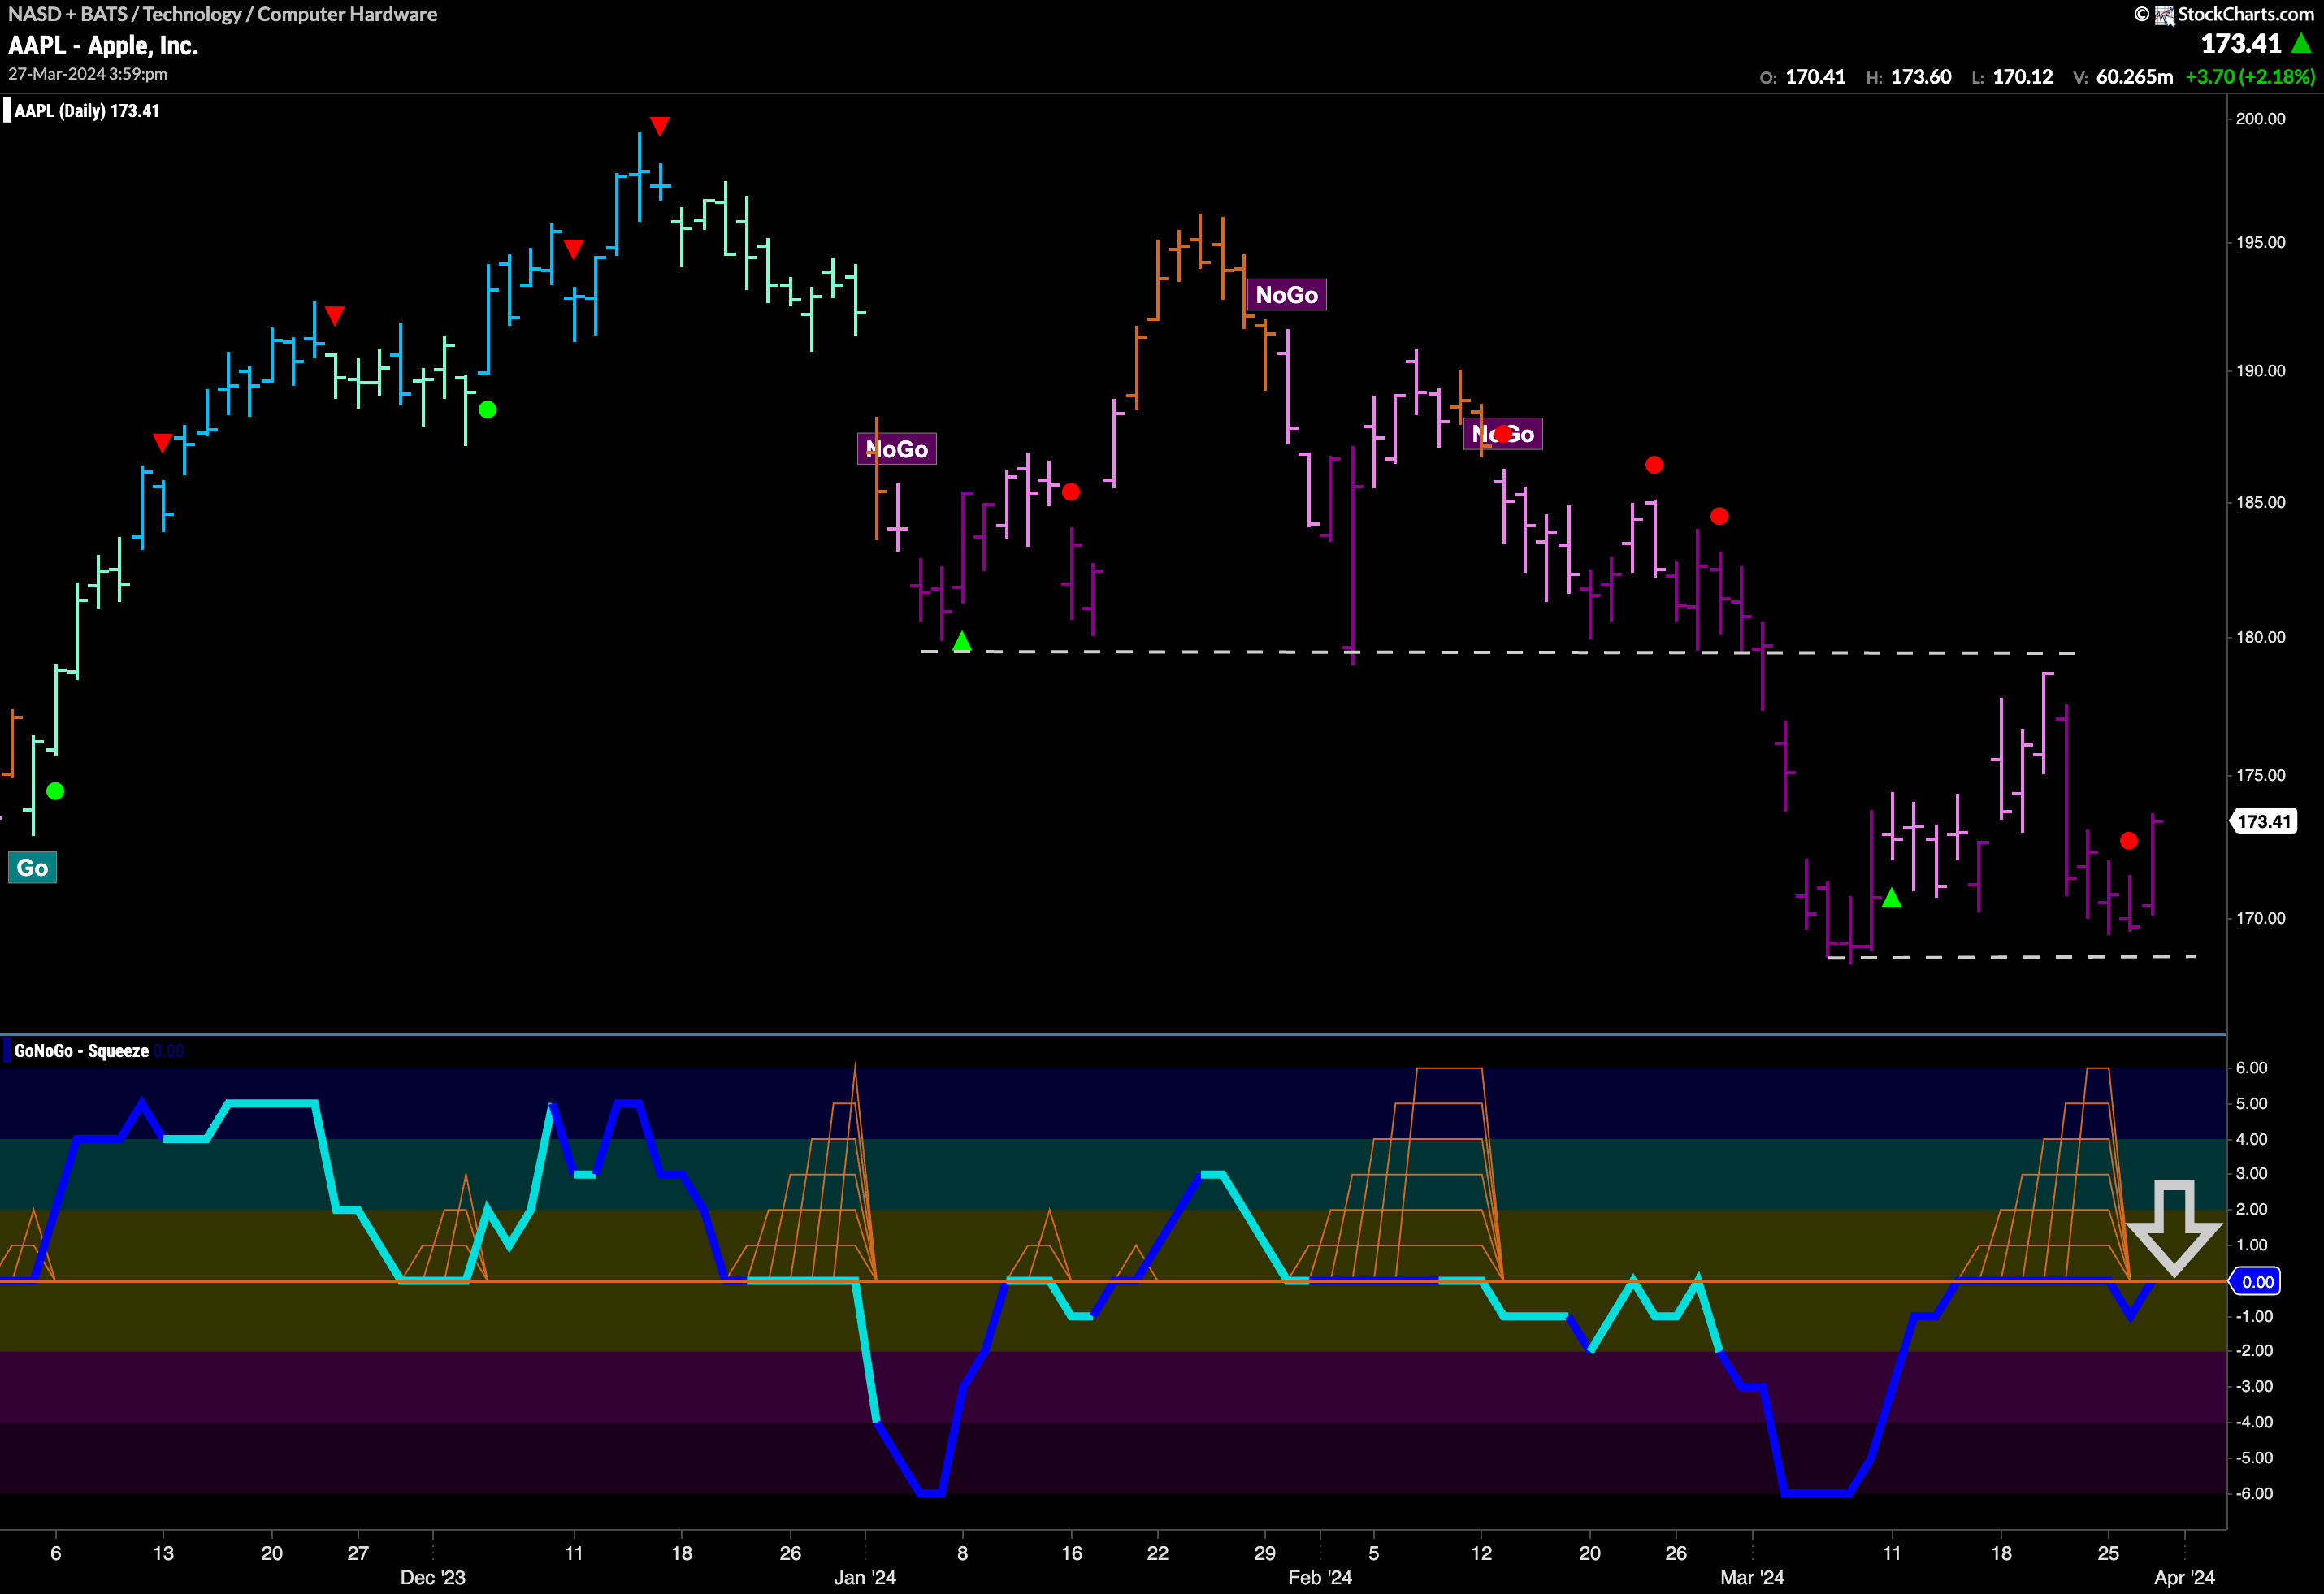

$AAPL has been in a “NoGo” trend since the beginning of the year.
We have seen a series of lower highs and lower lows with GoNoGo Oscillator primarily finding resistance at the zero line and falling away into negative territory each time it is tested. On the most recent countertrend rally we saw GoNoGo Trend paint weaker pink “NoGo” bars as price rose to test the horizontal resistance we see on the chart. During this time, GoNoGo Oscillator rose to test the zero line from below but remained there, allowing a Max GoNoGo Squeeze to build on heavy volume (dark blue oscillator). The Max GoNoGo Squeeze was broken into negative territory and we saw a NoGo Trend Continuation Icon (red circle). This likely trend continuation is because momentum is resurgent in the direction of the underlying “NoGo” trend. Yesterday’s bar saw the oscillator return to test the zero line from below again and so we will watch to see if this level continues to act as resistance. If it does, and the oscillator falls into negative territory again, we will look for price to make an attack on a new low.


