Good morning and welcome to this week’s Flight Path. The equity “Go” trend continued this week and we saw strong blue bars as the week ended. Price did falter this week though and we did not see a new higher high as price fell back from the most recent high. GoNoGo Trend shows that treasury bond prices fell into a strong “NoGo” trend with a purple bar at the end of the week. There were no such problems for commodities as we saw an uninterrupted string of strong blue “Go” bars for the second week. The dollar was also able to hold on to its “Go” trend but we did see weakness this week with the indicator painting aqua bars.
Equities Maintain “Go” Trend but Will Look for Support this Week
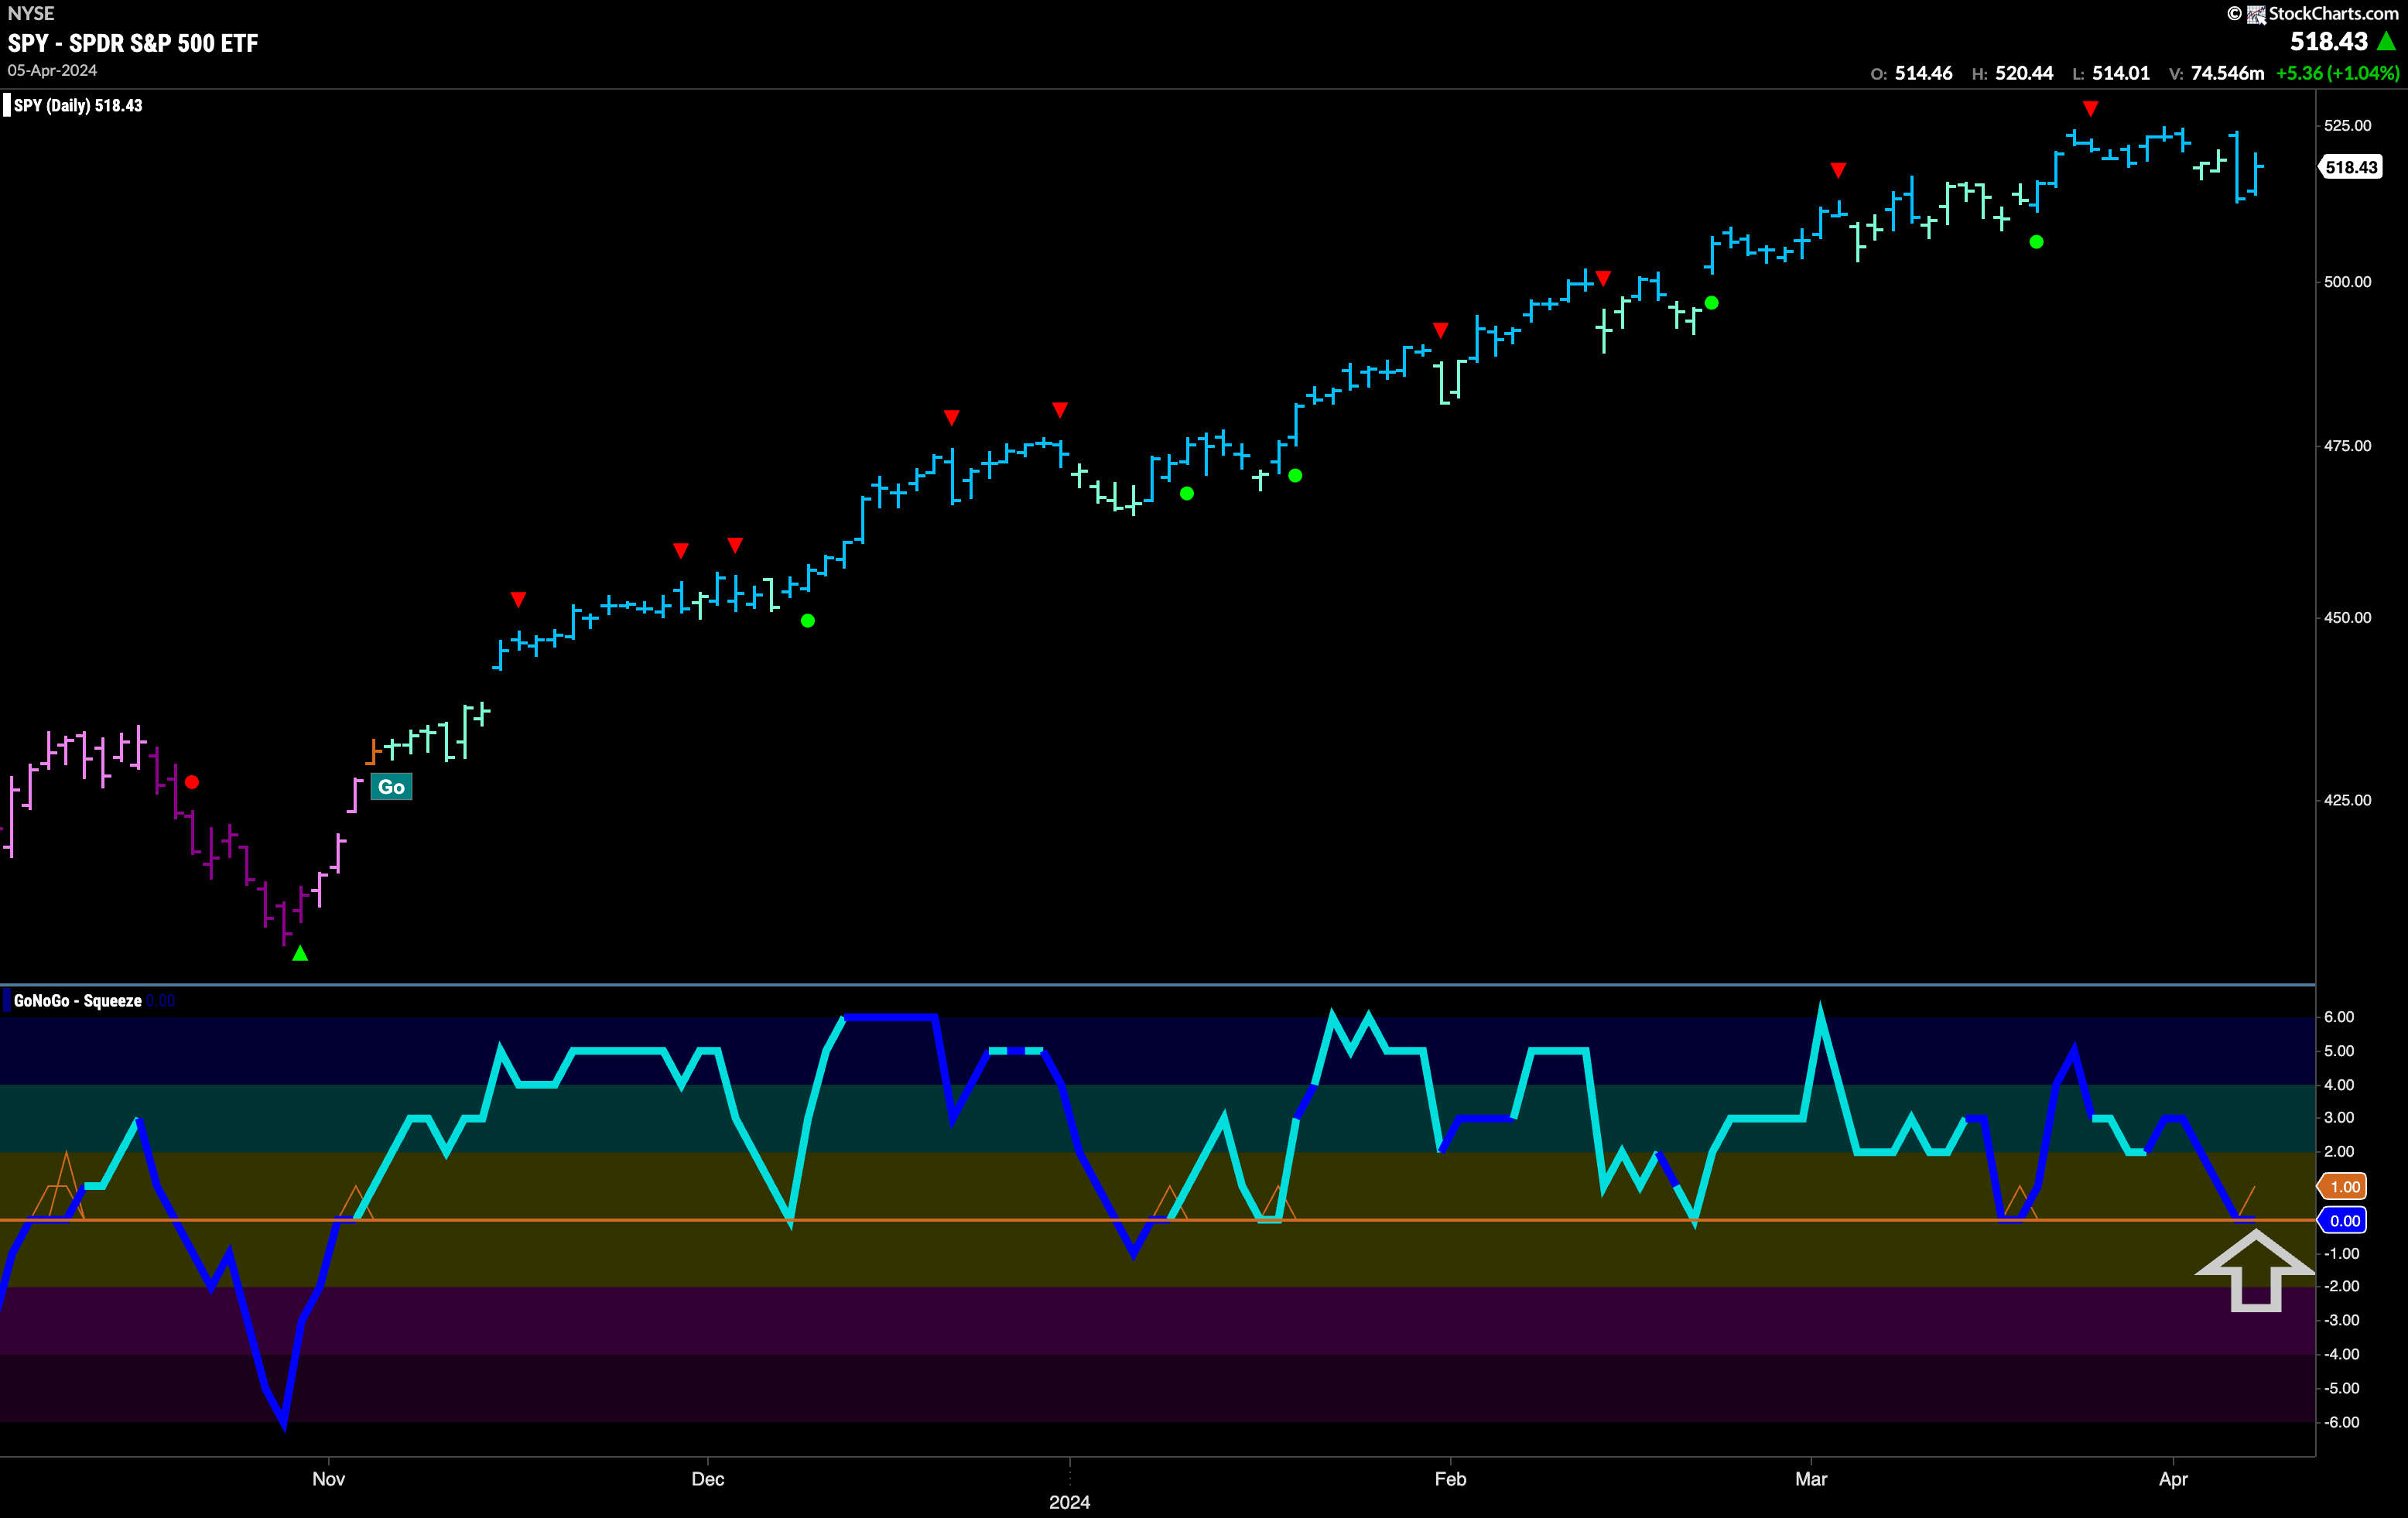
Two weeks ago we saw a Go Countertrend Correction Icon (red arrow) that told us price may struggle to go higher in the short term. Indeed, since then, we have seen price move sideways and then fall from those highs. After a few weaker aqua bars GoNoGo Trend was able to paint stronger blue “Go” bars as the week ended. GoNoGo Oscillator fell to test the zero line from above and it will be important to pay attention to whether this level holds as support. If it does, and the oscillator can rally back into positive territory then we will look for trend continuation and expect price to make an attack on a new higher high. If the zero line doesn’t hold, then we may well see a deeper correction. We also note that volume was heavy this past week.
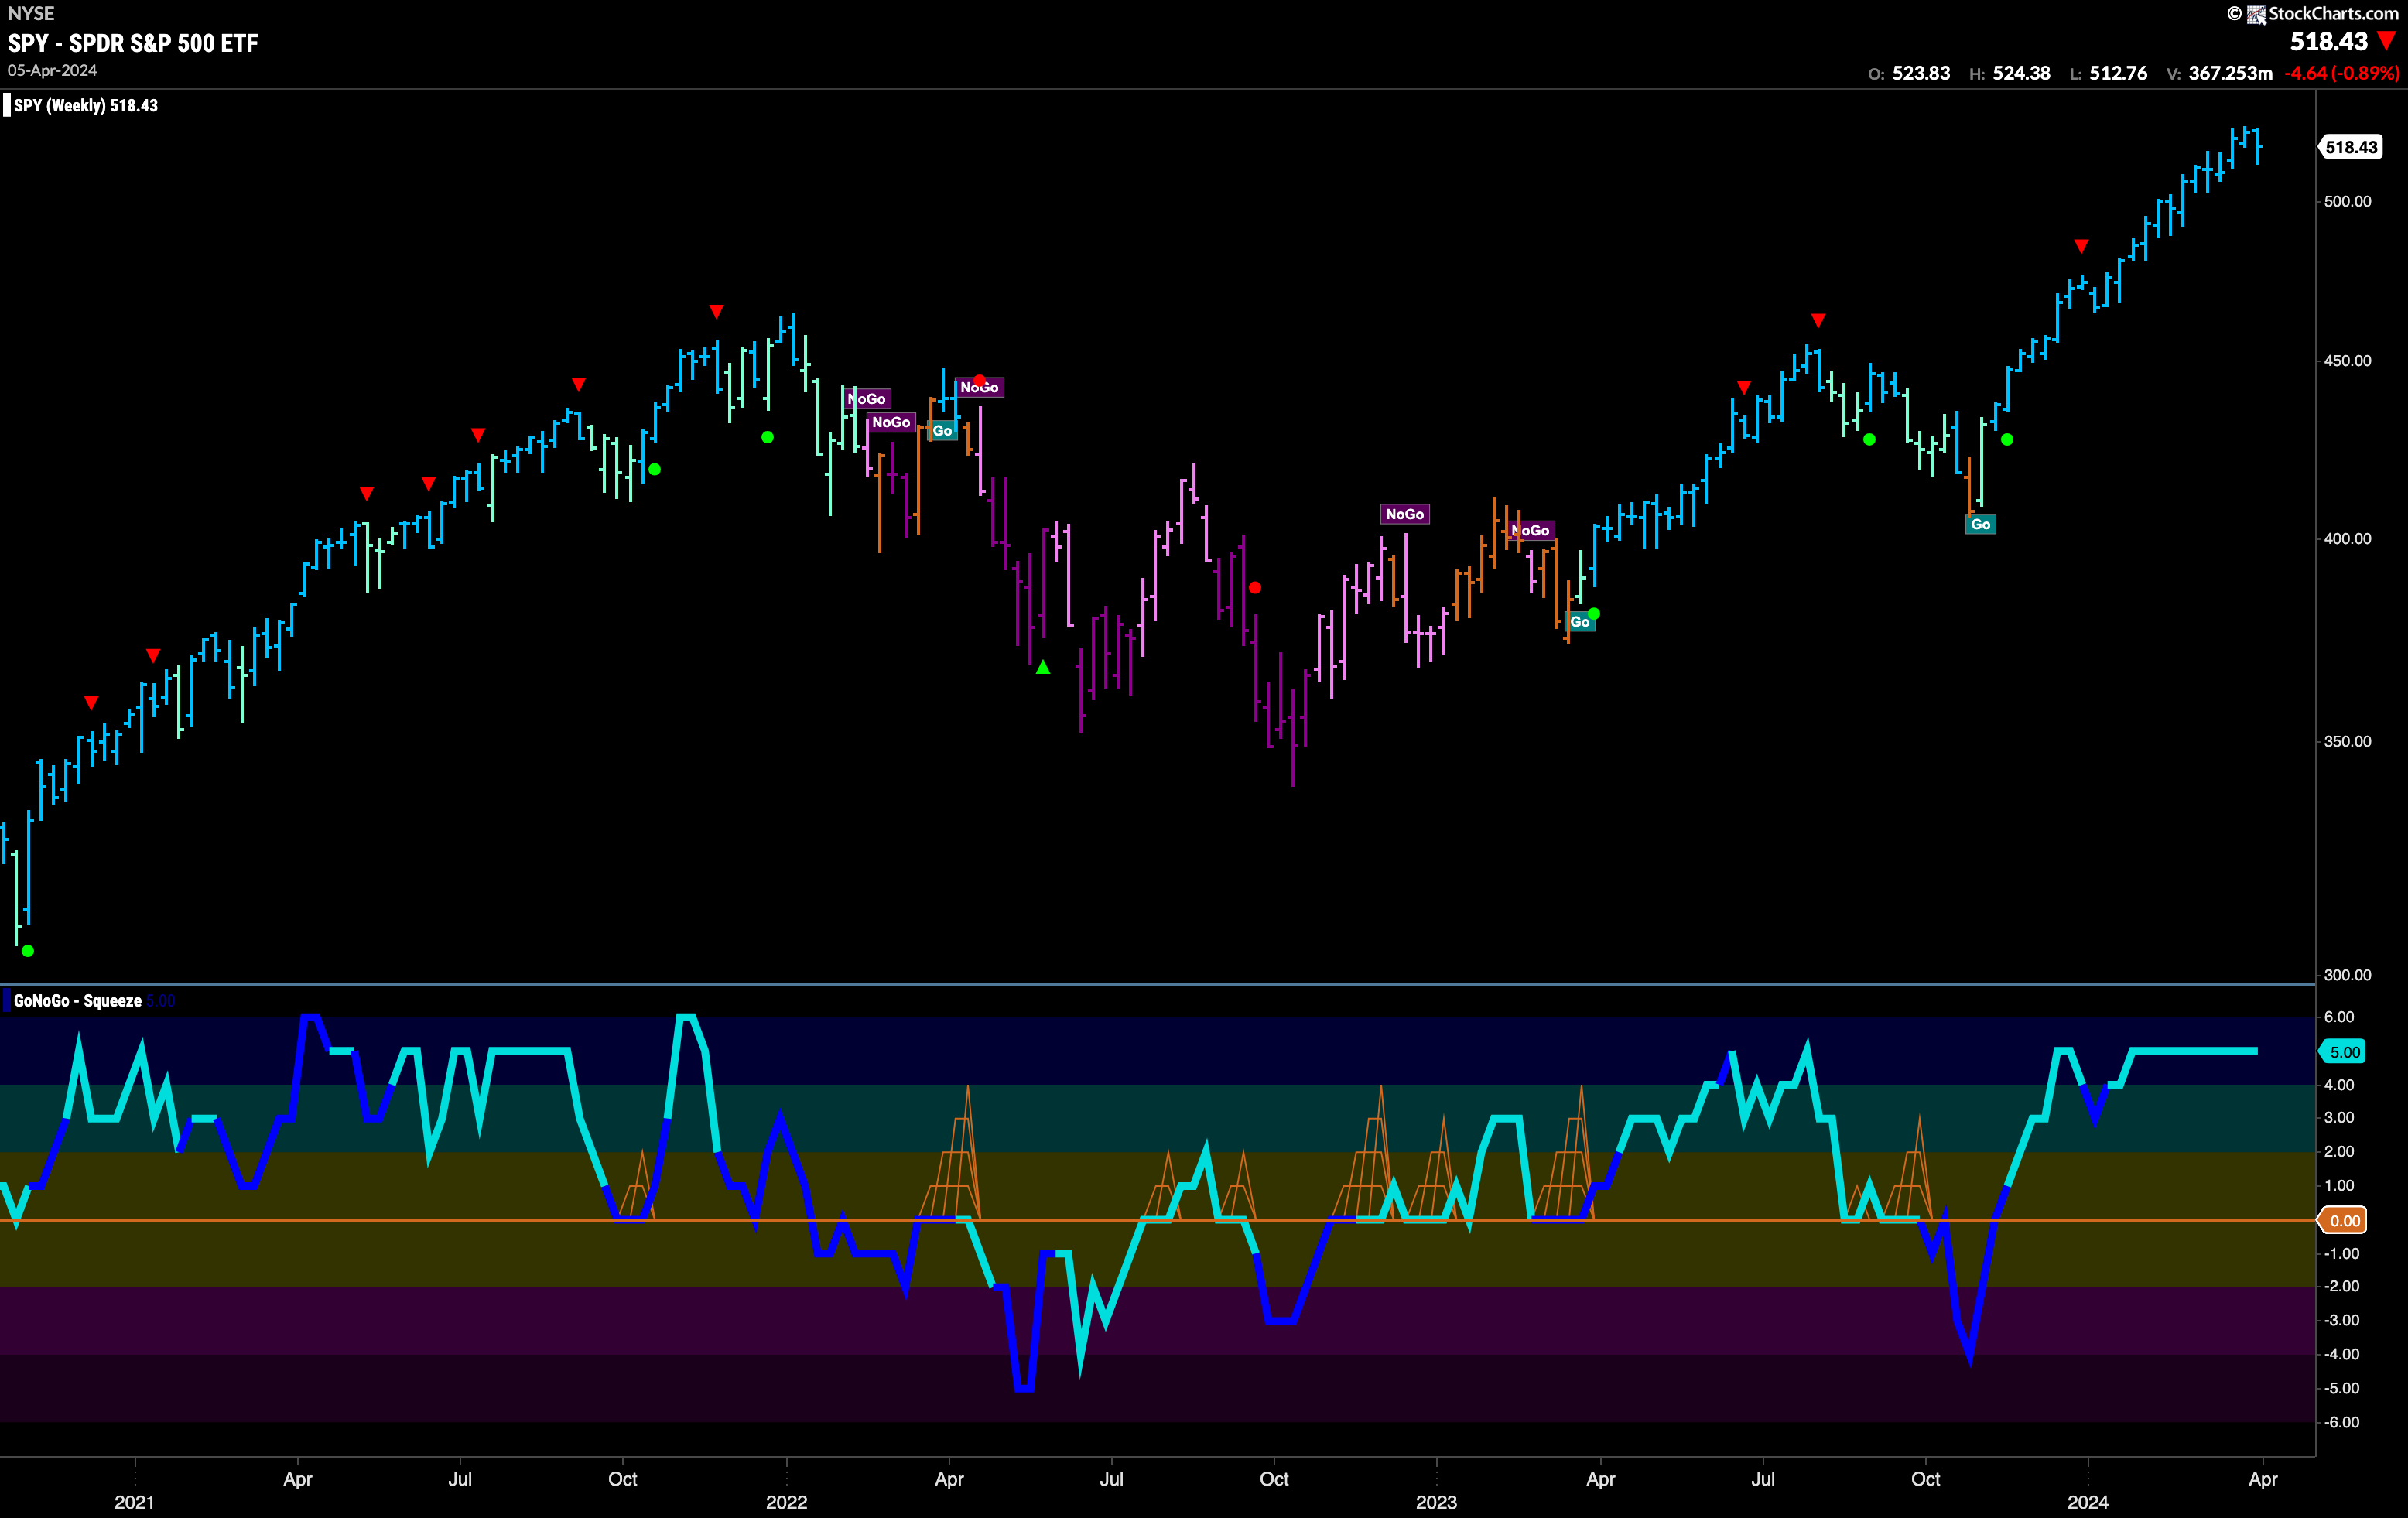
No weekly higher high this week after the troubles we outlined in the daily chart. However, another strong blue “Go” bar tells us that this trend is not yet in any trouble. We turn our eye to the oscillator panel and see that it is still resting in overbought territory at a value of 5. This has been an extended period of overbought conditions and this speaks to the enthusiasm we have seen in this market. As noted in prior weeks, we will watch for the oscillator to fall out of overbought territory and when it does a Go Countertrend Correction Icon will warn us of a short term pause or pull back.
Rates Make Higher High
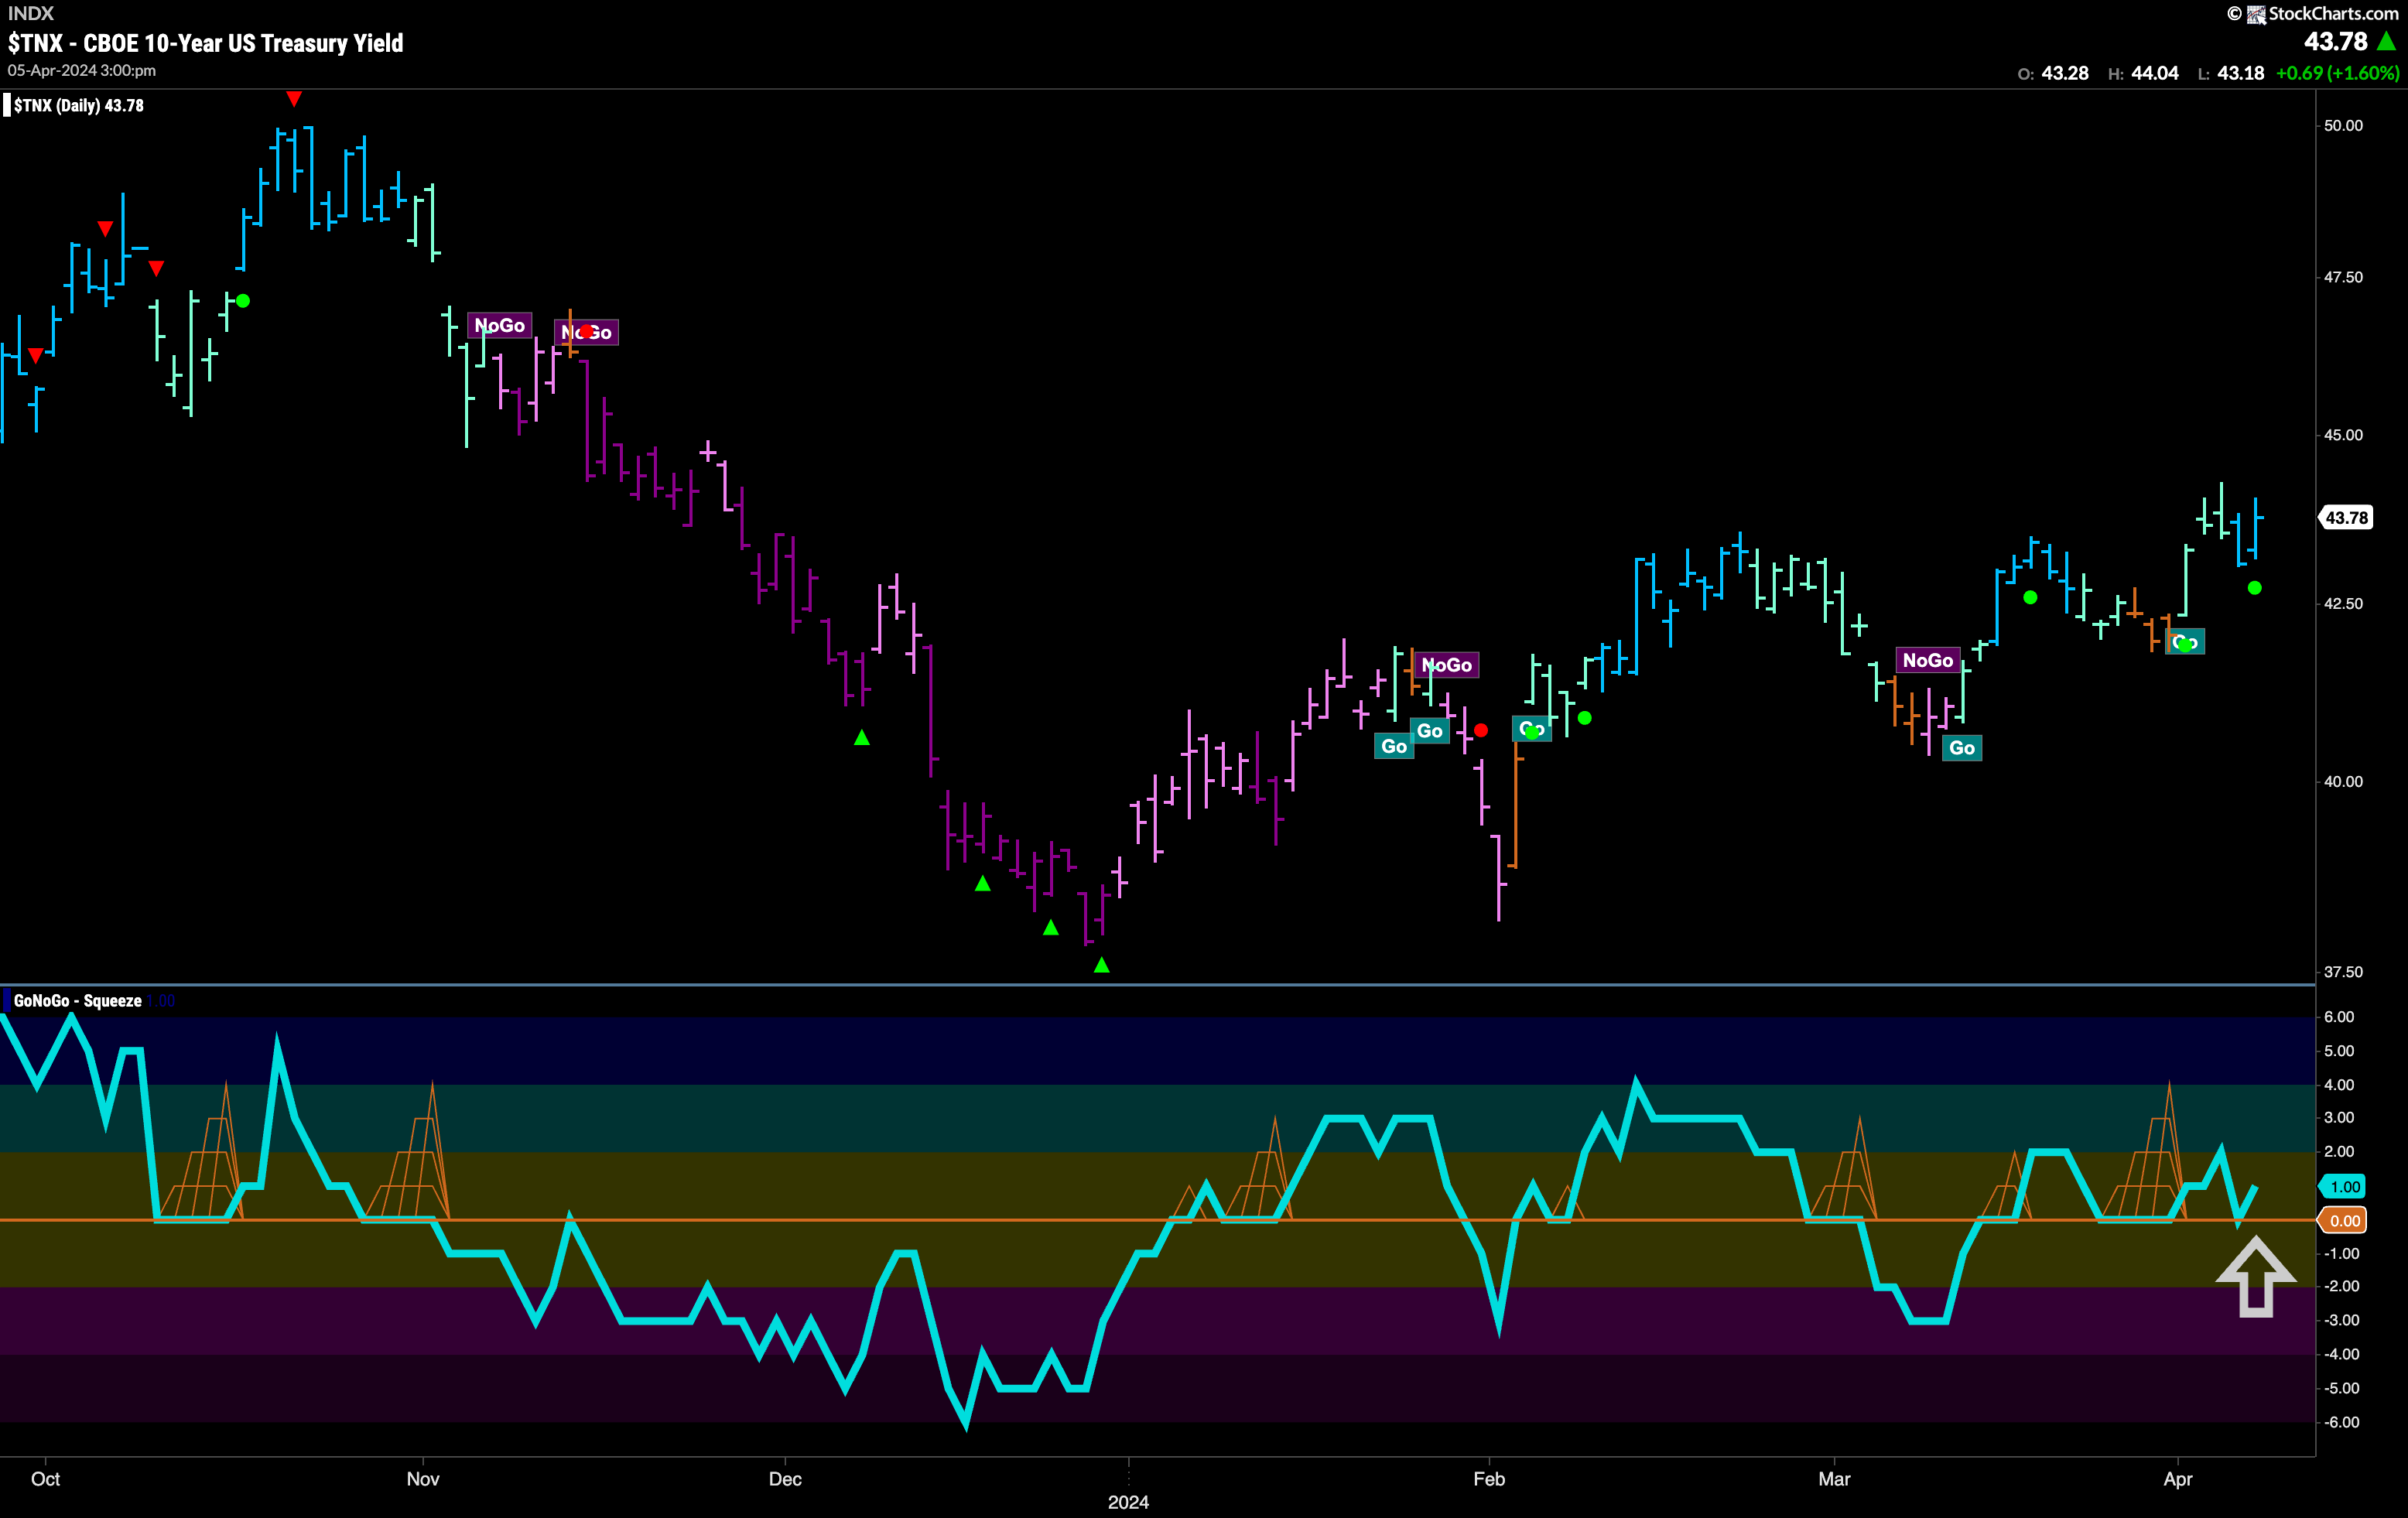
Treasury rates bounced back this week and set a higher low as amber “Go Fish” bars gave way to more “Go” colors. This happened as GoNoGo Oscillator found support at the zero line. It has quickly retested that level and found support again as GoNoGo Trend paints stronger “Go” bars and we see signs of trend continuation (green circle). With strong blue “Go” bars and GoNoGo Oscillator in positive territory we will watch for price to potentially go higher still this week.
Dollar “Go” Trend Weakens
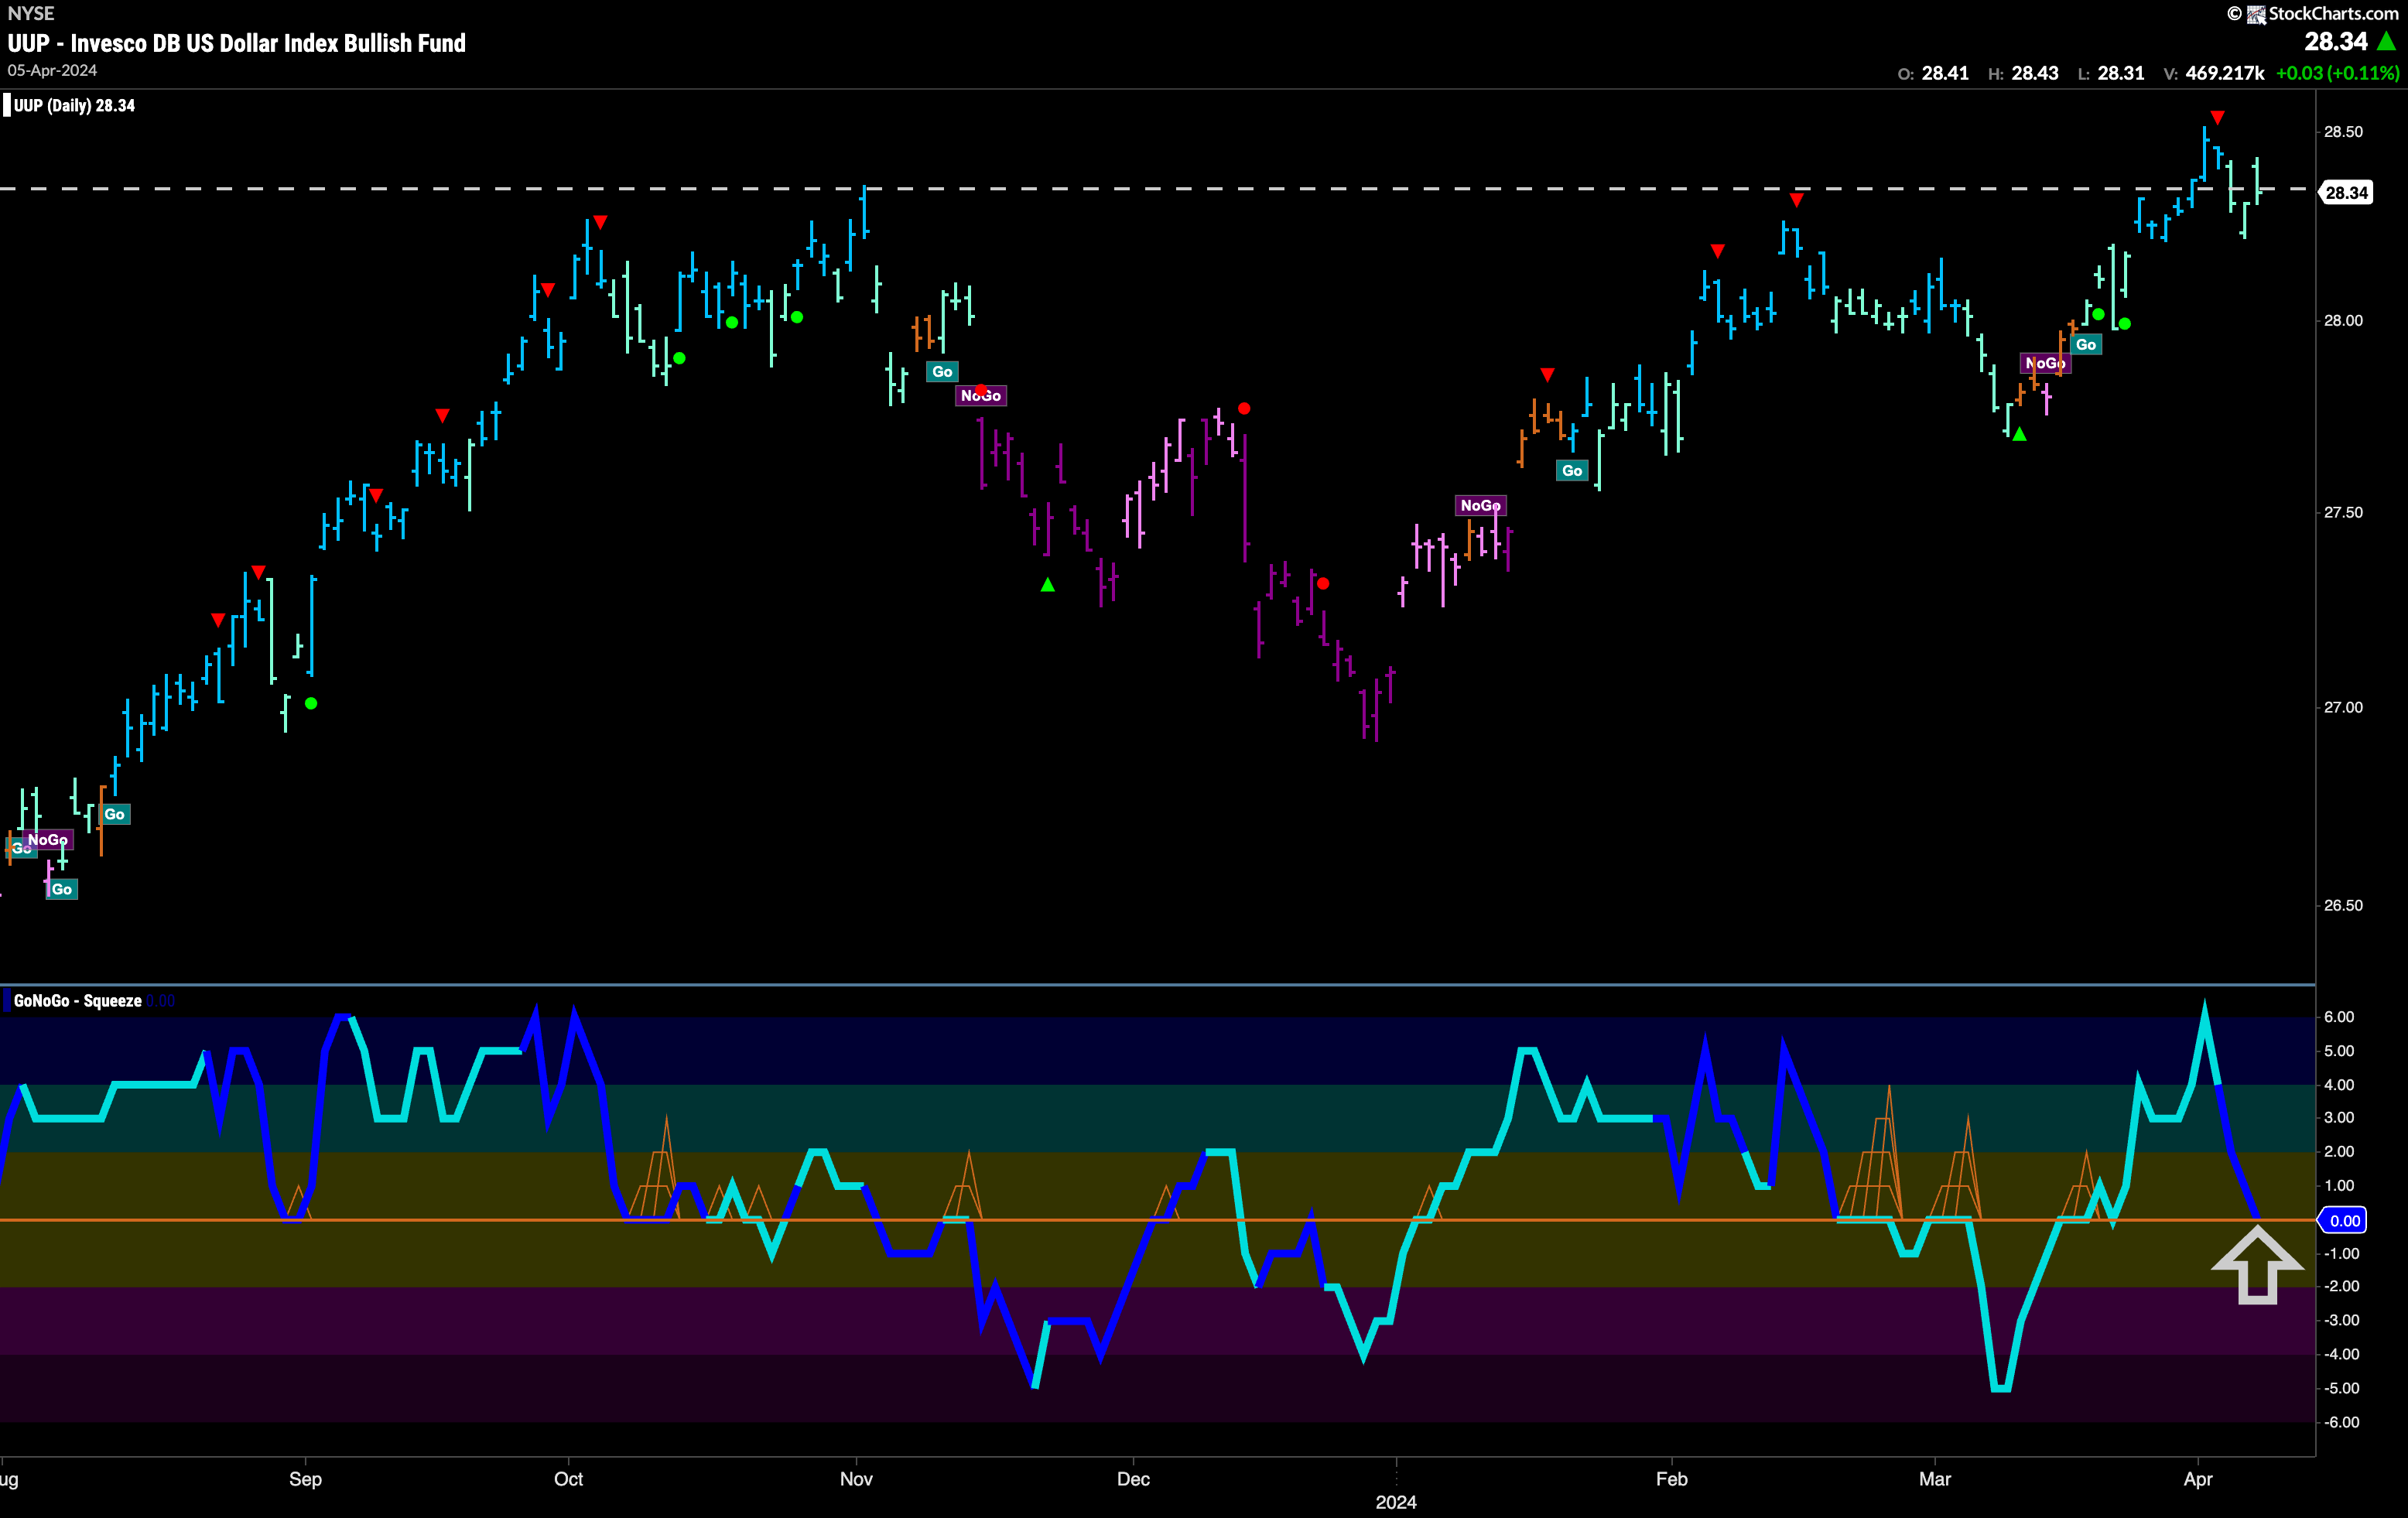
We saw the dollar trend weaken as GoNoGo Trend painted weaker aqua bars in the second half of the week. There is a strong level on the chart that has been resistance in the past. We will look at this level as we go forward. If price can stay at or above this level then the concept of polarity tells us that this will become support. If that happens then we will look for price to make an attack on new highs. As price struggles with this level, GoNoGo Oscillator has fallen to test the zero line and volume is heavy. We will watch to see if the oscillator finds support here and bounces back into positive territory. If it does, then we will be able to say that momentum is resurgent in the direction of the “Go” trend.
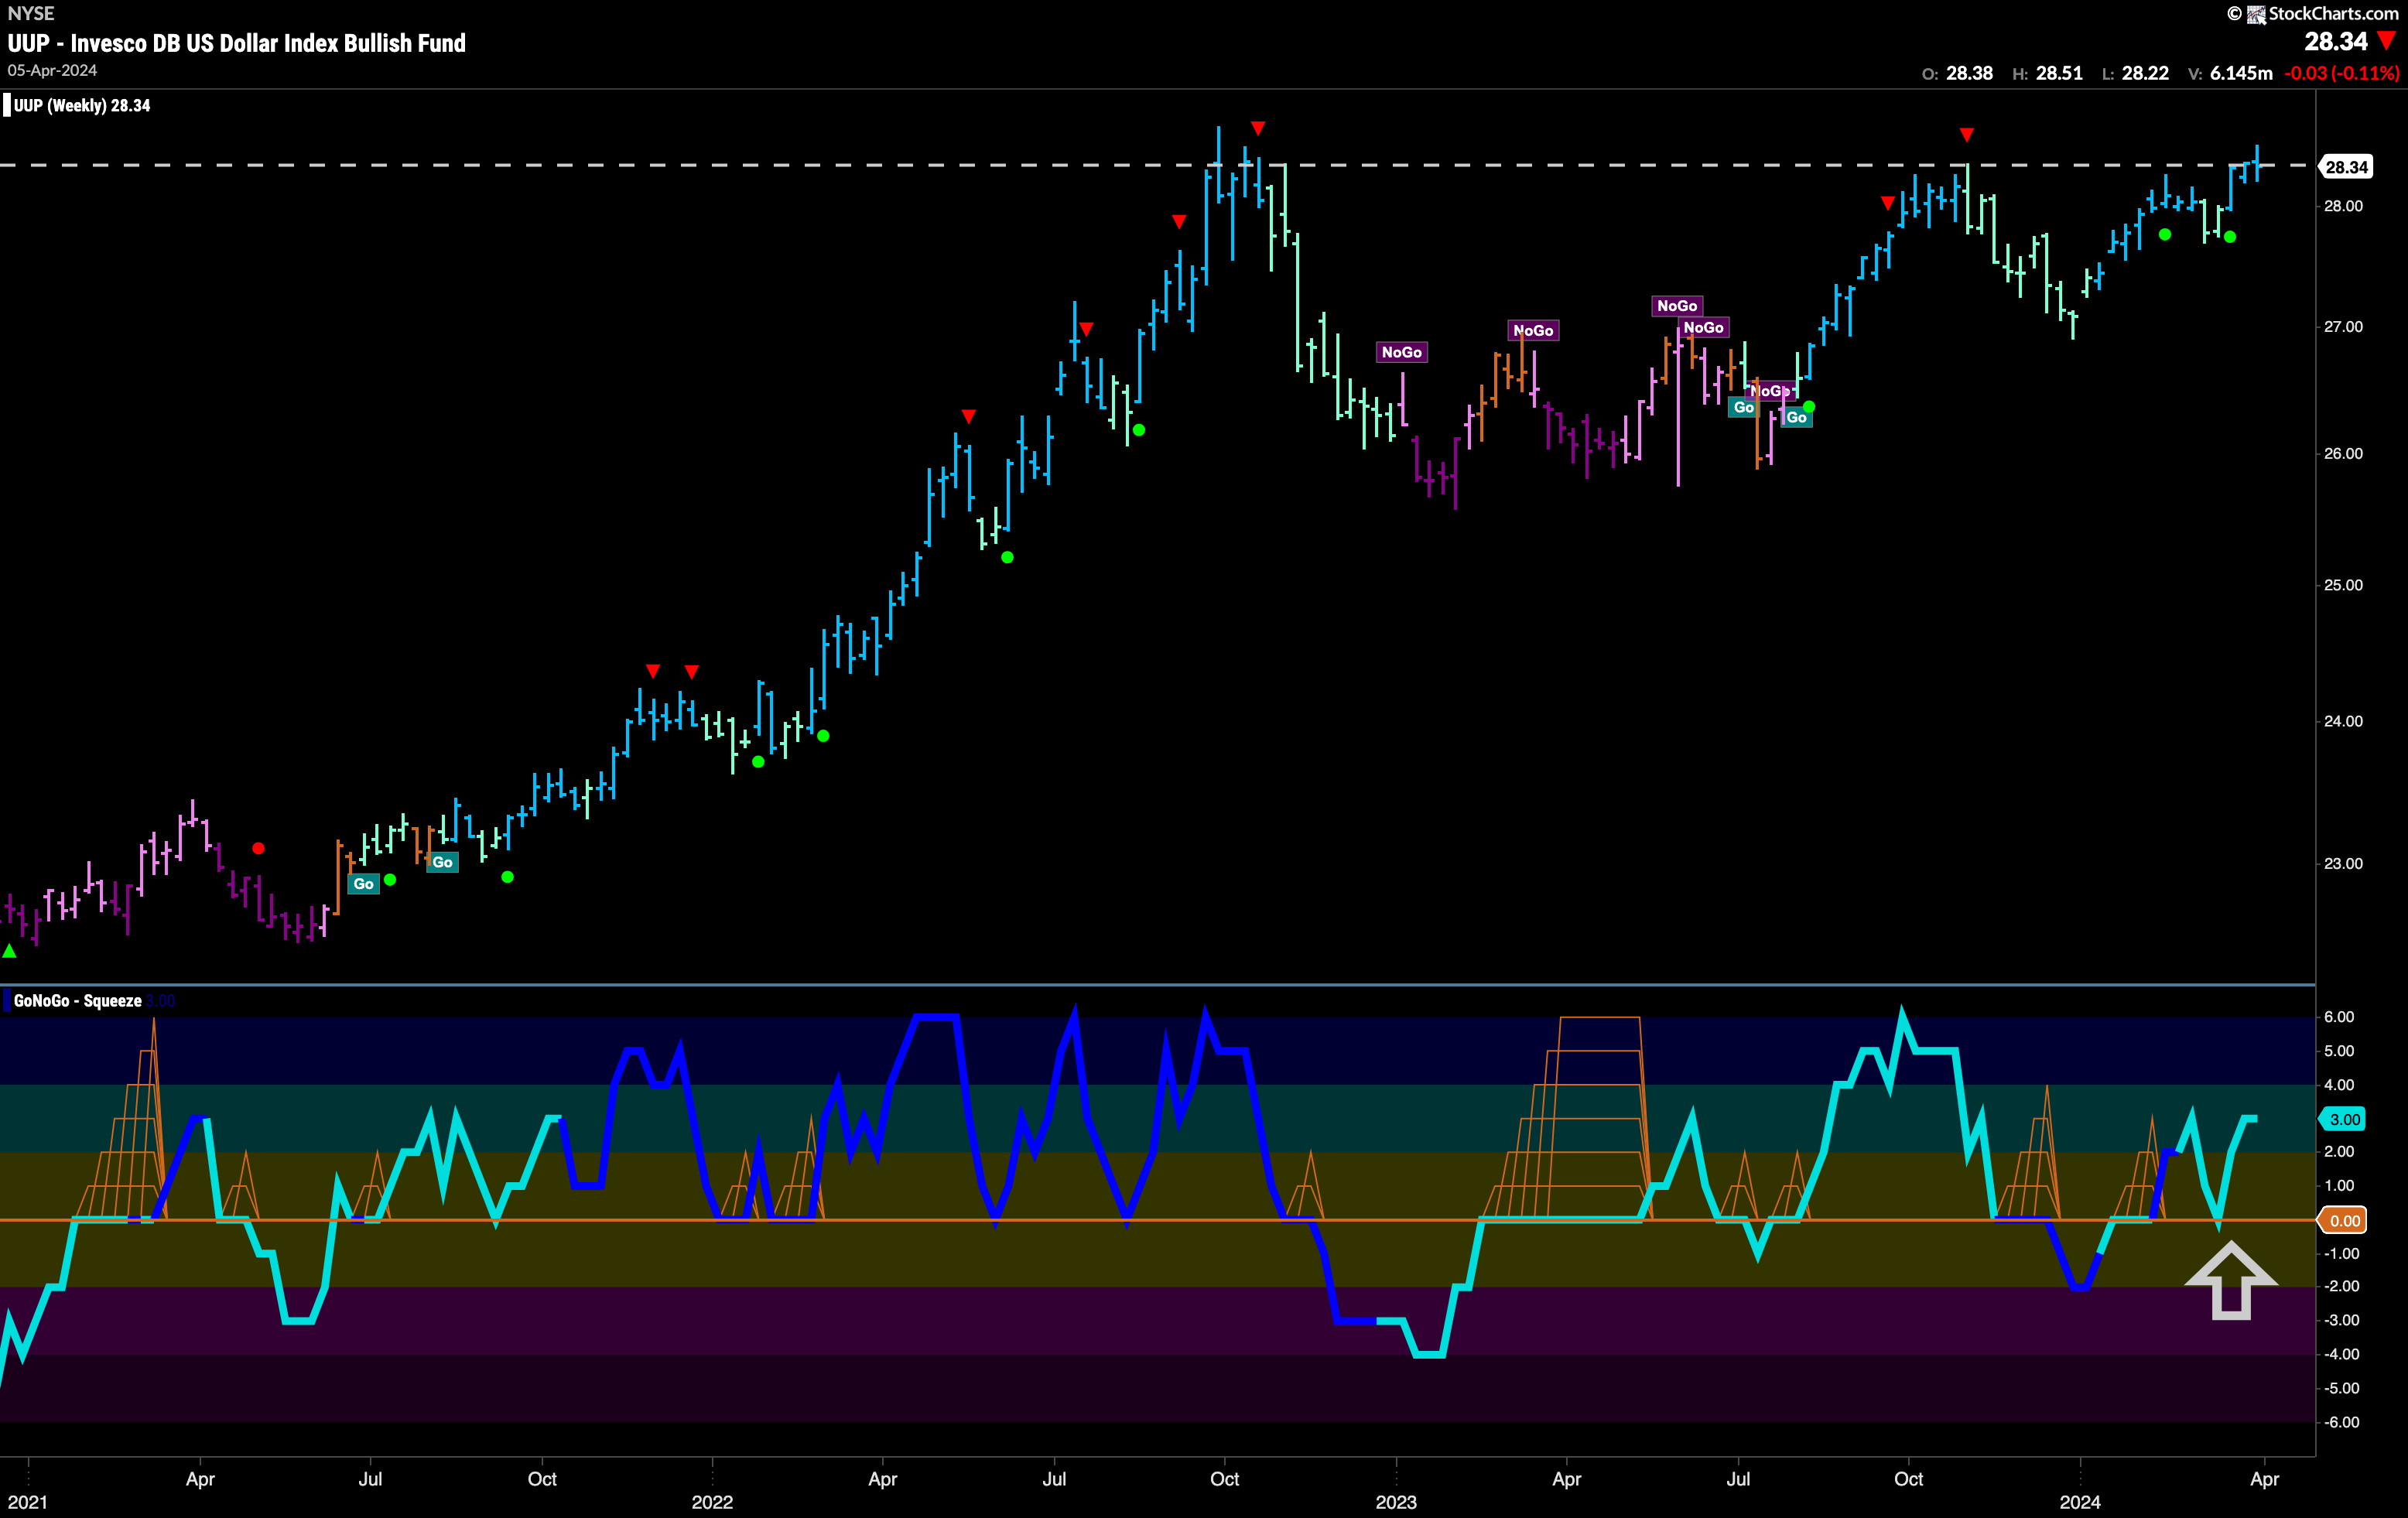
The longer term chart shows that this level is going to prove tough to break through. However, GoNoGo Trend is painting strong blue “Go” bars and GoNoGo Oscillator continues to find support at the zero line. We have seen the oscillator bounce quickly off that level and this tells us that momentum is surging in the direction of the “Go” trend. This could give price the push it needs to break through to new highs.
Oil Faces Strong Test
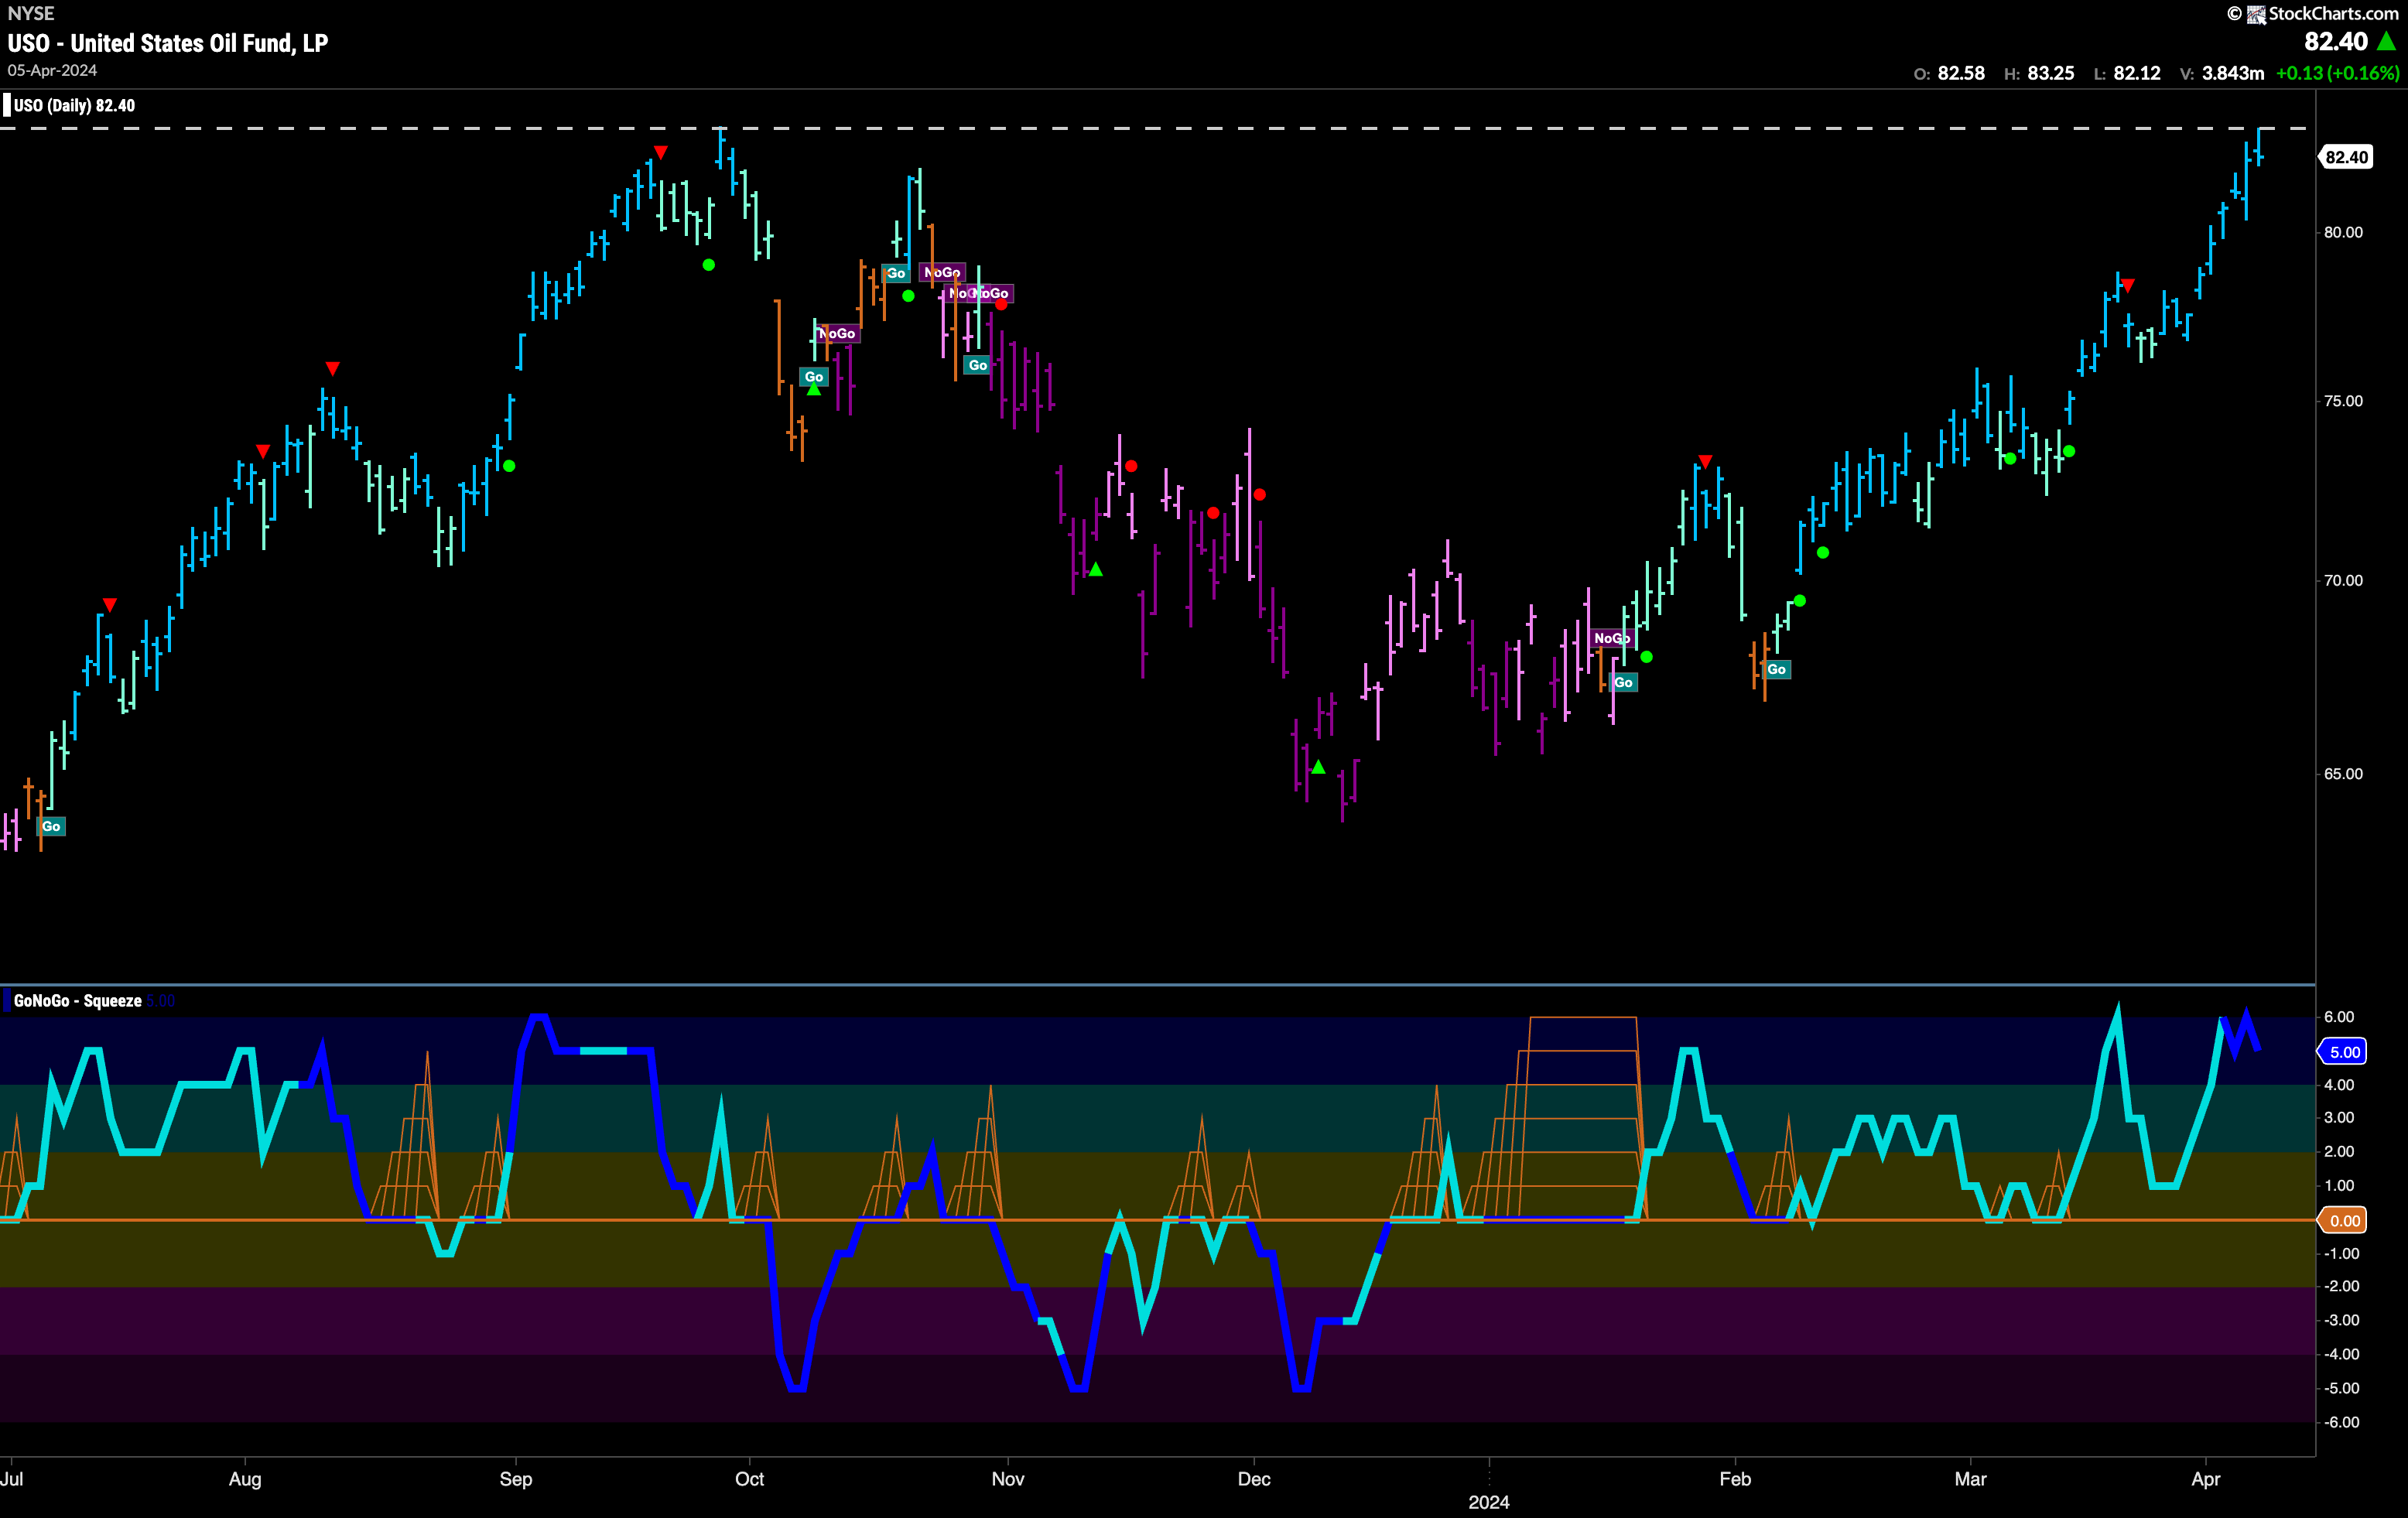
What a strong run Oil has been on these past few weeks. Now it looks as though it has hit a wall in the form of resistance from prior highs. On the last day of the week price fell away from this resistance level after hitting almost the exact same high price. GoNoGo Oscillator is overbought and volume is heavy. There is a lot of activity around this level. We will watch to see if the oscillator falls out of overbought territory and if we get a Go Countertrend Correction Icon (red arrow). In that case, we would expect price to take a pause.
Going Going Gold!
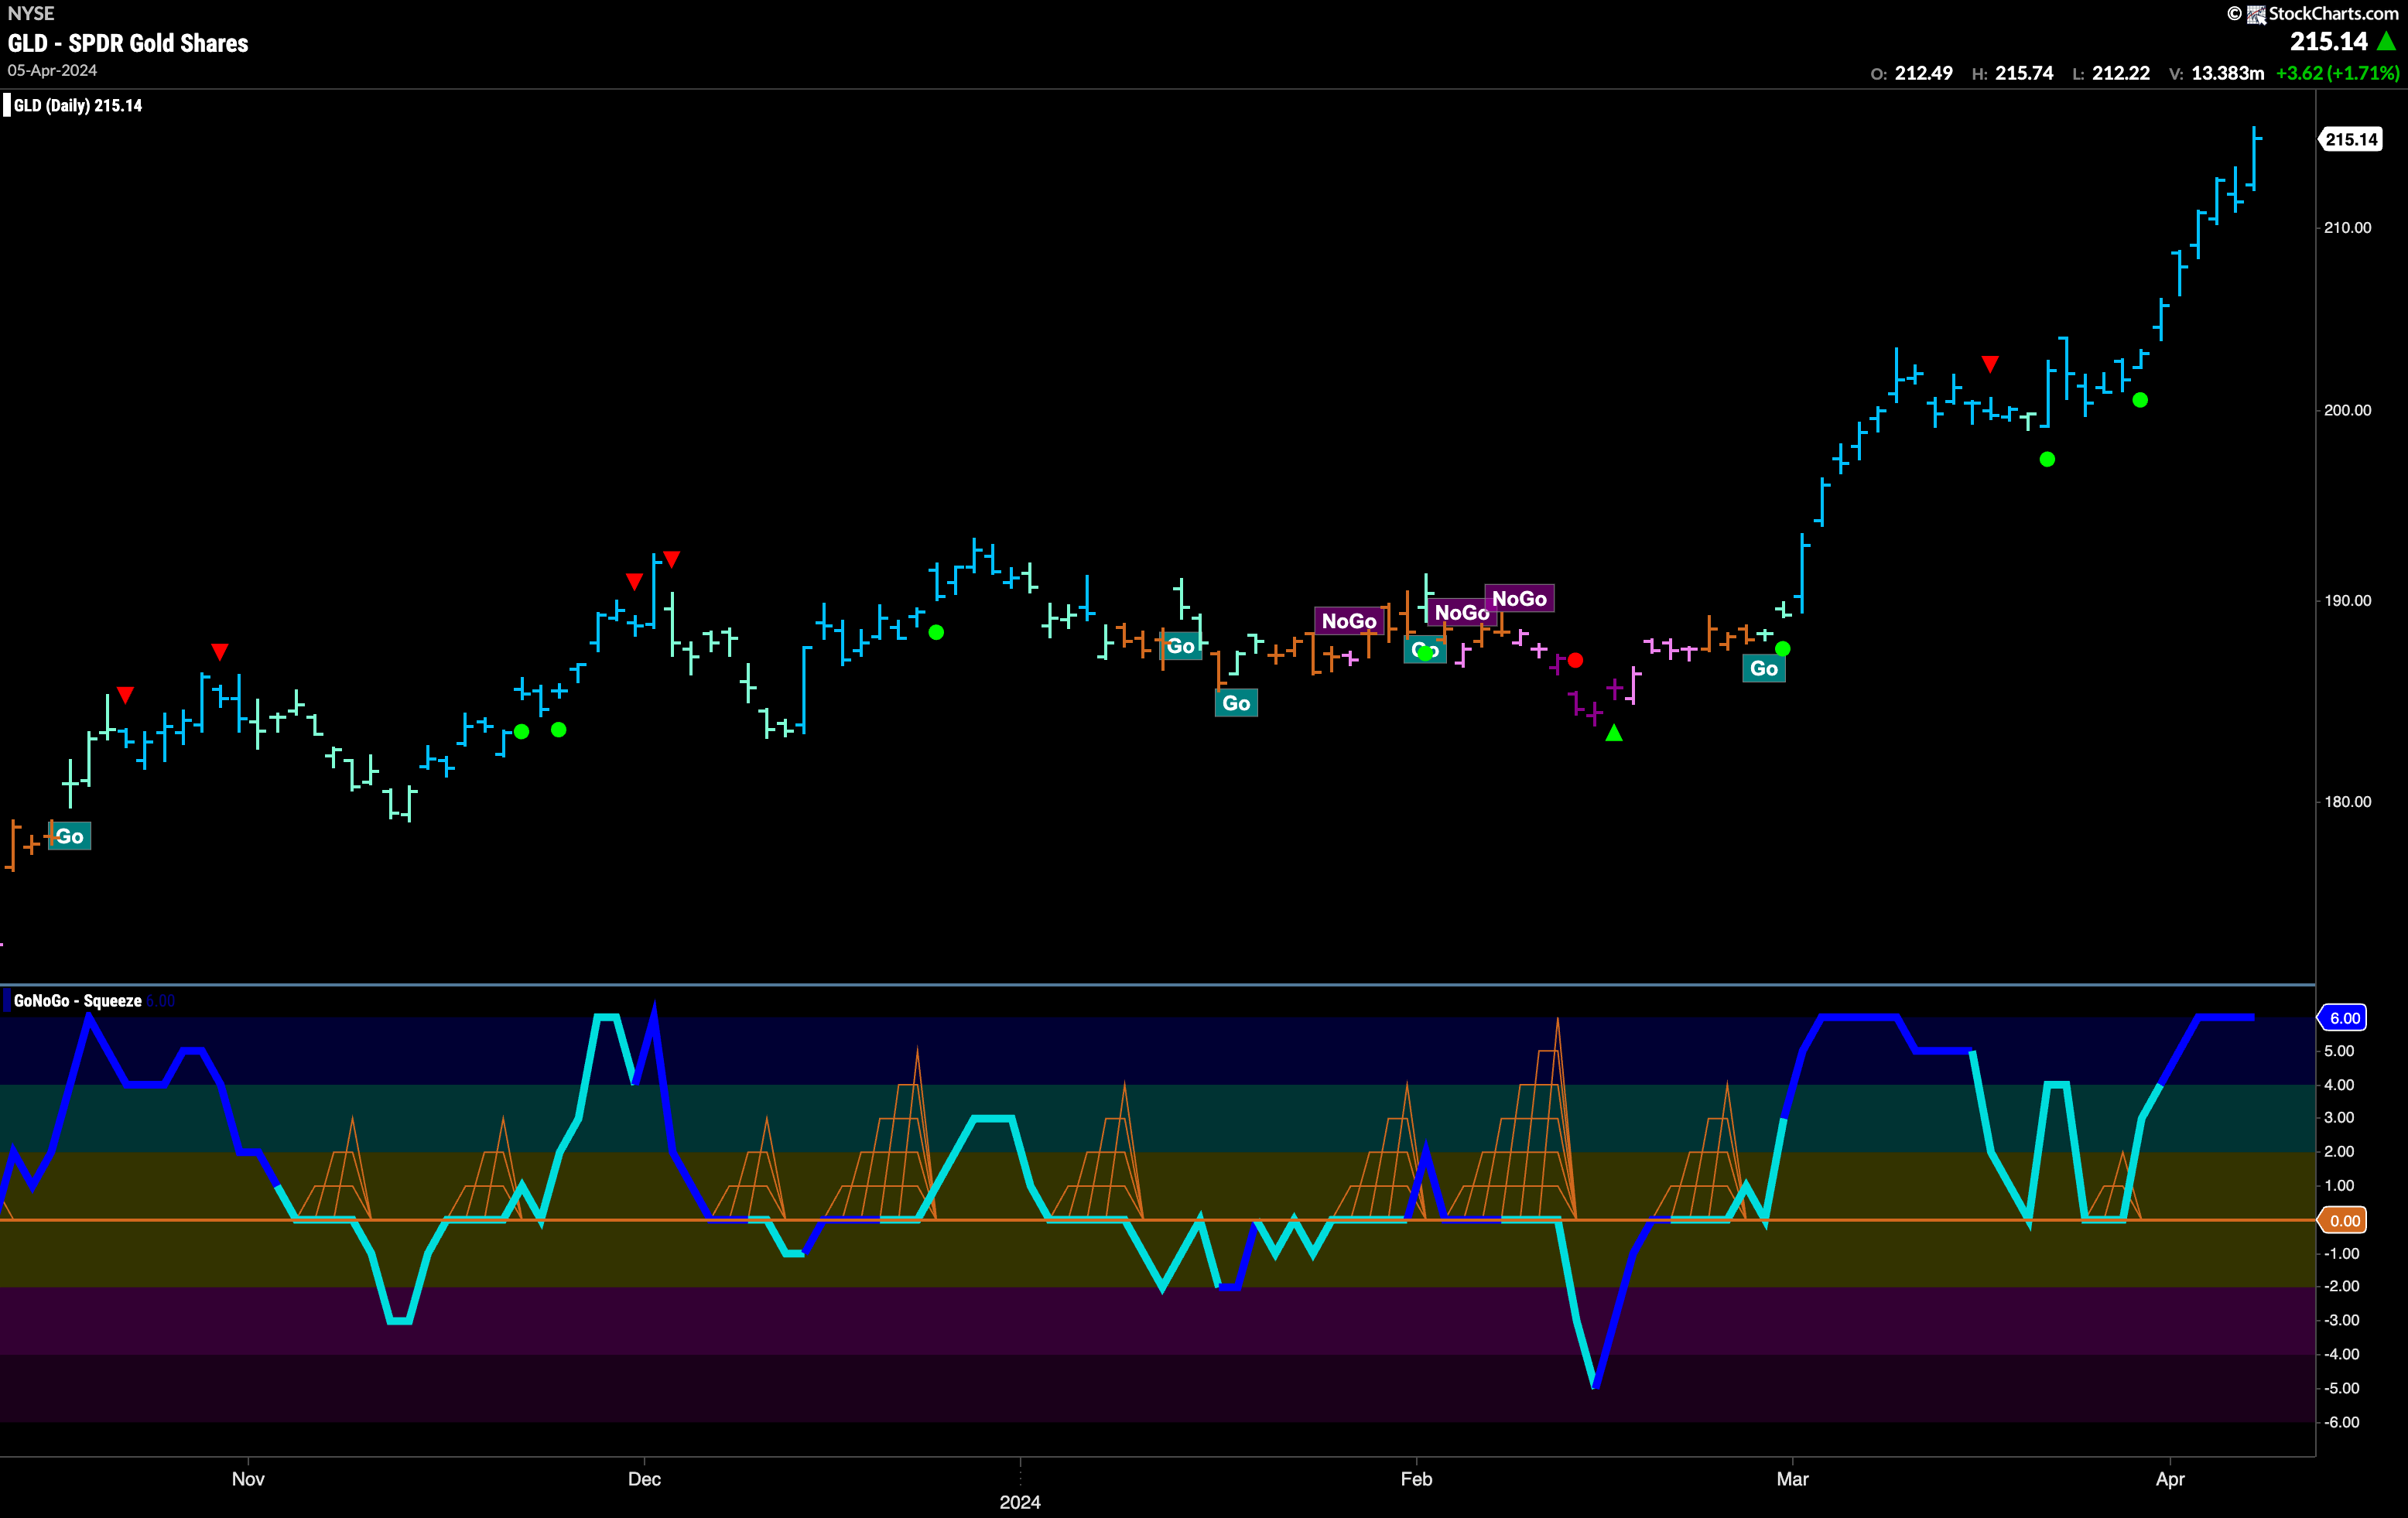
Another strong week for the precious metal. A string of strong blue “Go” bars sees price hit several new highs this week. GoNoGo Trend shows only one weaker aqua bar has been painted since the beginning of March. GoNoGo Oscillator is in overbought territory and volume is heavy. We will watch to see if we get a countertrend correction icon (red arrow) anytime soon.
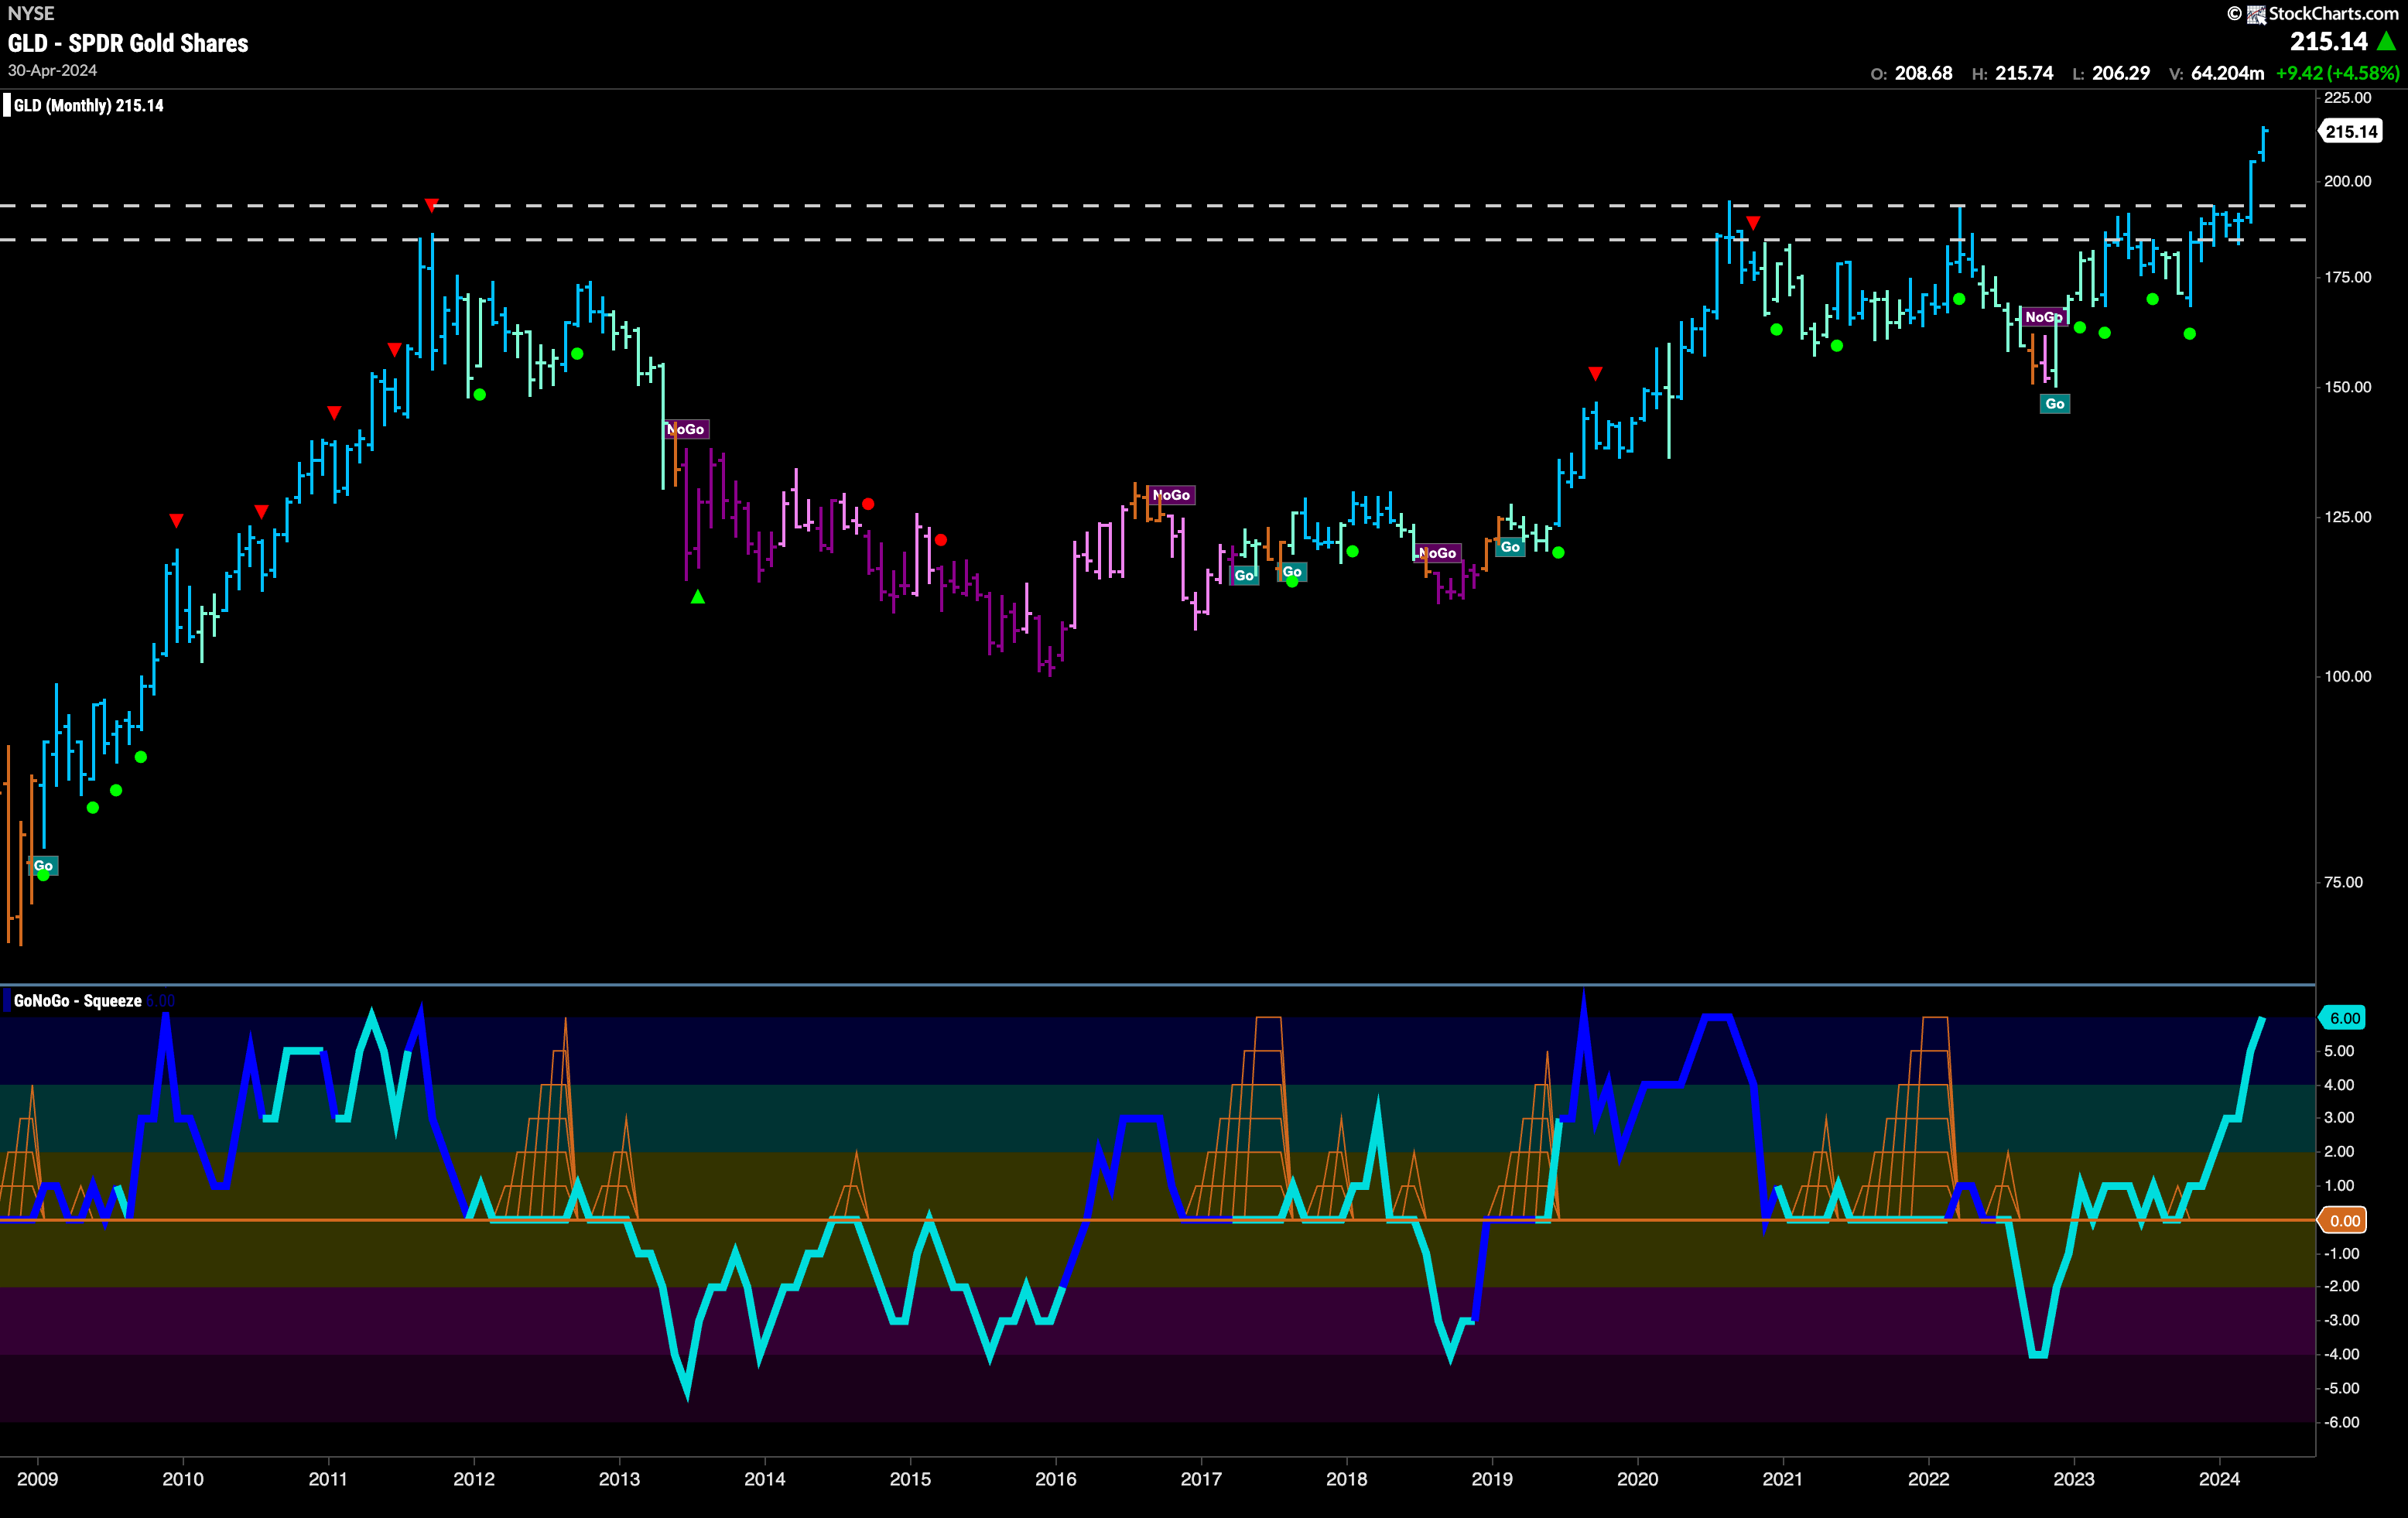
There can be no doubt now that price has broken to new highs! We will look now for price to consolidate at these levels and it will be important to see if what was once resistance now becomes support going forward. GoNoGo Oscillator is overbought on this monthly chart and so we will watch to see if it remains this way or if we see momentum wane. If it does, we would get a Go Countertrend Correction Icon (red arrow) and could expect a pause.
Sector RelMap
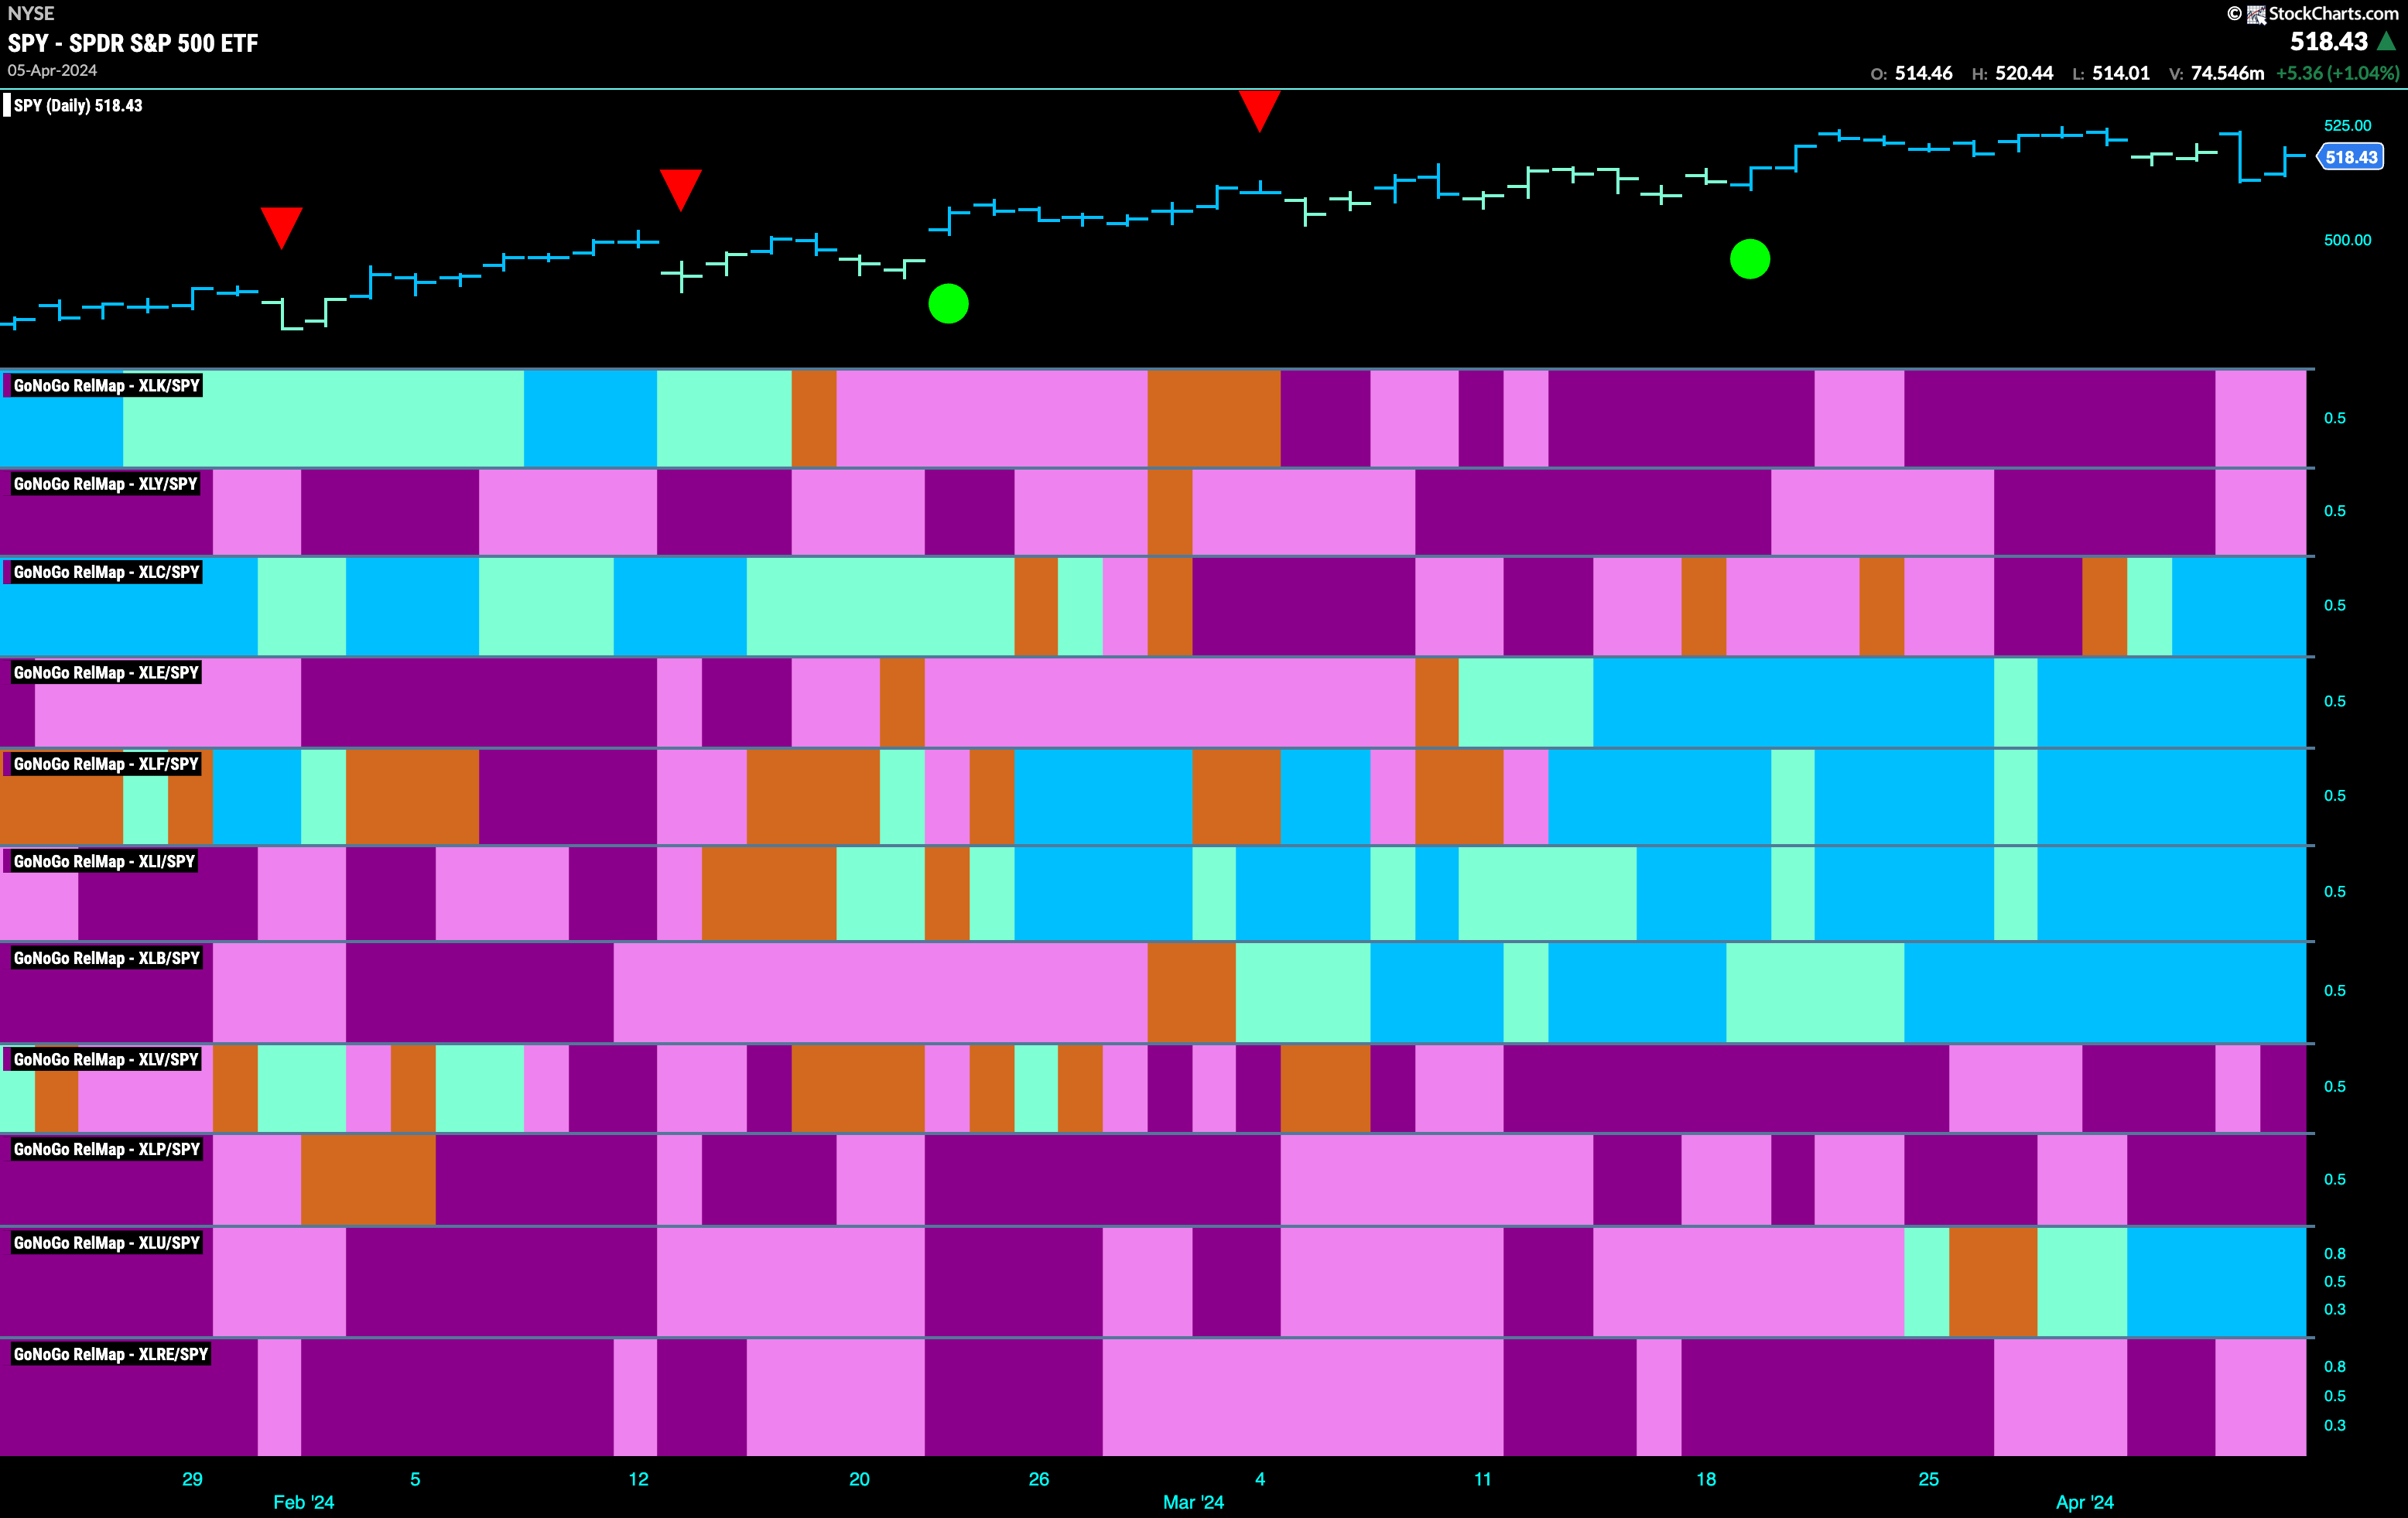
Below is the GoNoGo Sector RelMap. This GoNoGo RelMap applies the GoNoGo Trend to the relative strength ratios of the sectors to the base index. Looking at this map, we can quickly see where the relative outperformance is coming from as well as which sectors are lagging on a relative basis. 6 sectors are outperforming the base index this week. $XLC, $XLE, $XLF, $XLI, $XLB, and $XLU are painting relative “Go” bars.
Communications Sub-Group RelMap
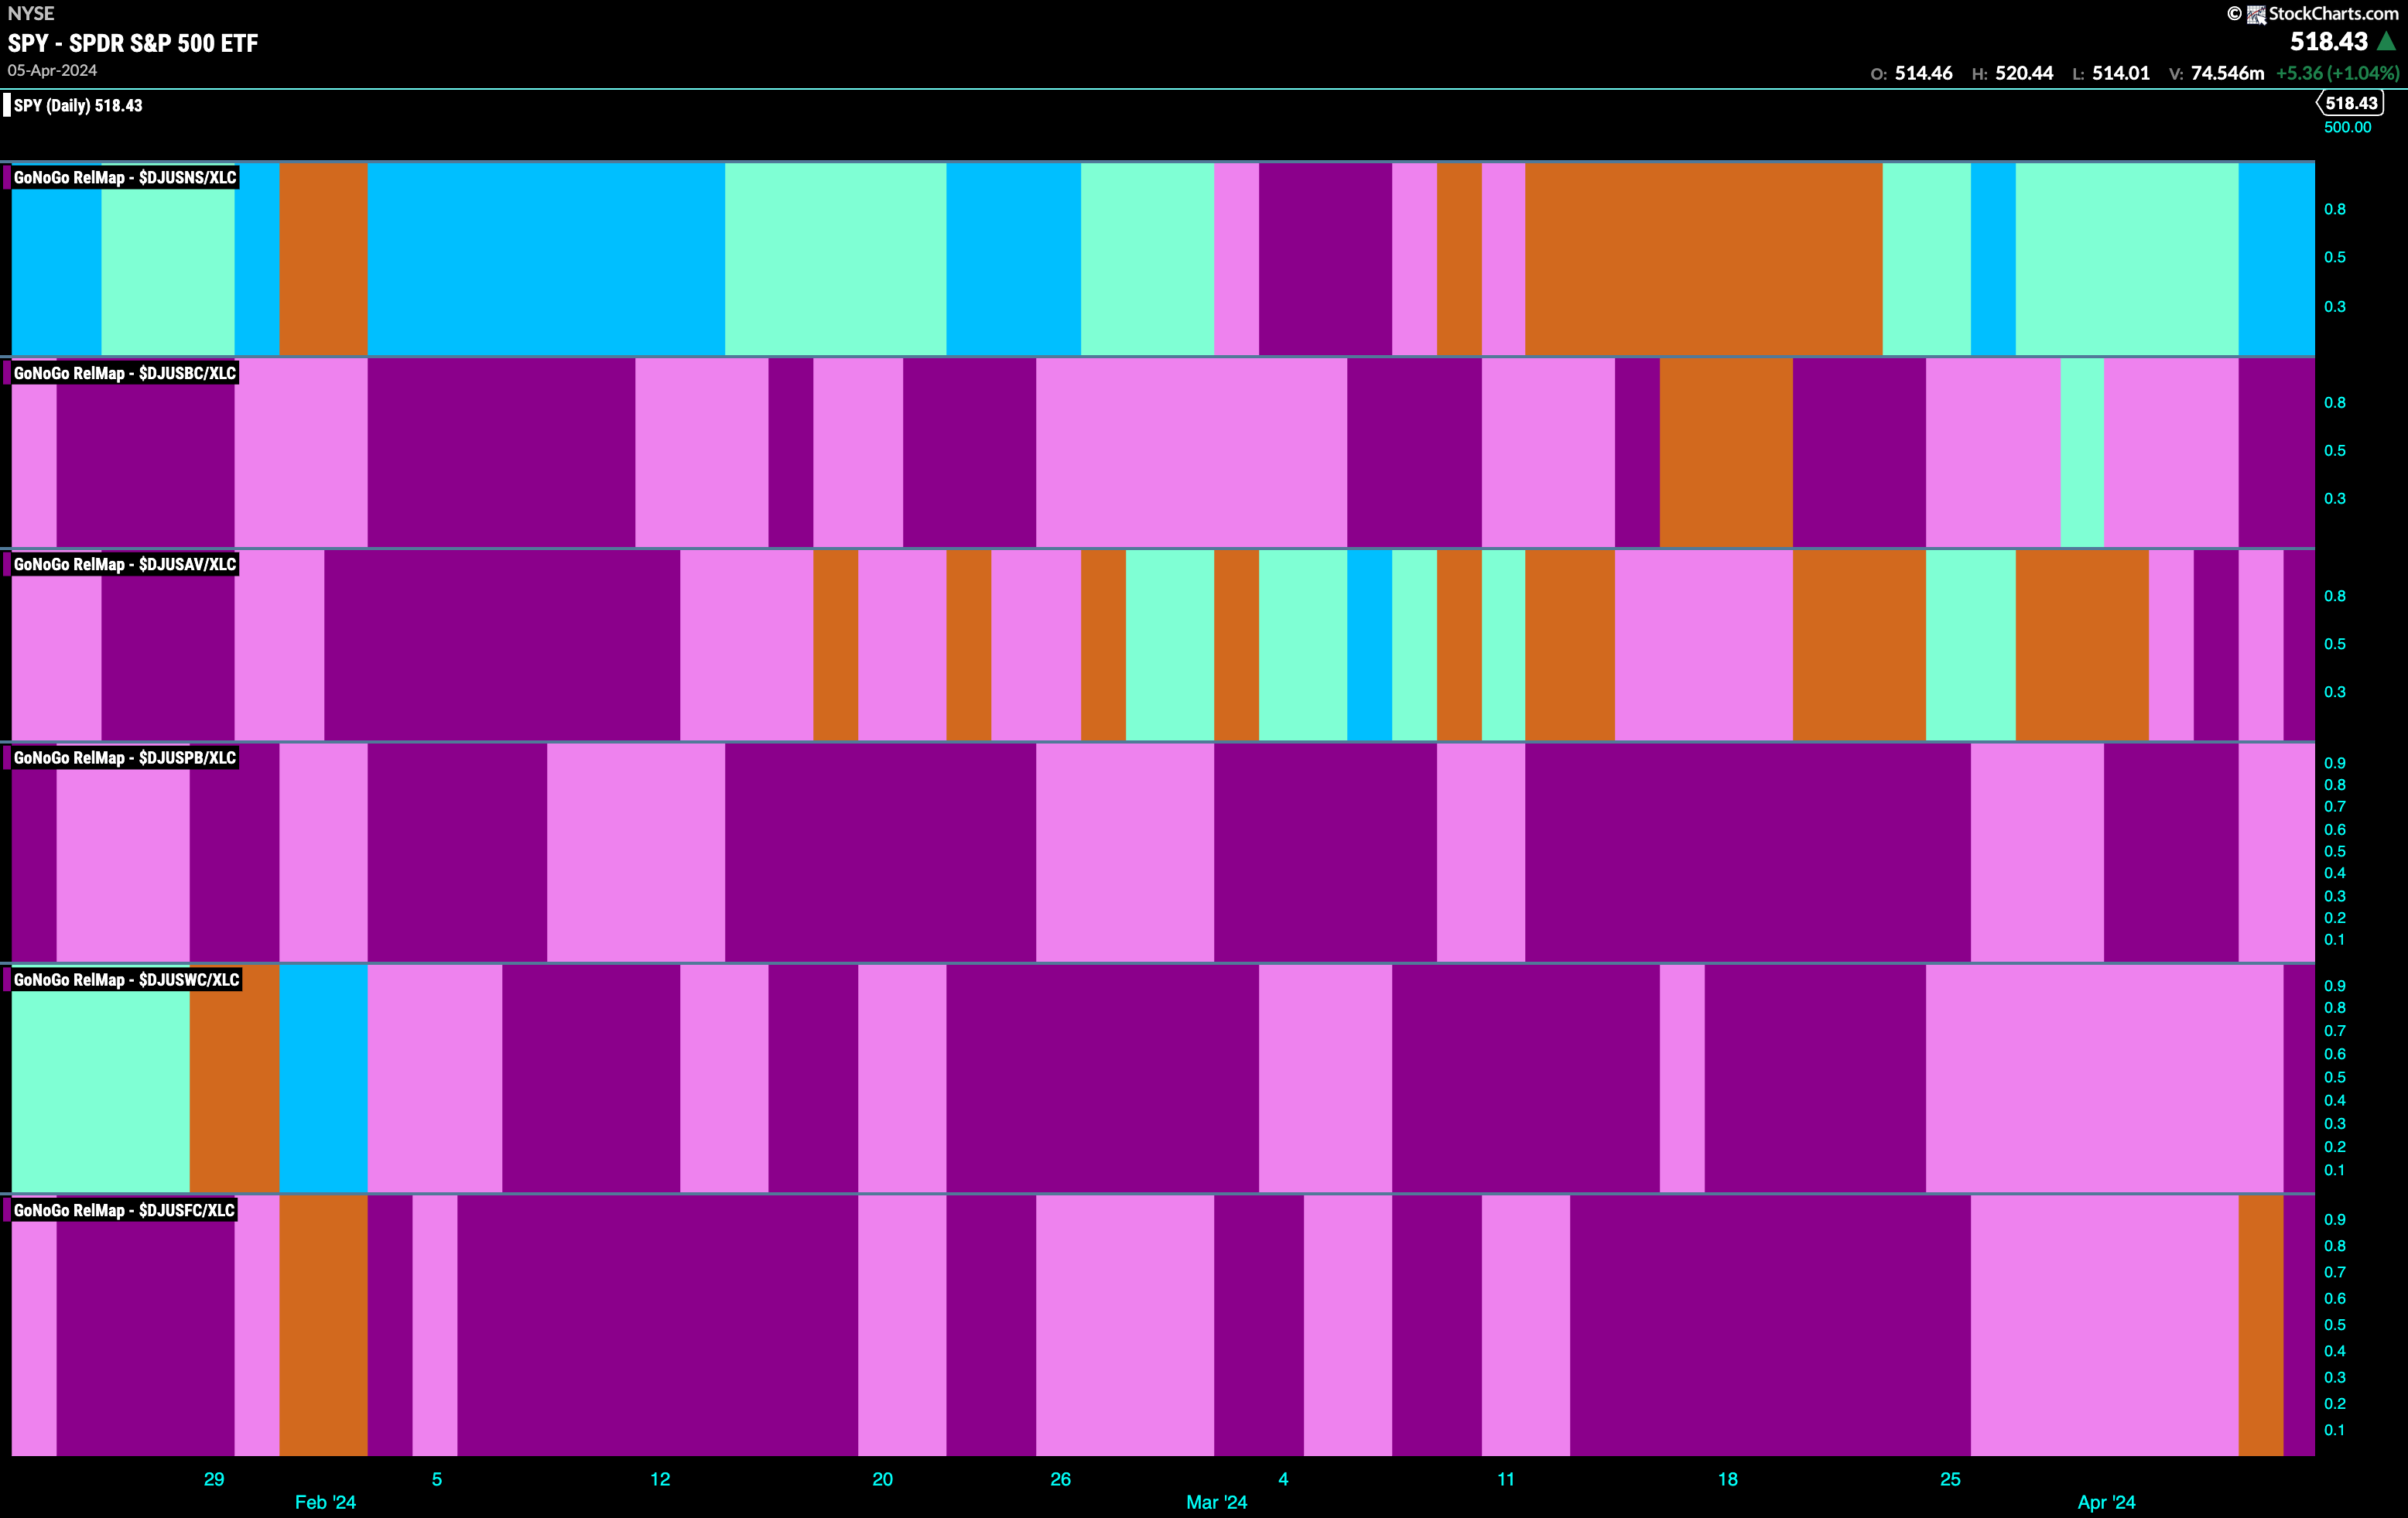
The GoNoGo Sector RelMap above shows that the communications sector is now joining the pack of relative out-performers. It is healthy to see more sectors leading, and it is also good to see one of the growth sectors joining the party of performers. If we take a look at the sub group map of the communications sector below we can see that this outperformance is coming from one place. The internet index is the top panel, and it is the stocks in that sub group that are driving the outperformance of the entire sector.
Meta to Go Even Higher?
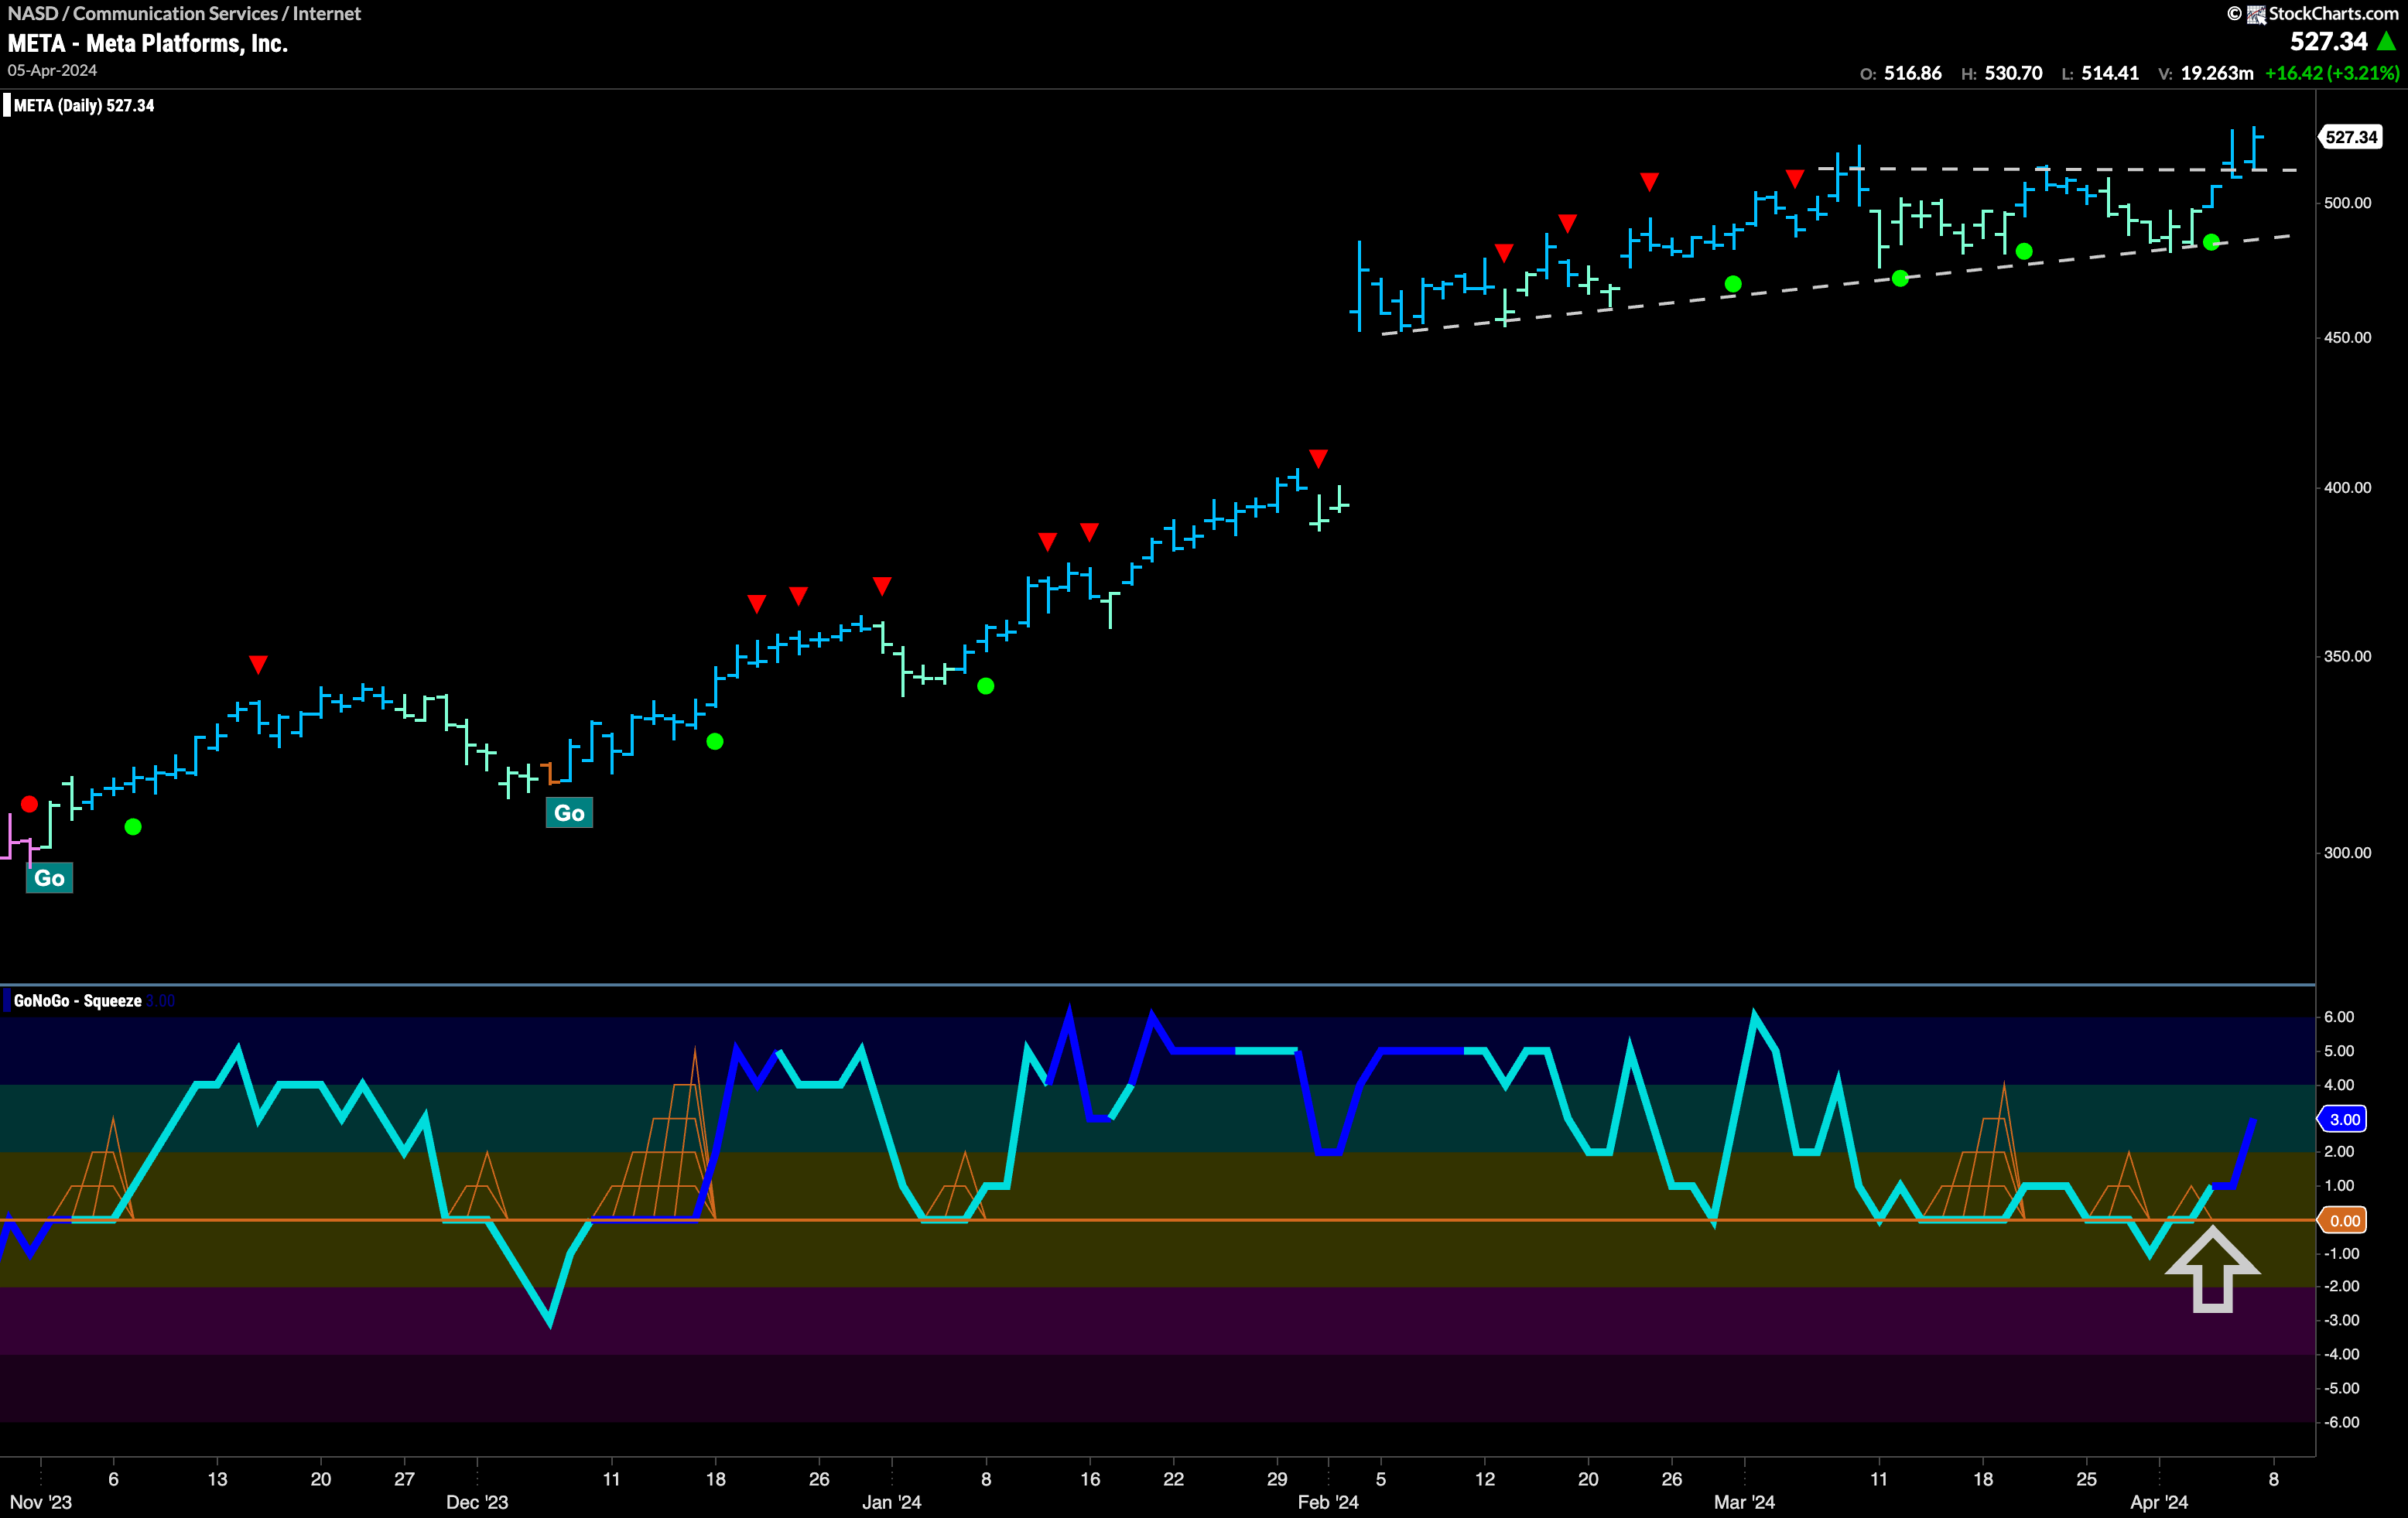
Below is the chart of $META. What a run it has been for the internet giant. Since the beginning of November, we have seen the “Go” trend scale higher and higher highs. Earlier this year we saw a runaway gap as price gapped higher in the middle of a trend. Now, we see lows creeping higher but more of a struggle to make higher highs until the last bar of the week. Closing on a high, we see GoNoGo Oscillator bursting back into positive territory and heavy volume. With momentum resurgent in the direction of the “Go” trend we will look for price to consolidate at these levels and perhaps go higher.
$CXDO Looking to Regain “Go” Colors?
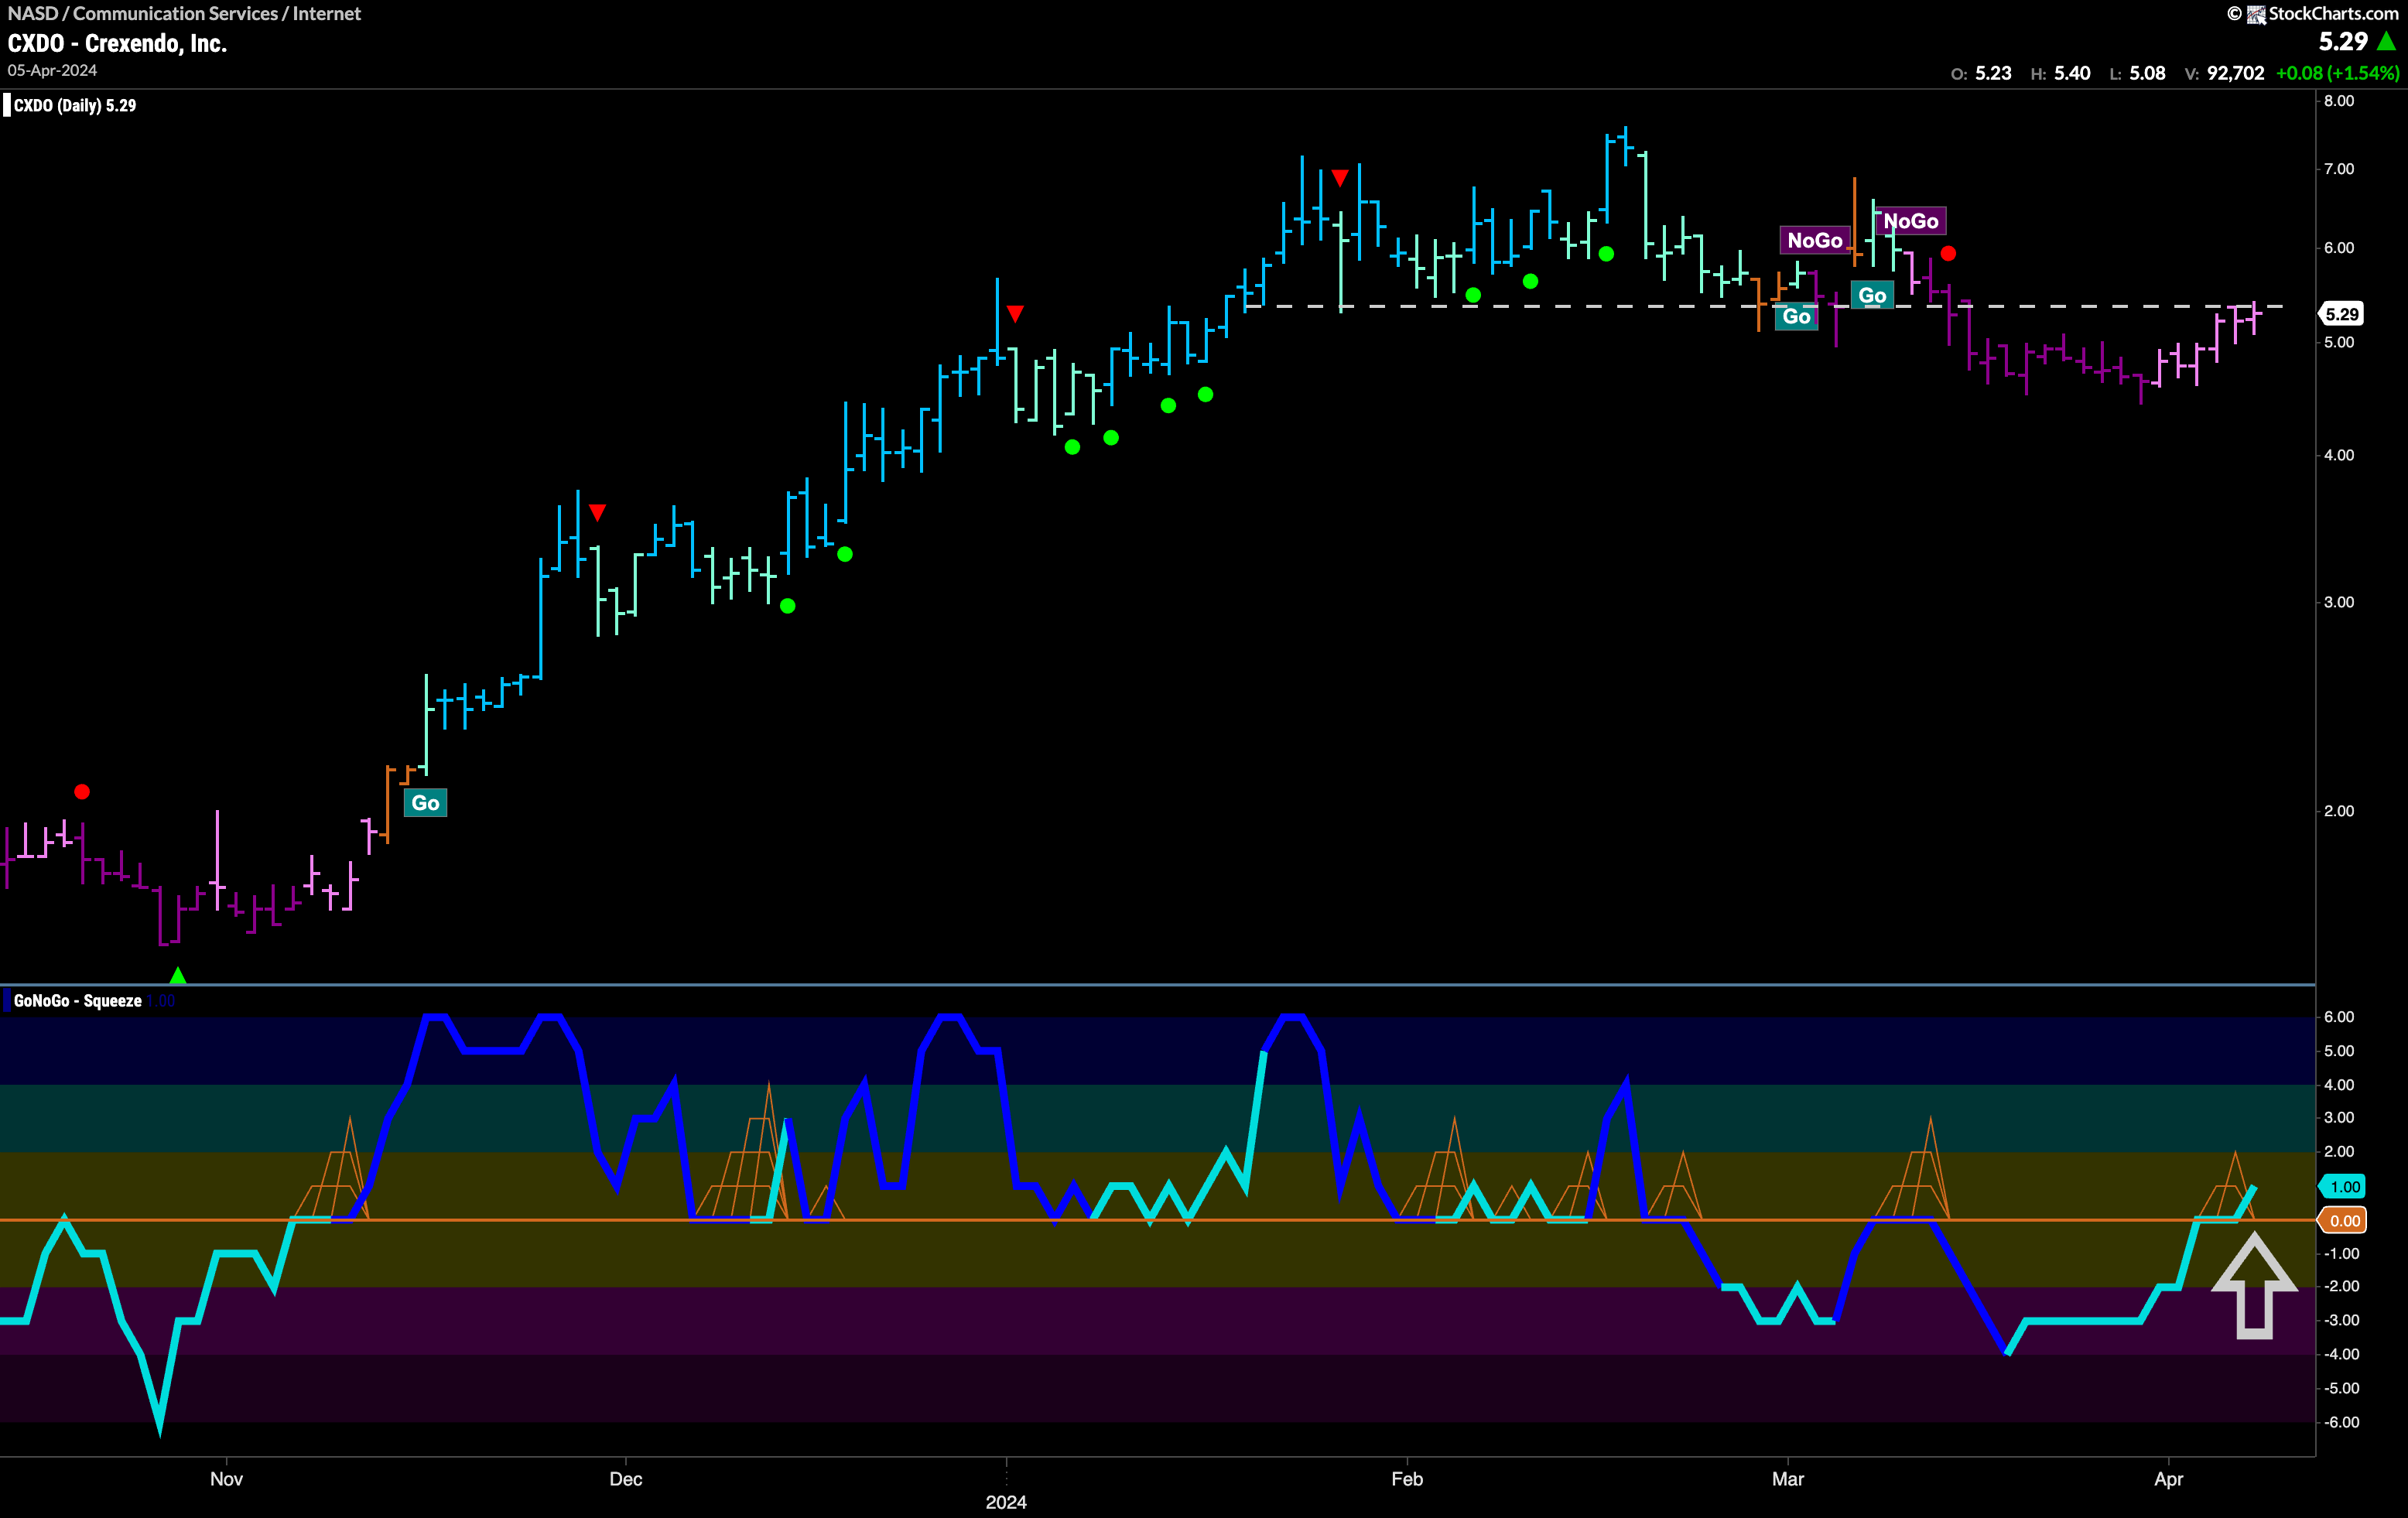
It has not been as smooth sailing for Crexendo, Inc. After a strong rise, we saw a “NoGo” take hold over the past month. This followed GoNoGo Oscillator failing to find support at the zero line and moving into negative territory. Will $CXDO play catch up with the outperforming internet index? GoNoGo Trend shows that the “NoGo” trend is weakening as we see a string of paler pink bars. This is as price runs up to challenge resistance form levels that were support in the previous “Go” trend. We see that GoNoGo Oscillator has broken back into positive territory which is out of step with the “NoGo” trend. We will watch to see if this momentum surge will give price the push it needs to break above resistance and for GoNoGo Trend to recognize a new “Go” trend.
