Good morning and welcome to this week’s Flight Path. The equity “Go” trend continued this week but we saw some weakness as GoNoGo Trend paints a string of weaker aqua bars to close out the week. We haven’t seen a new high in a few weeks and so we will watch this week to see if the “Go” trend can hold. Treasury bond prices maintained the “NoGo” strength that we spotted last week as we saw a string of uninterrupted dark purple bars. The commodity index continued to shows strength this week as blue “Go” bars reigned supreme. The dollar also had a very strong week as it regained bright blue bars and hit new highs.
Equities Hanging on by a Thread to “Go” Trend
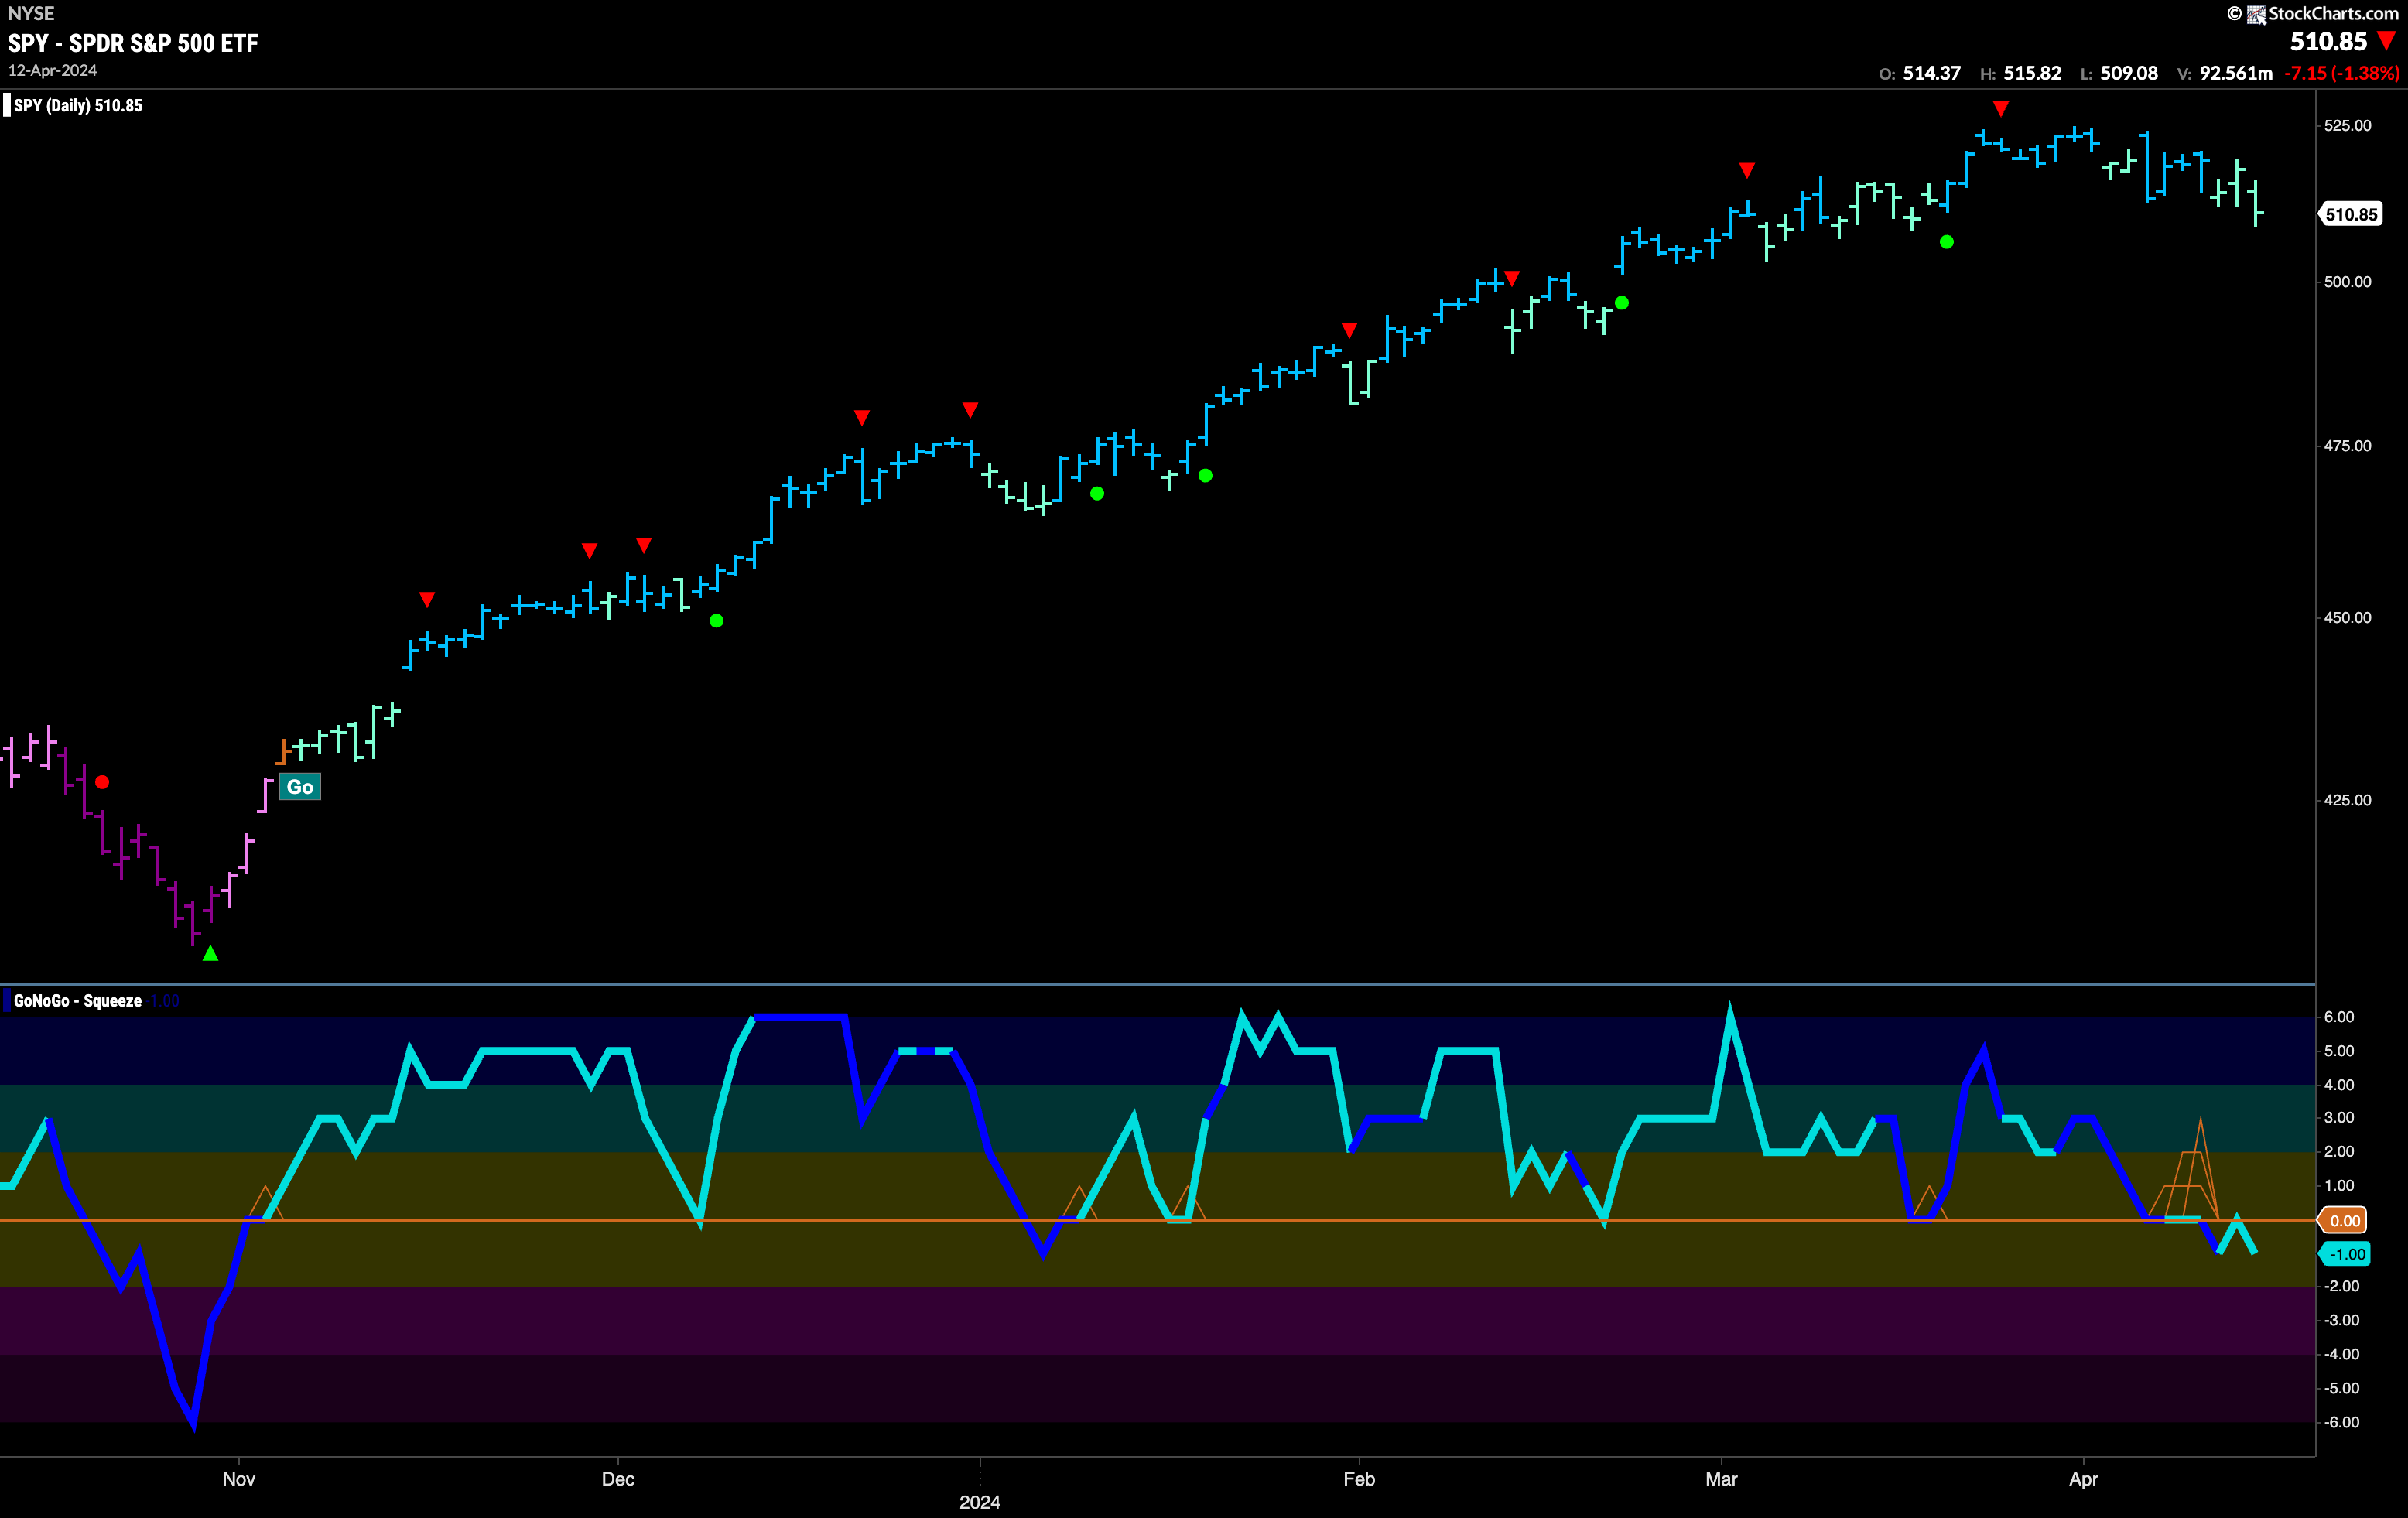
Since the last Go Countertrend Correction Icon (red arrow) have seen price struggle to go higher. Indeed, we have fallen from those highs and started to paint a more weaker aqua bars of late. This is the strongest threat to the “Go” trend we have seen in several months. GoNoGo Oscillator fell to the zero line and it has struggled to regain positive territory. In fact, we have seen it dip into negative territory and even a quick retest of that level. The oscillator was turned away by zero back into negative territory which means that momentum is out of step with the “Go” trend. We will want to see the oscillator regain positive territory if the “Go” trend is to survive.
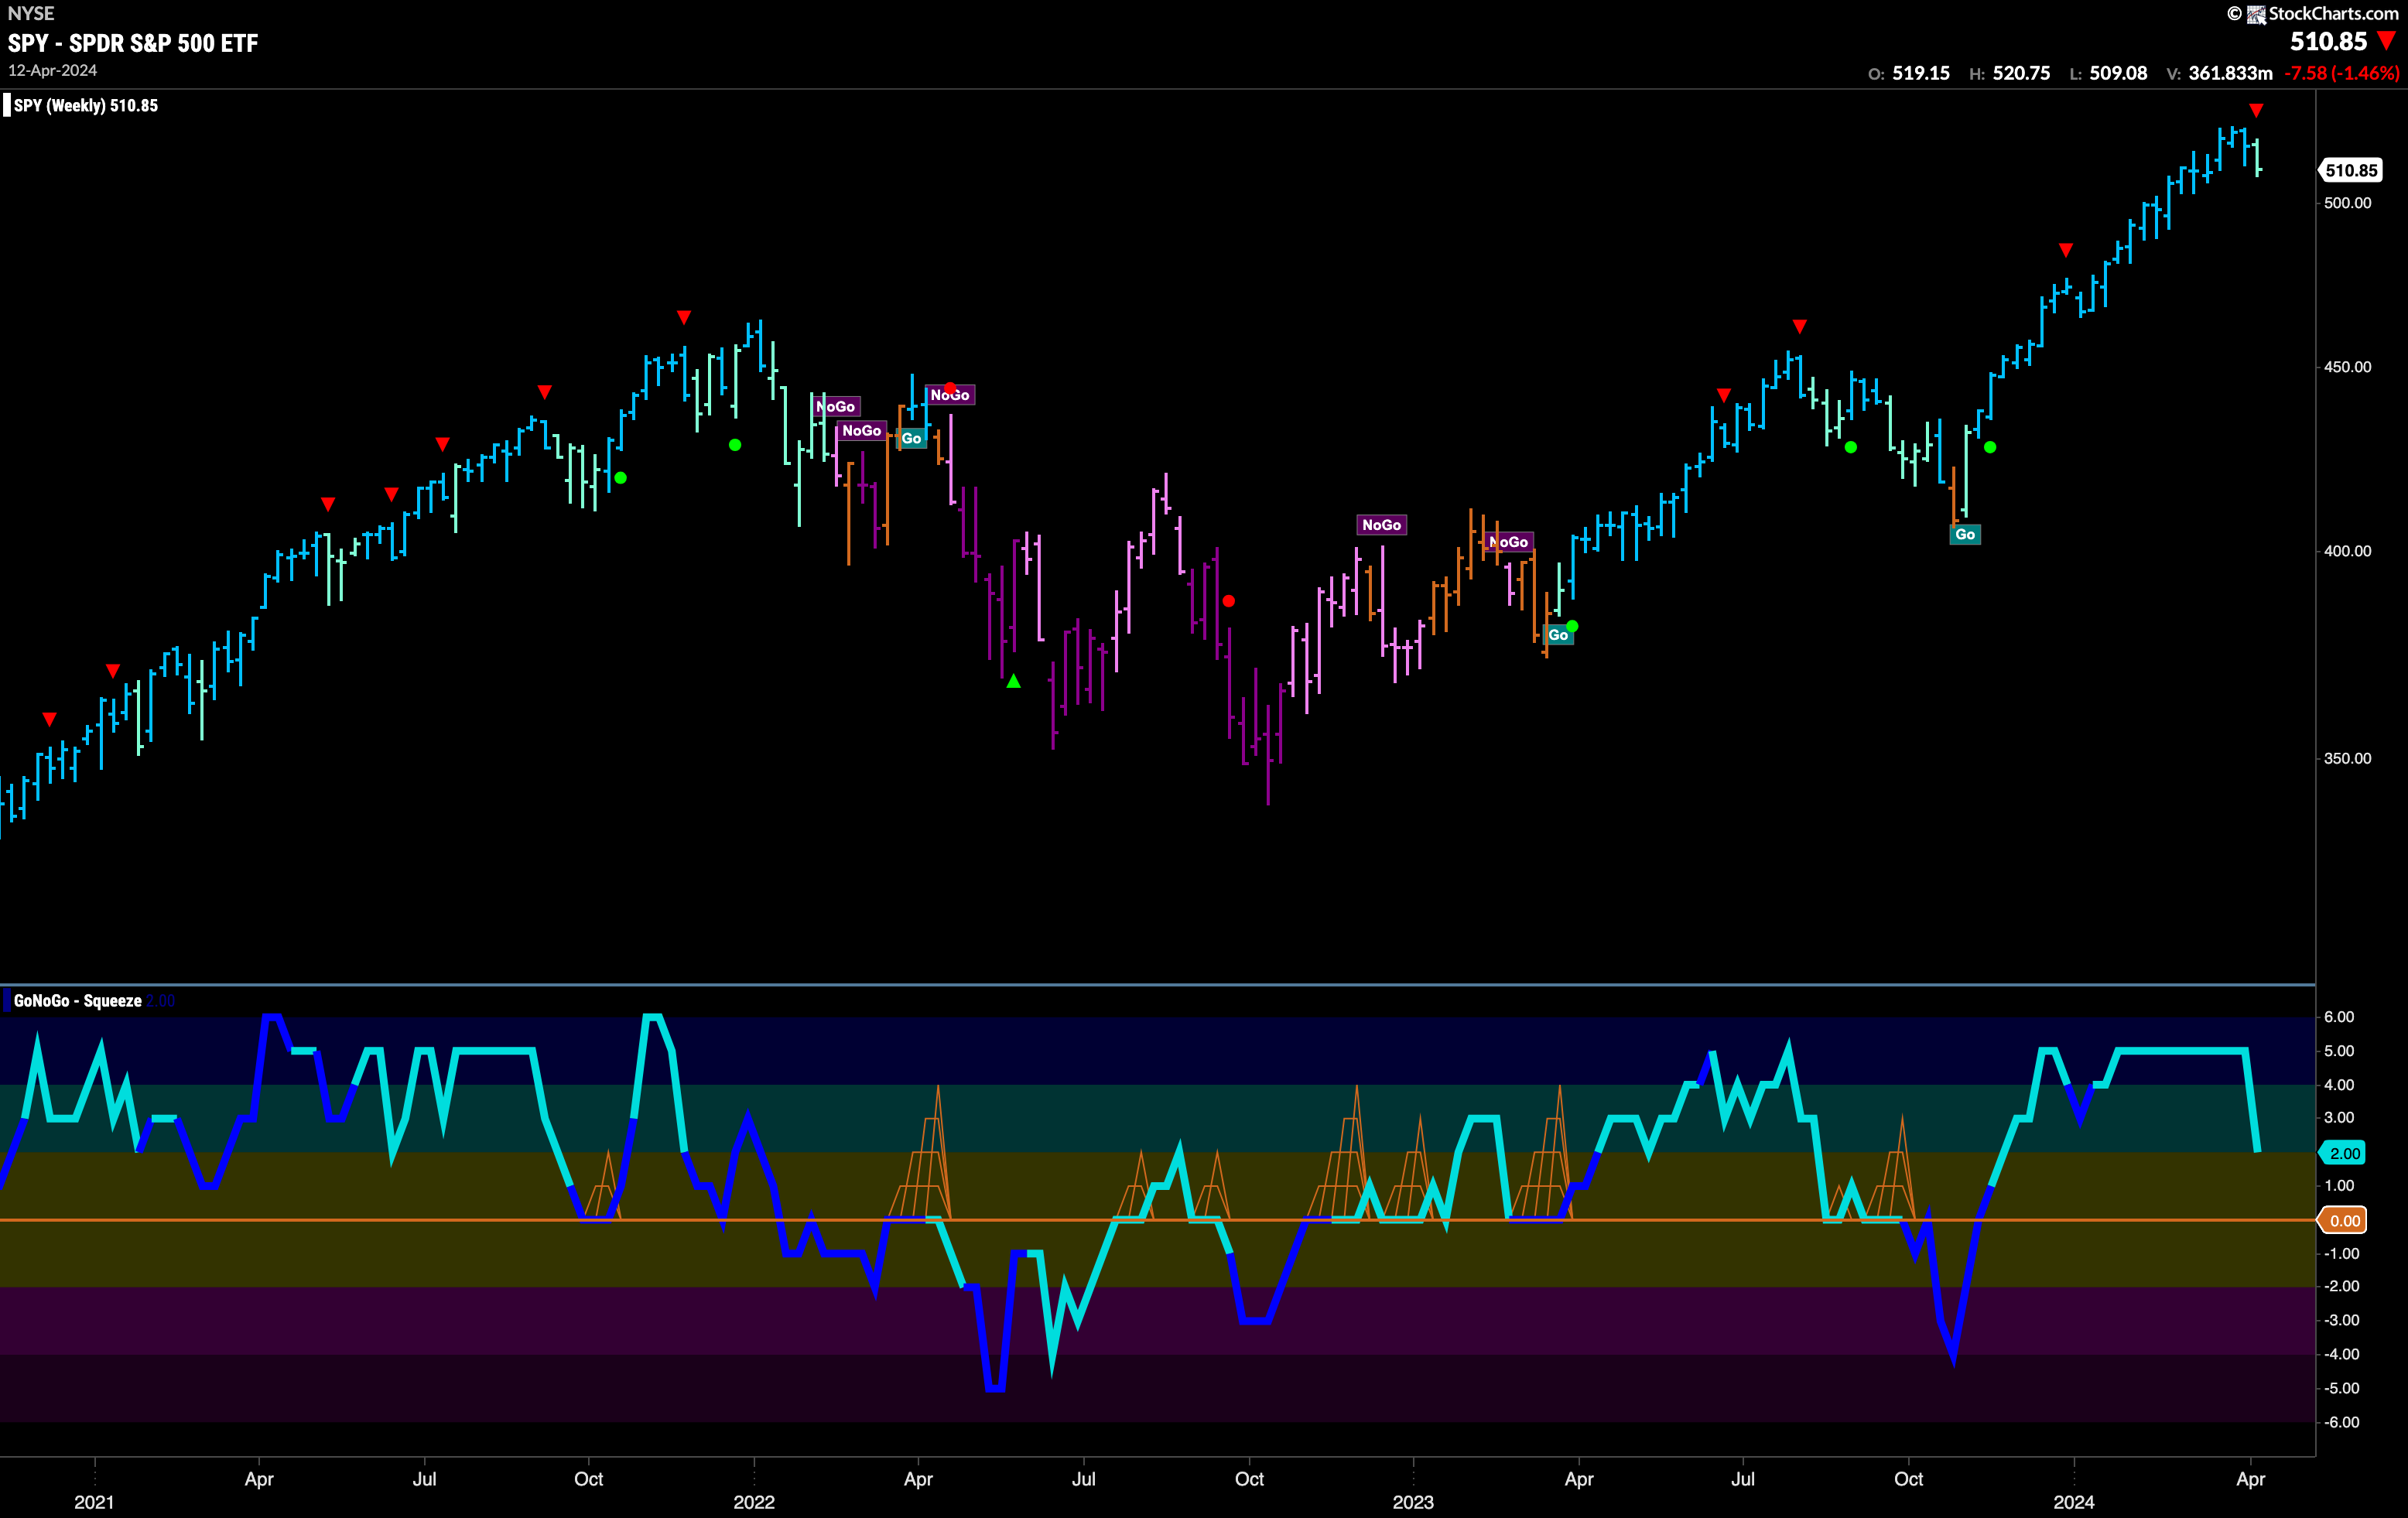
We see a first crack in the armor of the weekly “Go” trend. Another lower close was painted a weaker aqua color by GoNoGo Trend. As GoNoGo Oscillator falls from overbought territory we see a Go Countertrend Correction Icon (red arrow) telling us that price may struggle to go higher in the short term. If we turn our eye to the lower panel we can see that GoNoGo Oscillator is falling sharply. We will watch closely as the oscillator approaches the zero line. We will need to see the oscillator find support at that level as we know that in a healthy “Go” trend the oscillator should stay at or above zero.
Rates Set Another Higher High
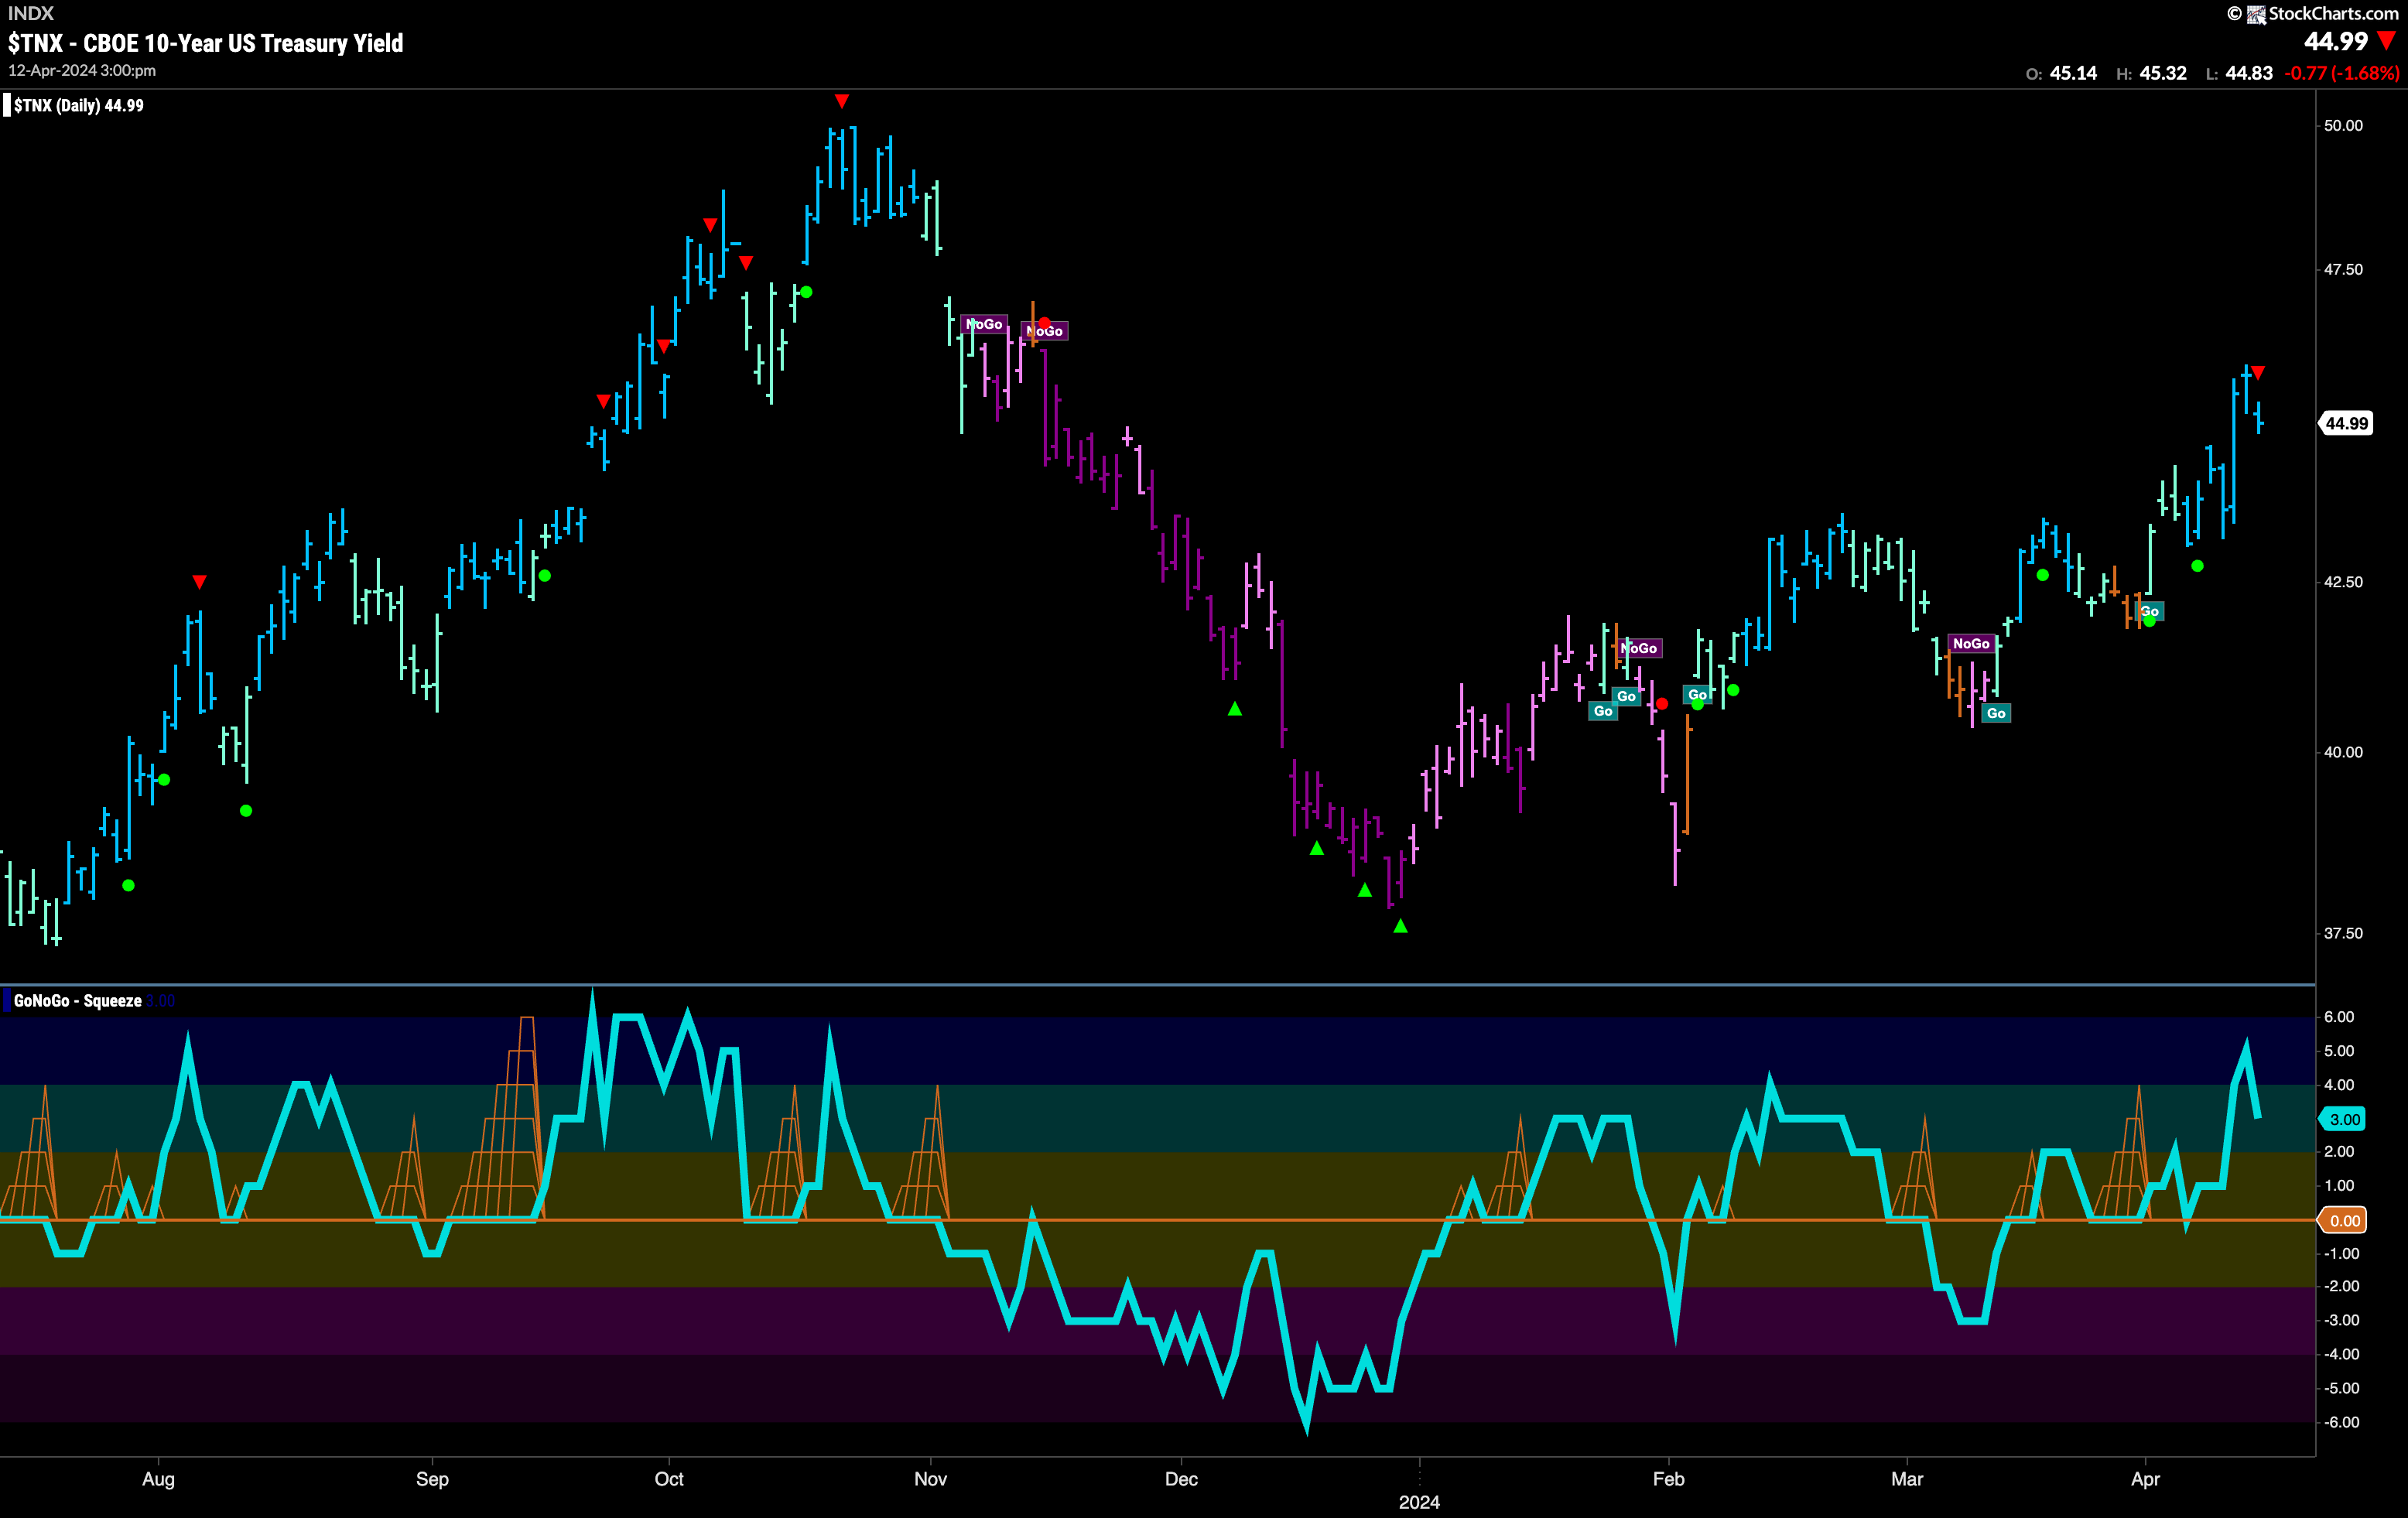
A week of uninterrupted strong blue “Go” bars sees price set another higher high this week on the daily chart of U.S. treasury rates. We do see a Go Countertrend Correction Icon (red arrow) which indicates price may struggle in the short term to go higher. Perhaps a pause then, as GoNoGo Oscillator turns around and heads for the zero line. As price momentum cools, and price falls from its recent high, we will watch to see if the oscillator finds support as it drops to the zero line.
Dollar Soars this Week as Price Jumps to New Highs
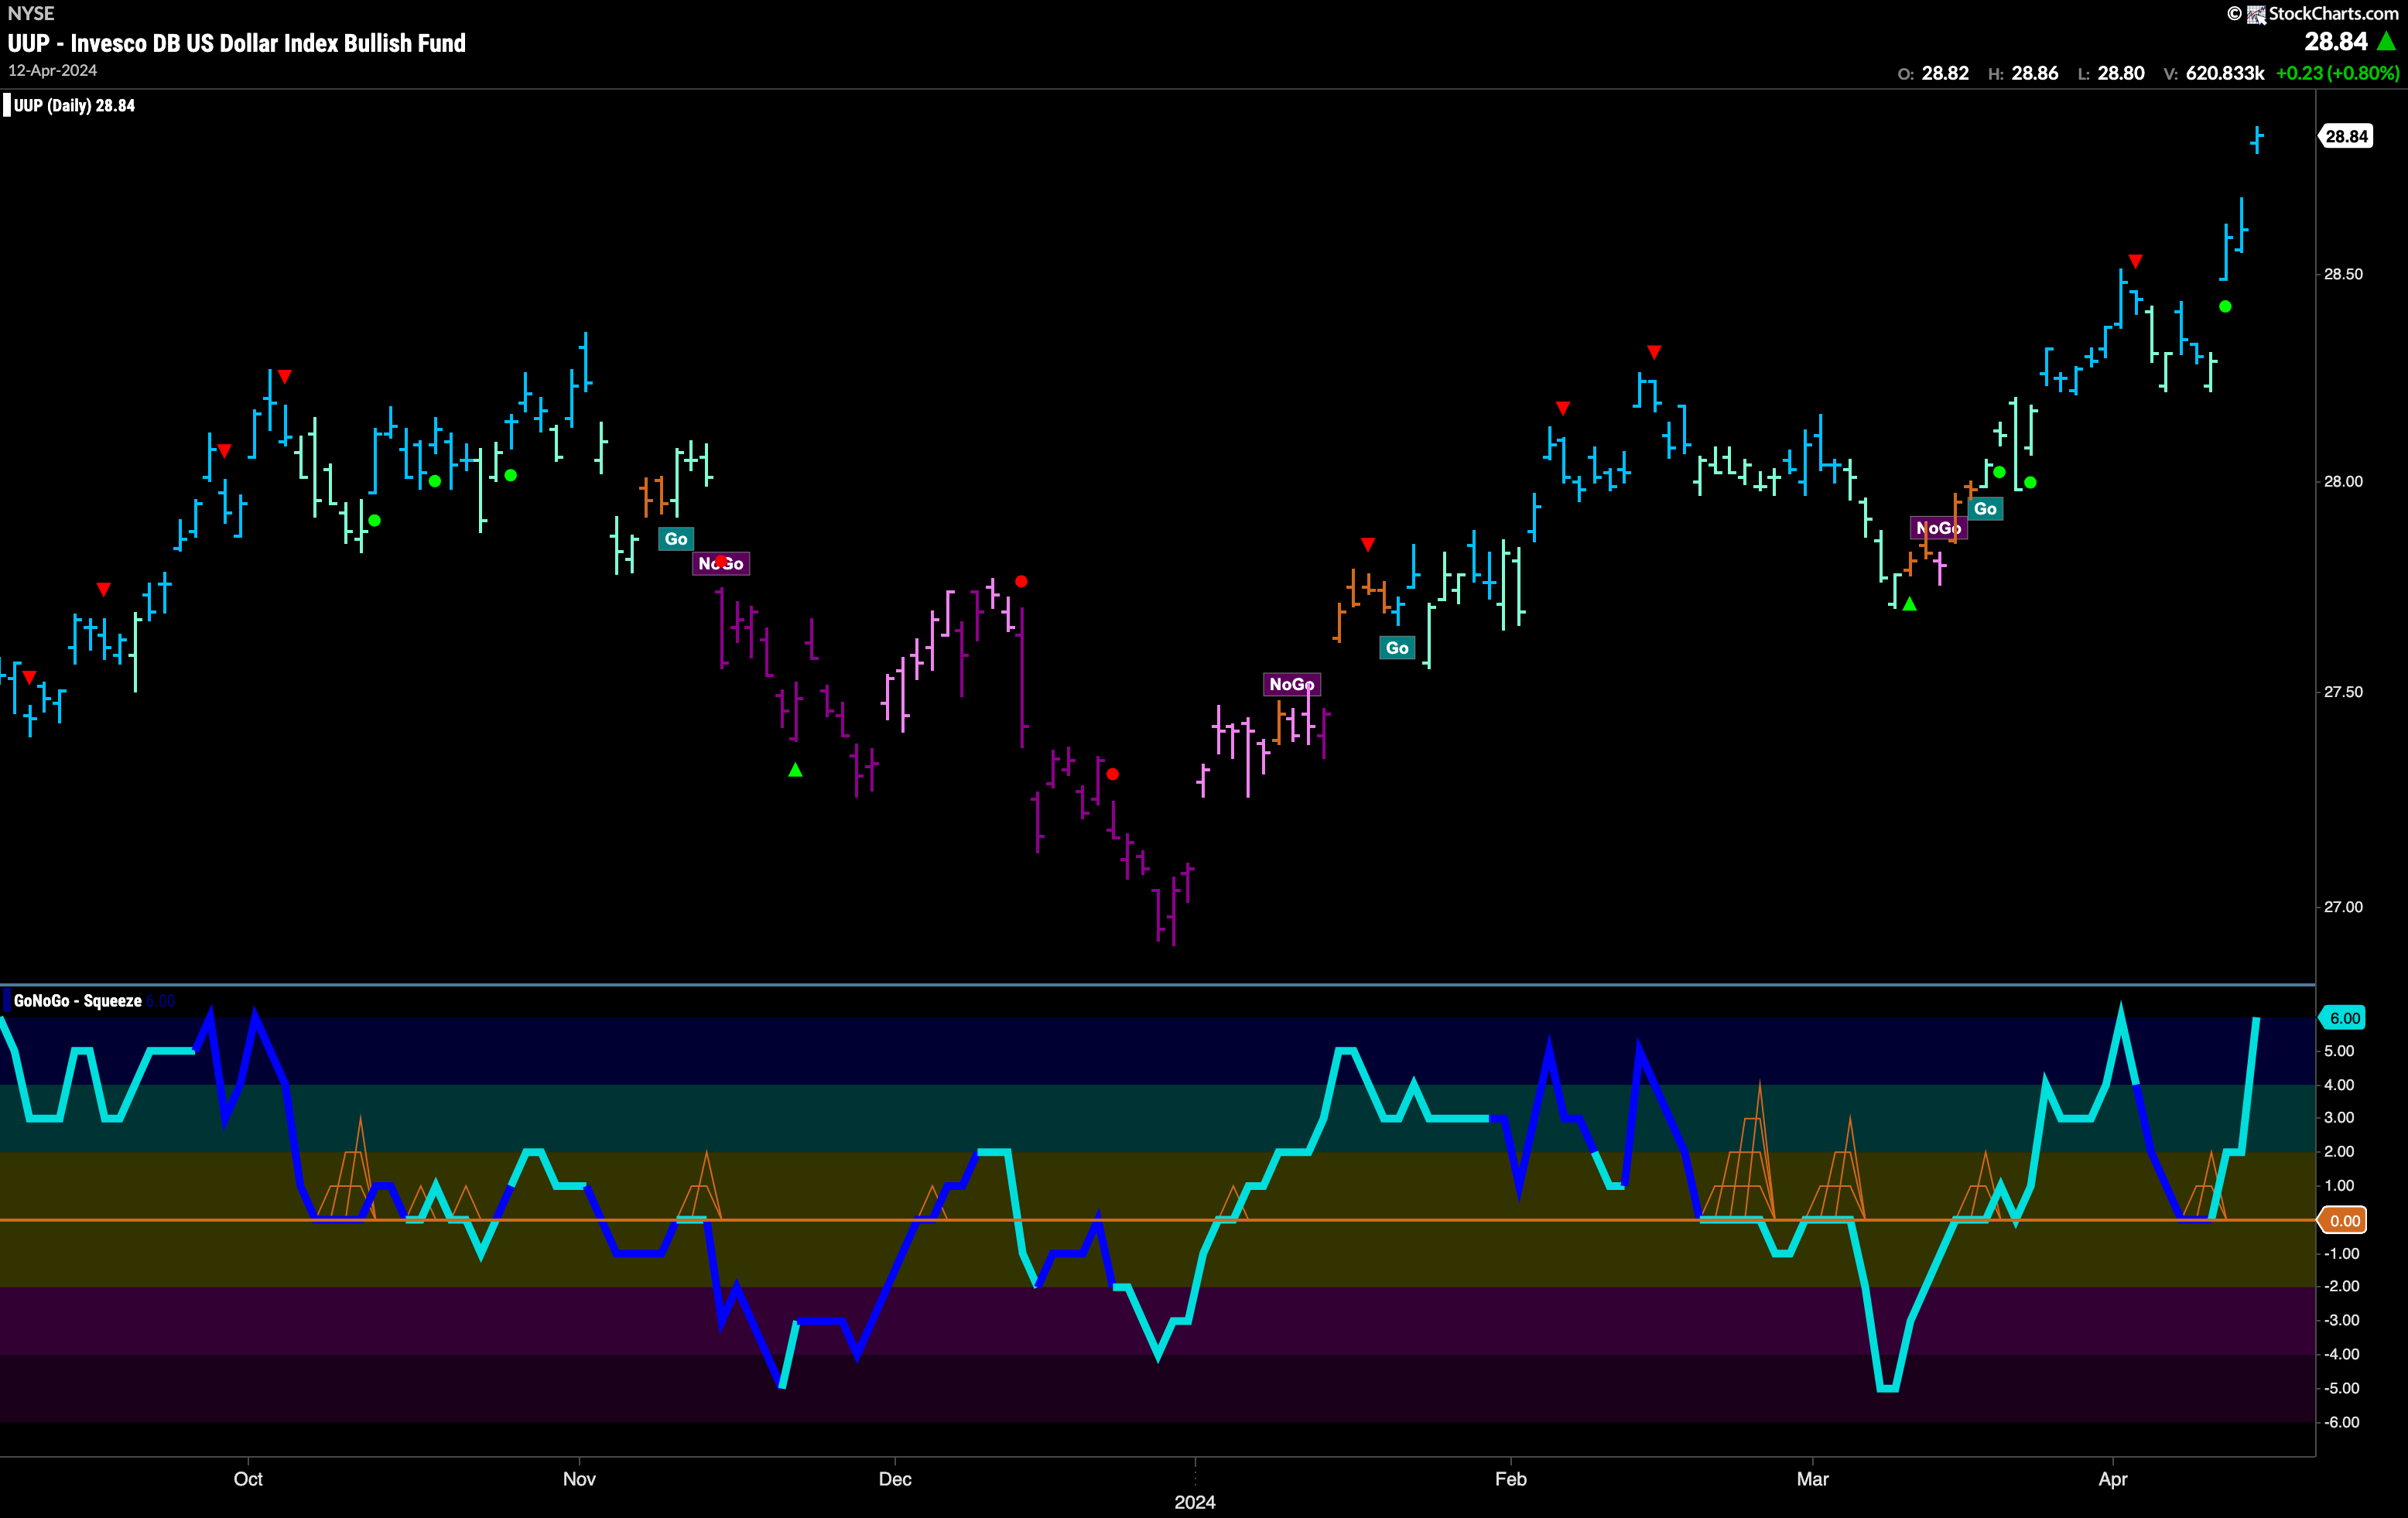
What a bounce for the dollar in the second half of the week. It was no surprise that price pulled back after the Go Countertrend Correction Icon (red arrow) and so as we identified a little trend weakness due to the aqua “Go” bars. It was then important to watch the oscillator panel as it tested the zero line on heavy volume (darker blue oscillator line). Quickly finding support, it rallied back into positive territory and that gave price the push it needed to gap higher twice in 3 days and cement new highs.
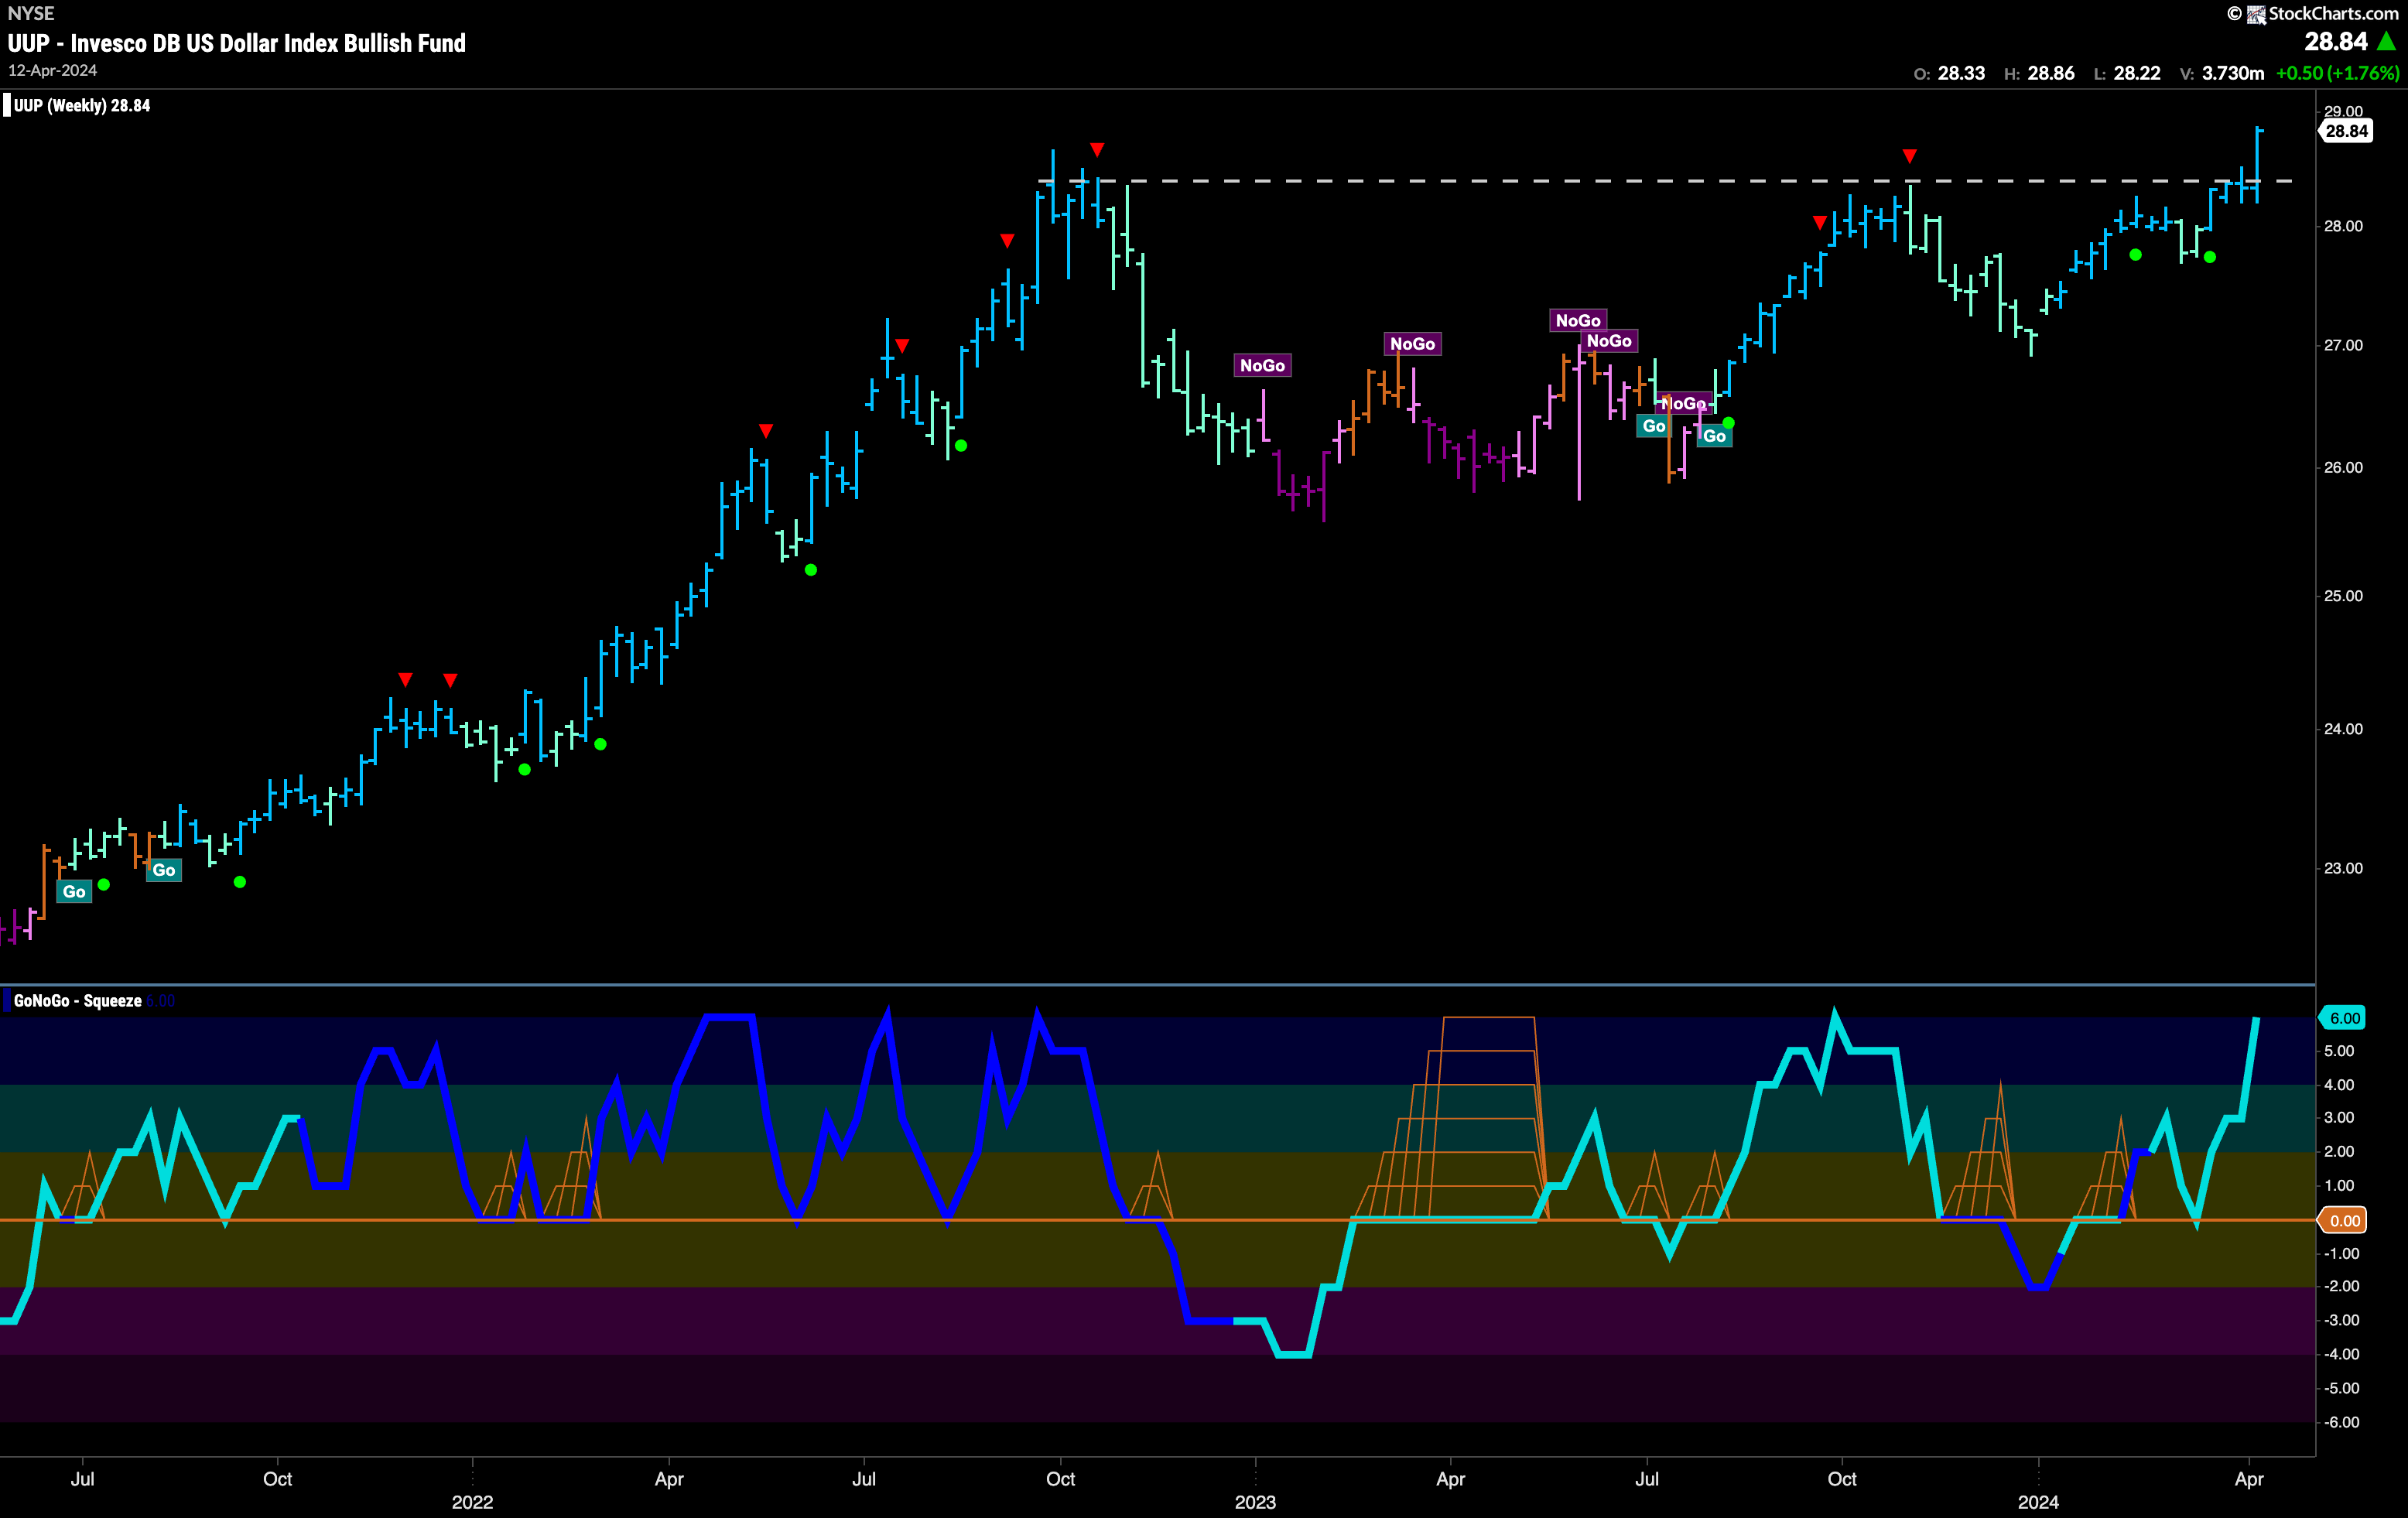
The longer term chart shows that we have clearly broken above a strong resistance level that has been on the chart since October of 2023. With open skies ahead, and momentum surging in the direction of the “Go” trend we will look for price to consolidate at these levels and potentially move higher. GoNoGo Trend is painting strong blue “Go” bars for a 4th consecutive week.
Oil Finding Resistance
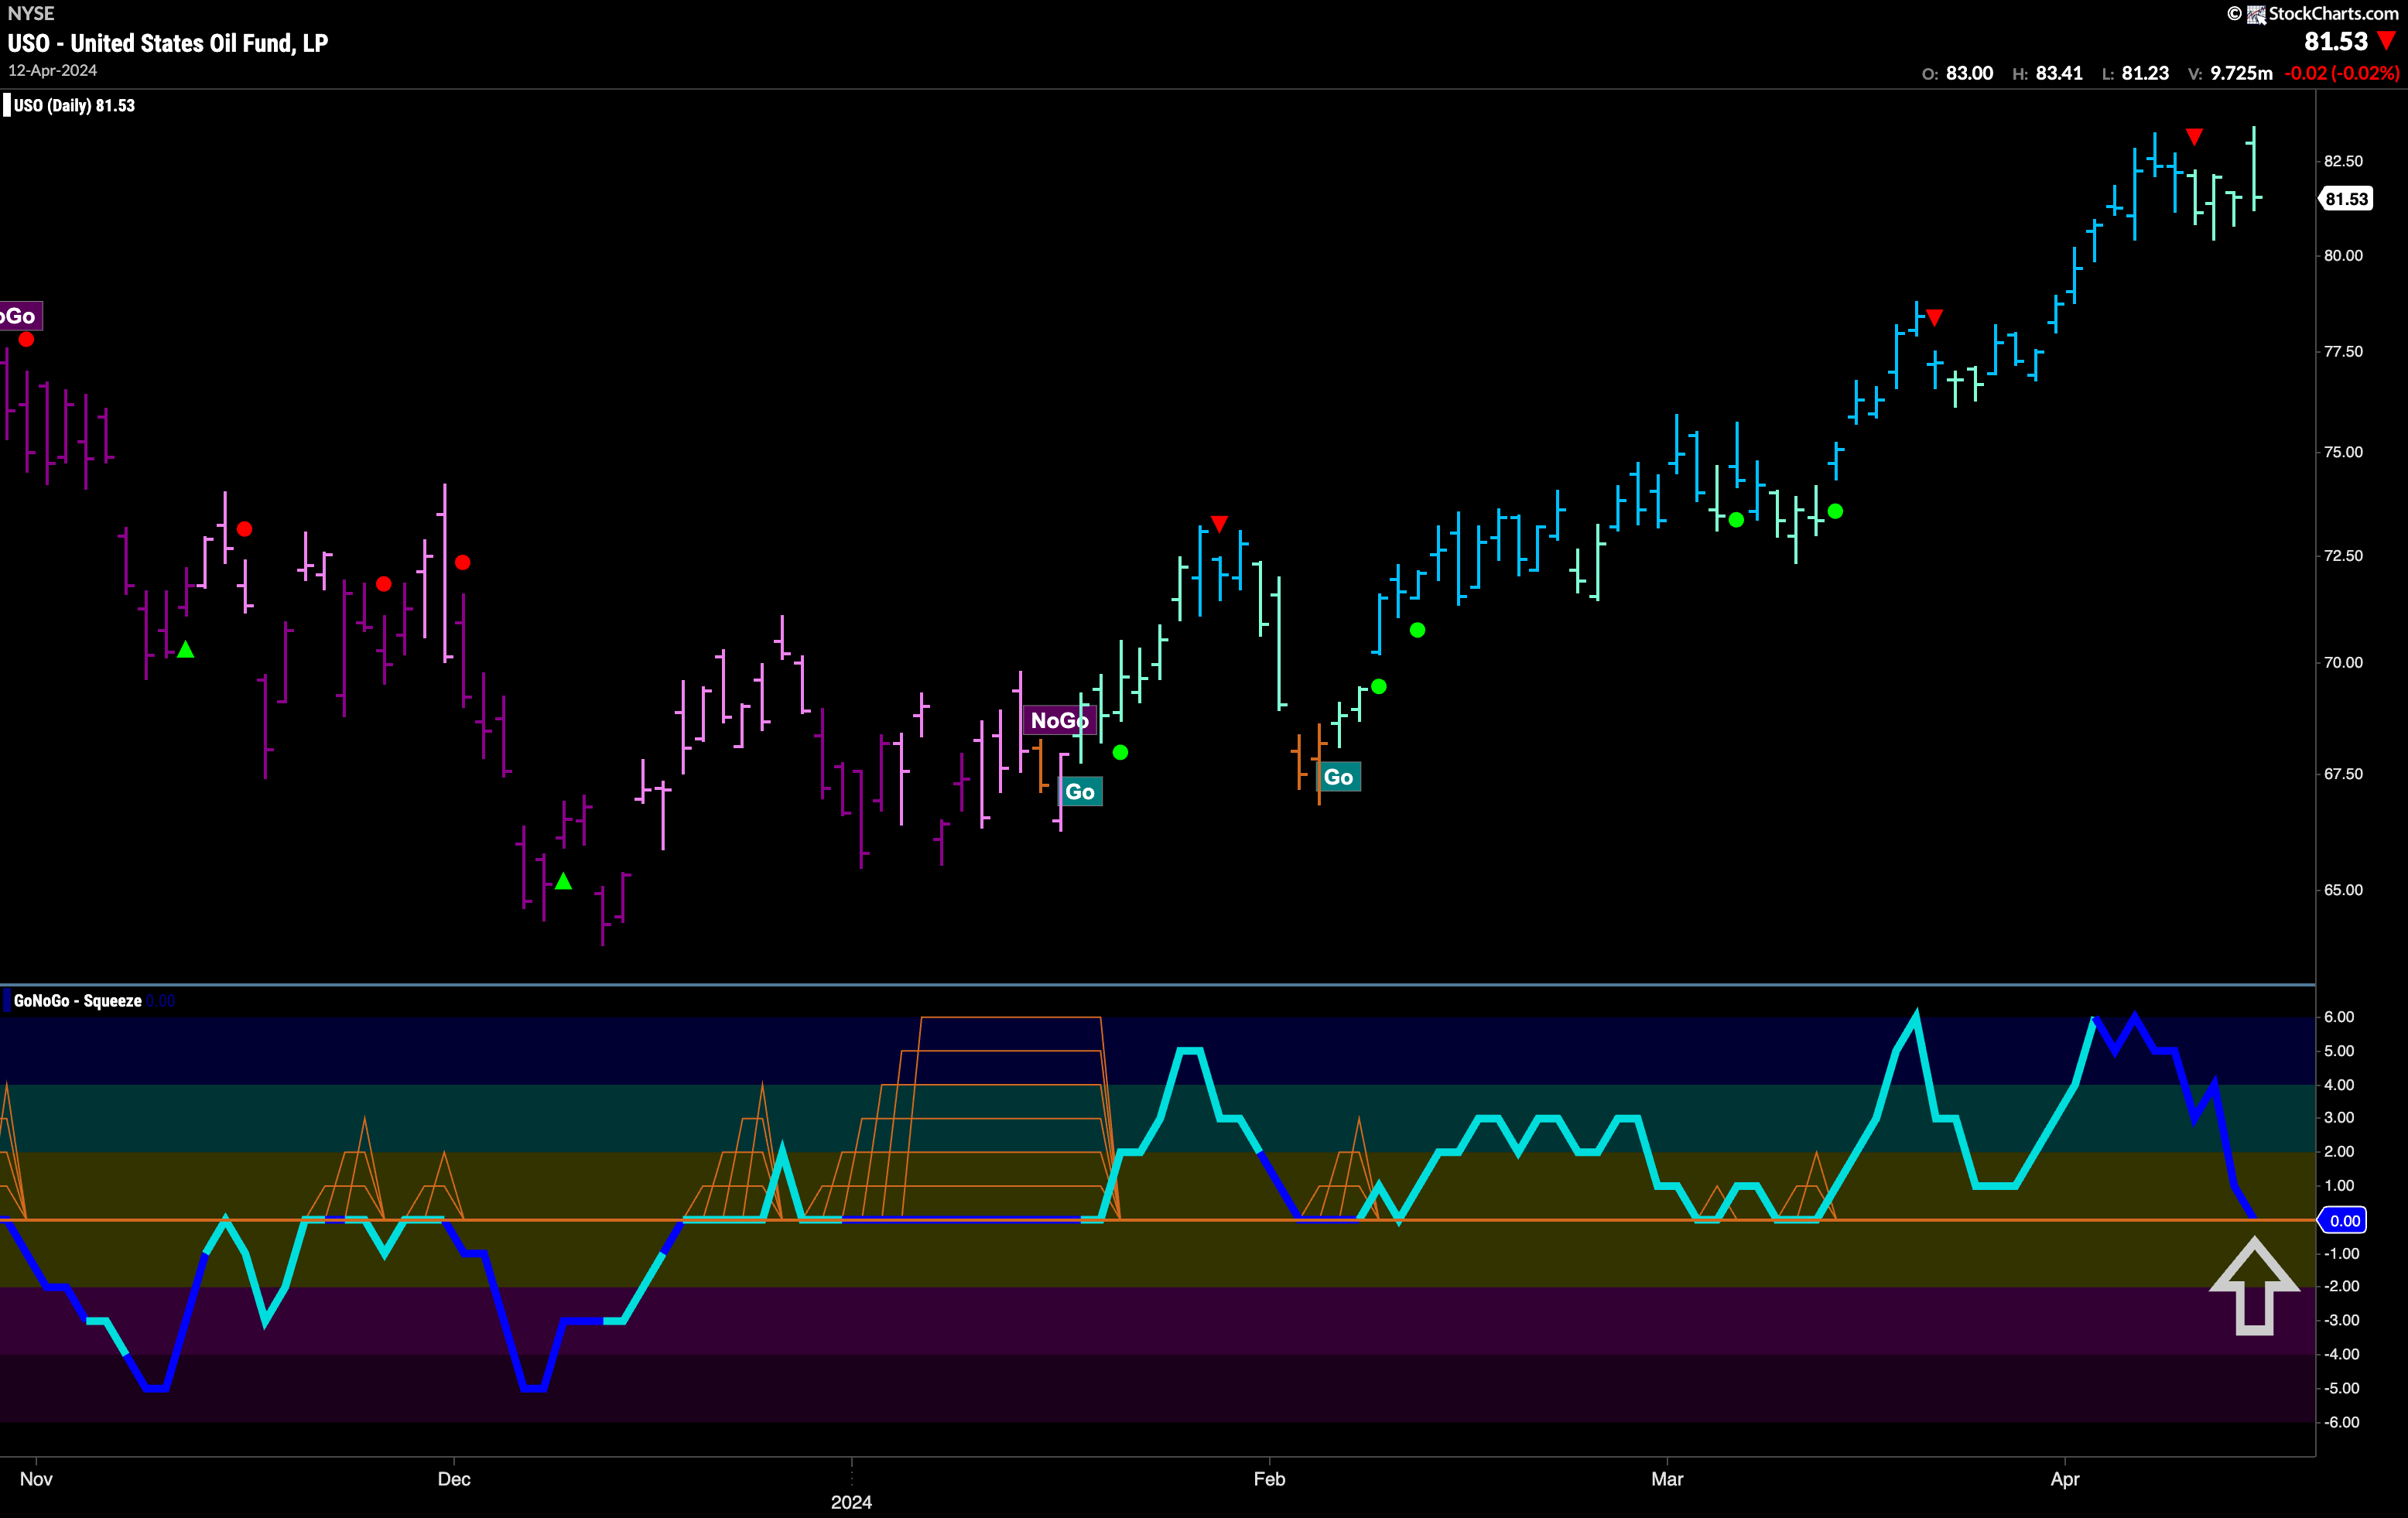
The beginning of the week saw oil prices falling from its most recent high. We saw a Go Countertrend Correction Icon (red arrow) telling us that price may struggle to go higher in the short term. This is because GoNoGo Oscillator had fallen out of overbought territory. Now, as price hit a wall trying to break to new highs, we see GoNoGo Oscillator has fallen to test the zero line on heavy volume. After a string of weaker aqua “Go” bars, it will be important for the oscillator to find support at zero. If it does, and can quickly regain positive territory then we will see a Go Trend Continuation Icon (green circle) under the price bar and can expect price to make another attack on new highs.
Is Gold Finally Tired of Running Higher?
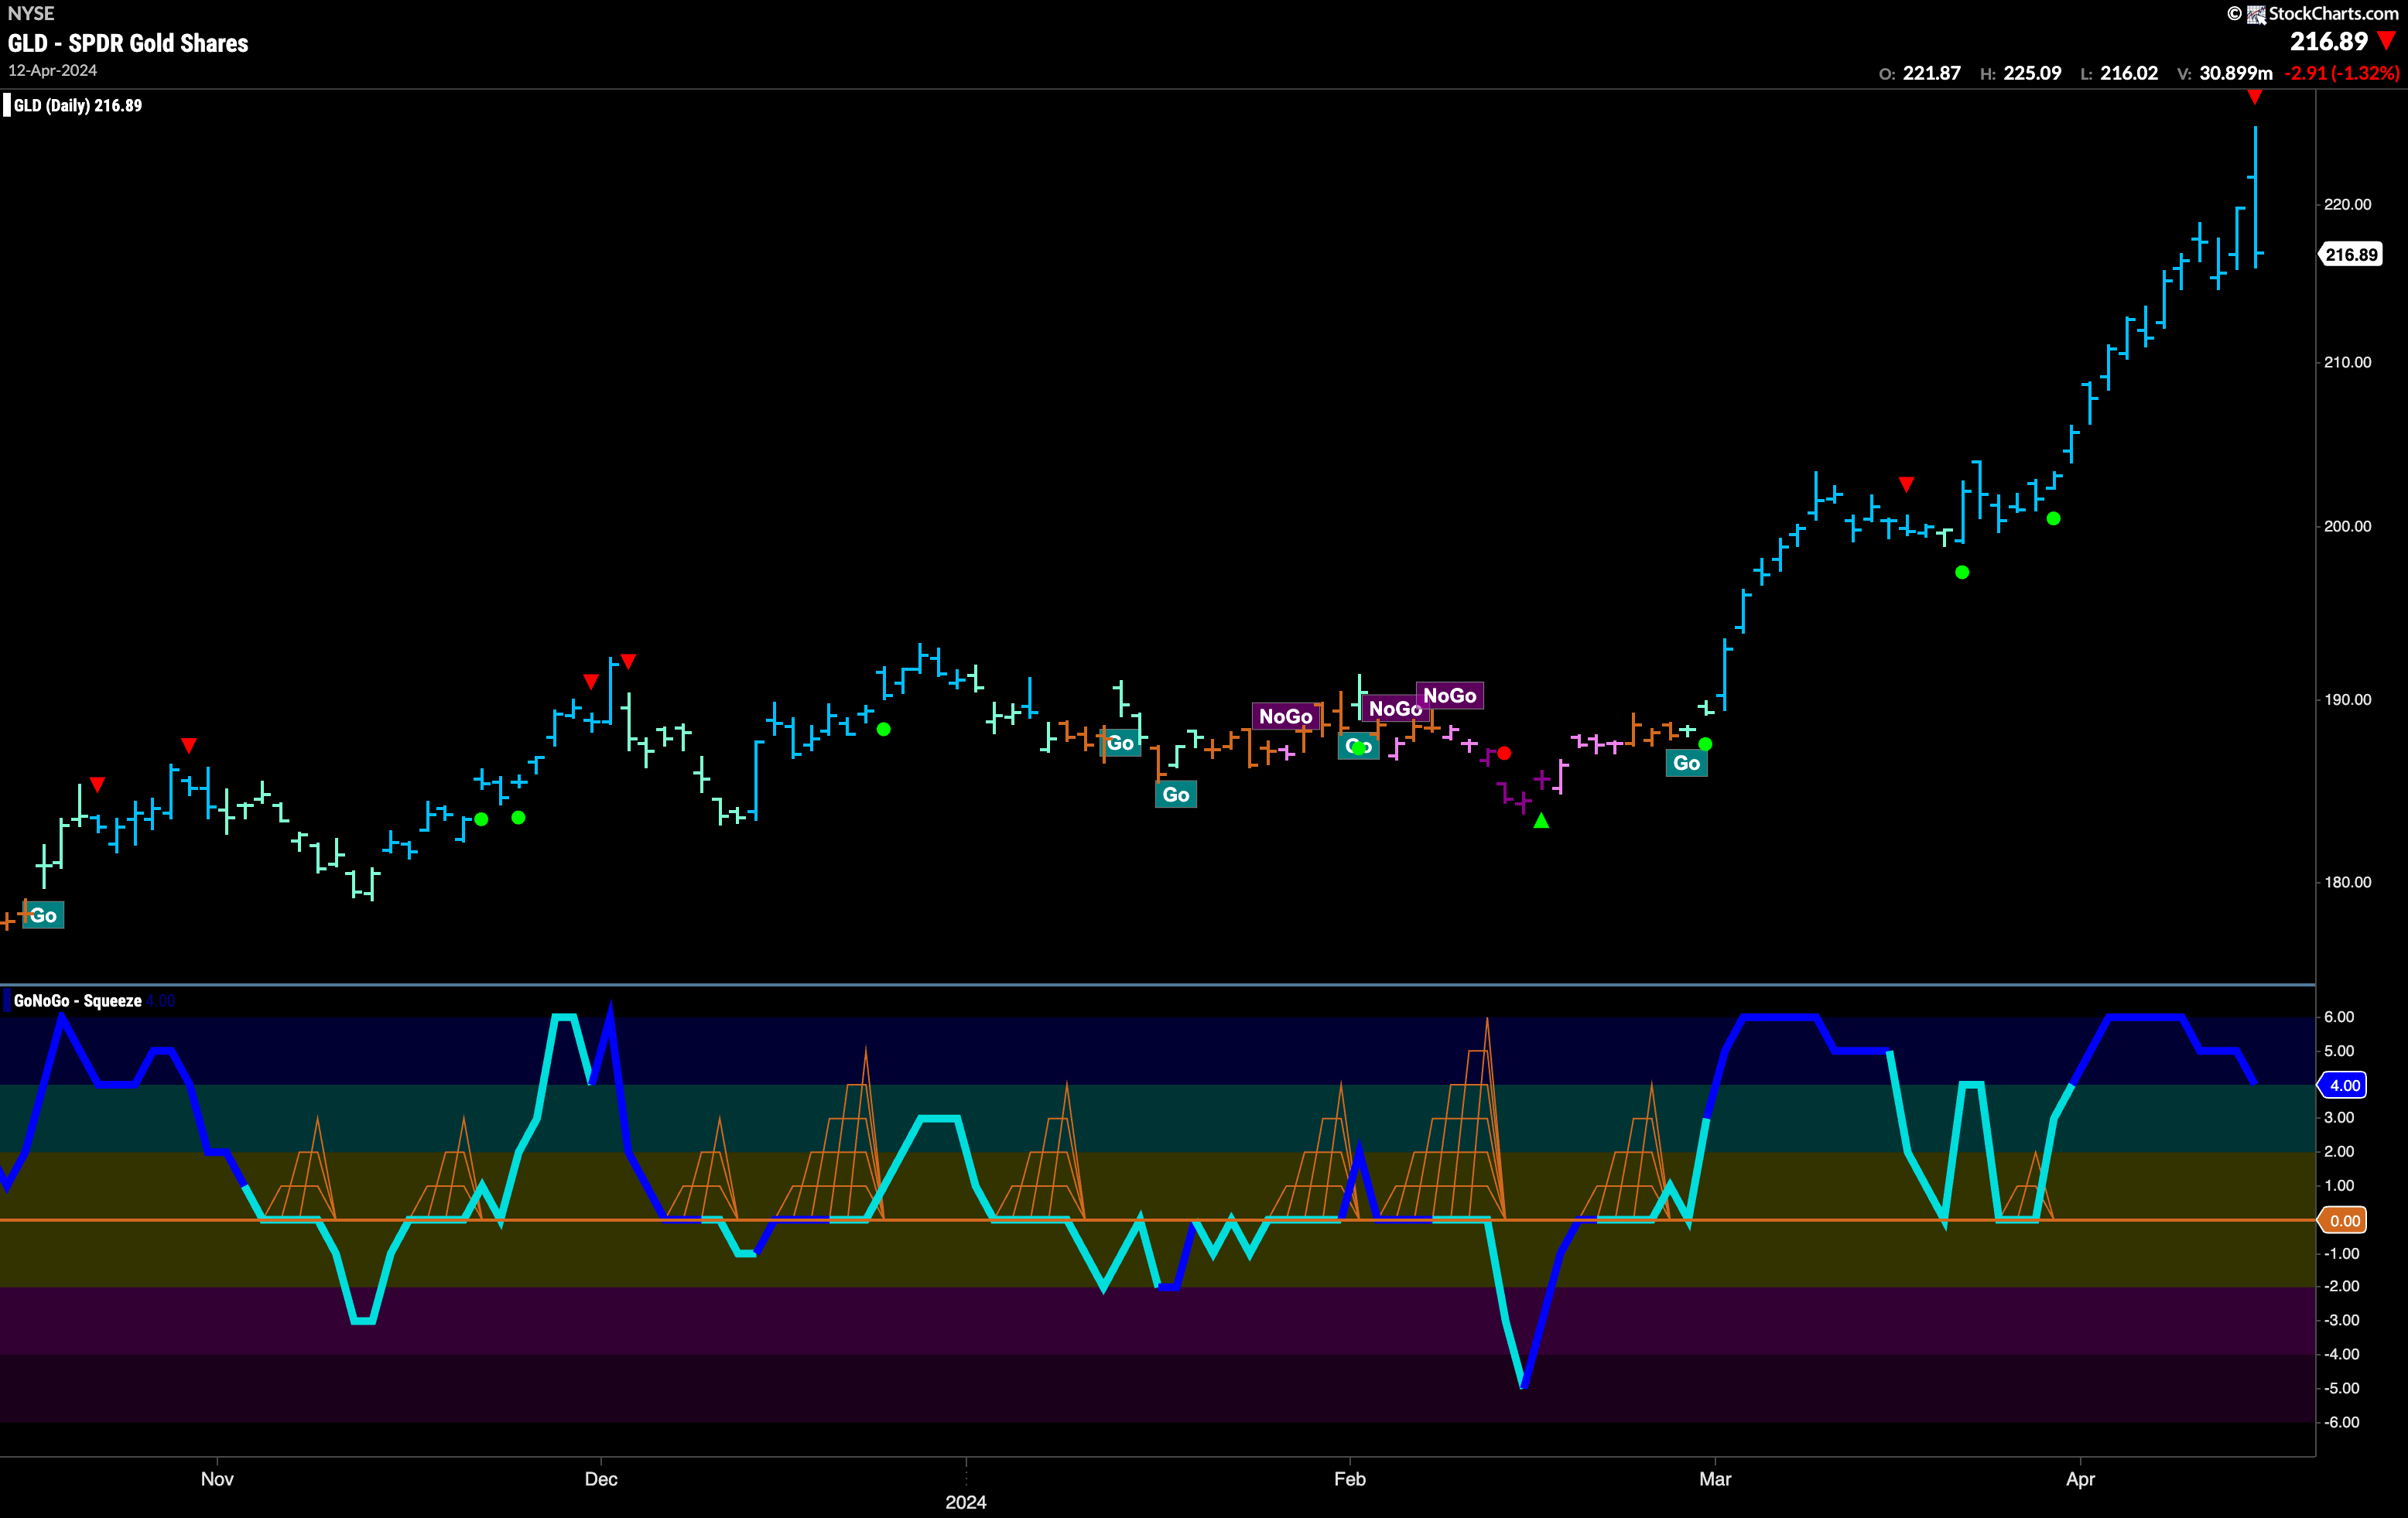
$GLD finally had a tough day. After racing to another intraday high on Friday, it close significantly lower. This price action caused GoNoGo Oscillator to fall out of overbought territory and a Go Countertrend Correction Icon (red arrow) appeared above price indicating that we may struggle to go higher in the short term. Having said that, GoNoGo Trend is still painting strong blue “Go” bars and the oscillator is at a value of 4 on heavy volume.
The monthly chart continues to show just how strong the recent price action has been. It would take quite a pullback for price to sink back to levels that provided such resistance for such a long time. We will look for the top of the horizontal channel to provide support if needed going forward. GoNoGo Oscillator is at an extreme overbought level of 6 and so if momentum does wane, we will likely see a Go Countertrend Correction Icon and price take a pause at these new higher highs. 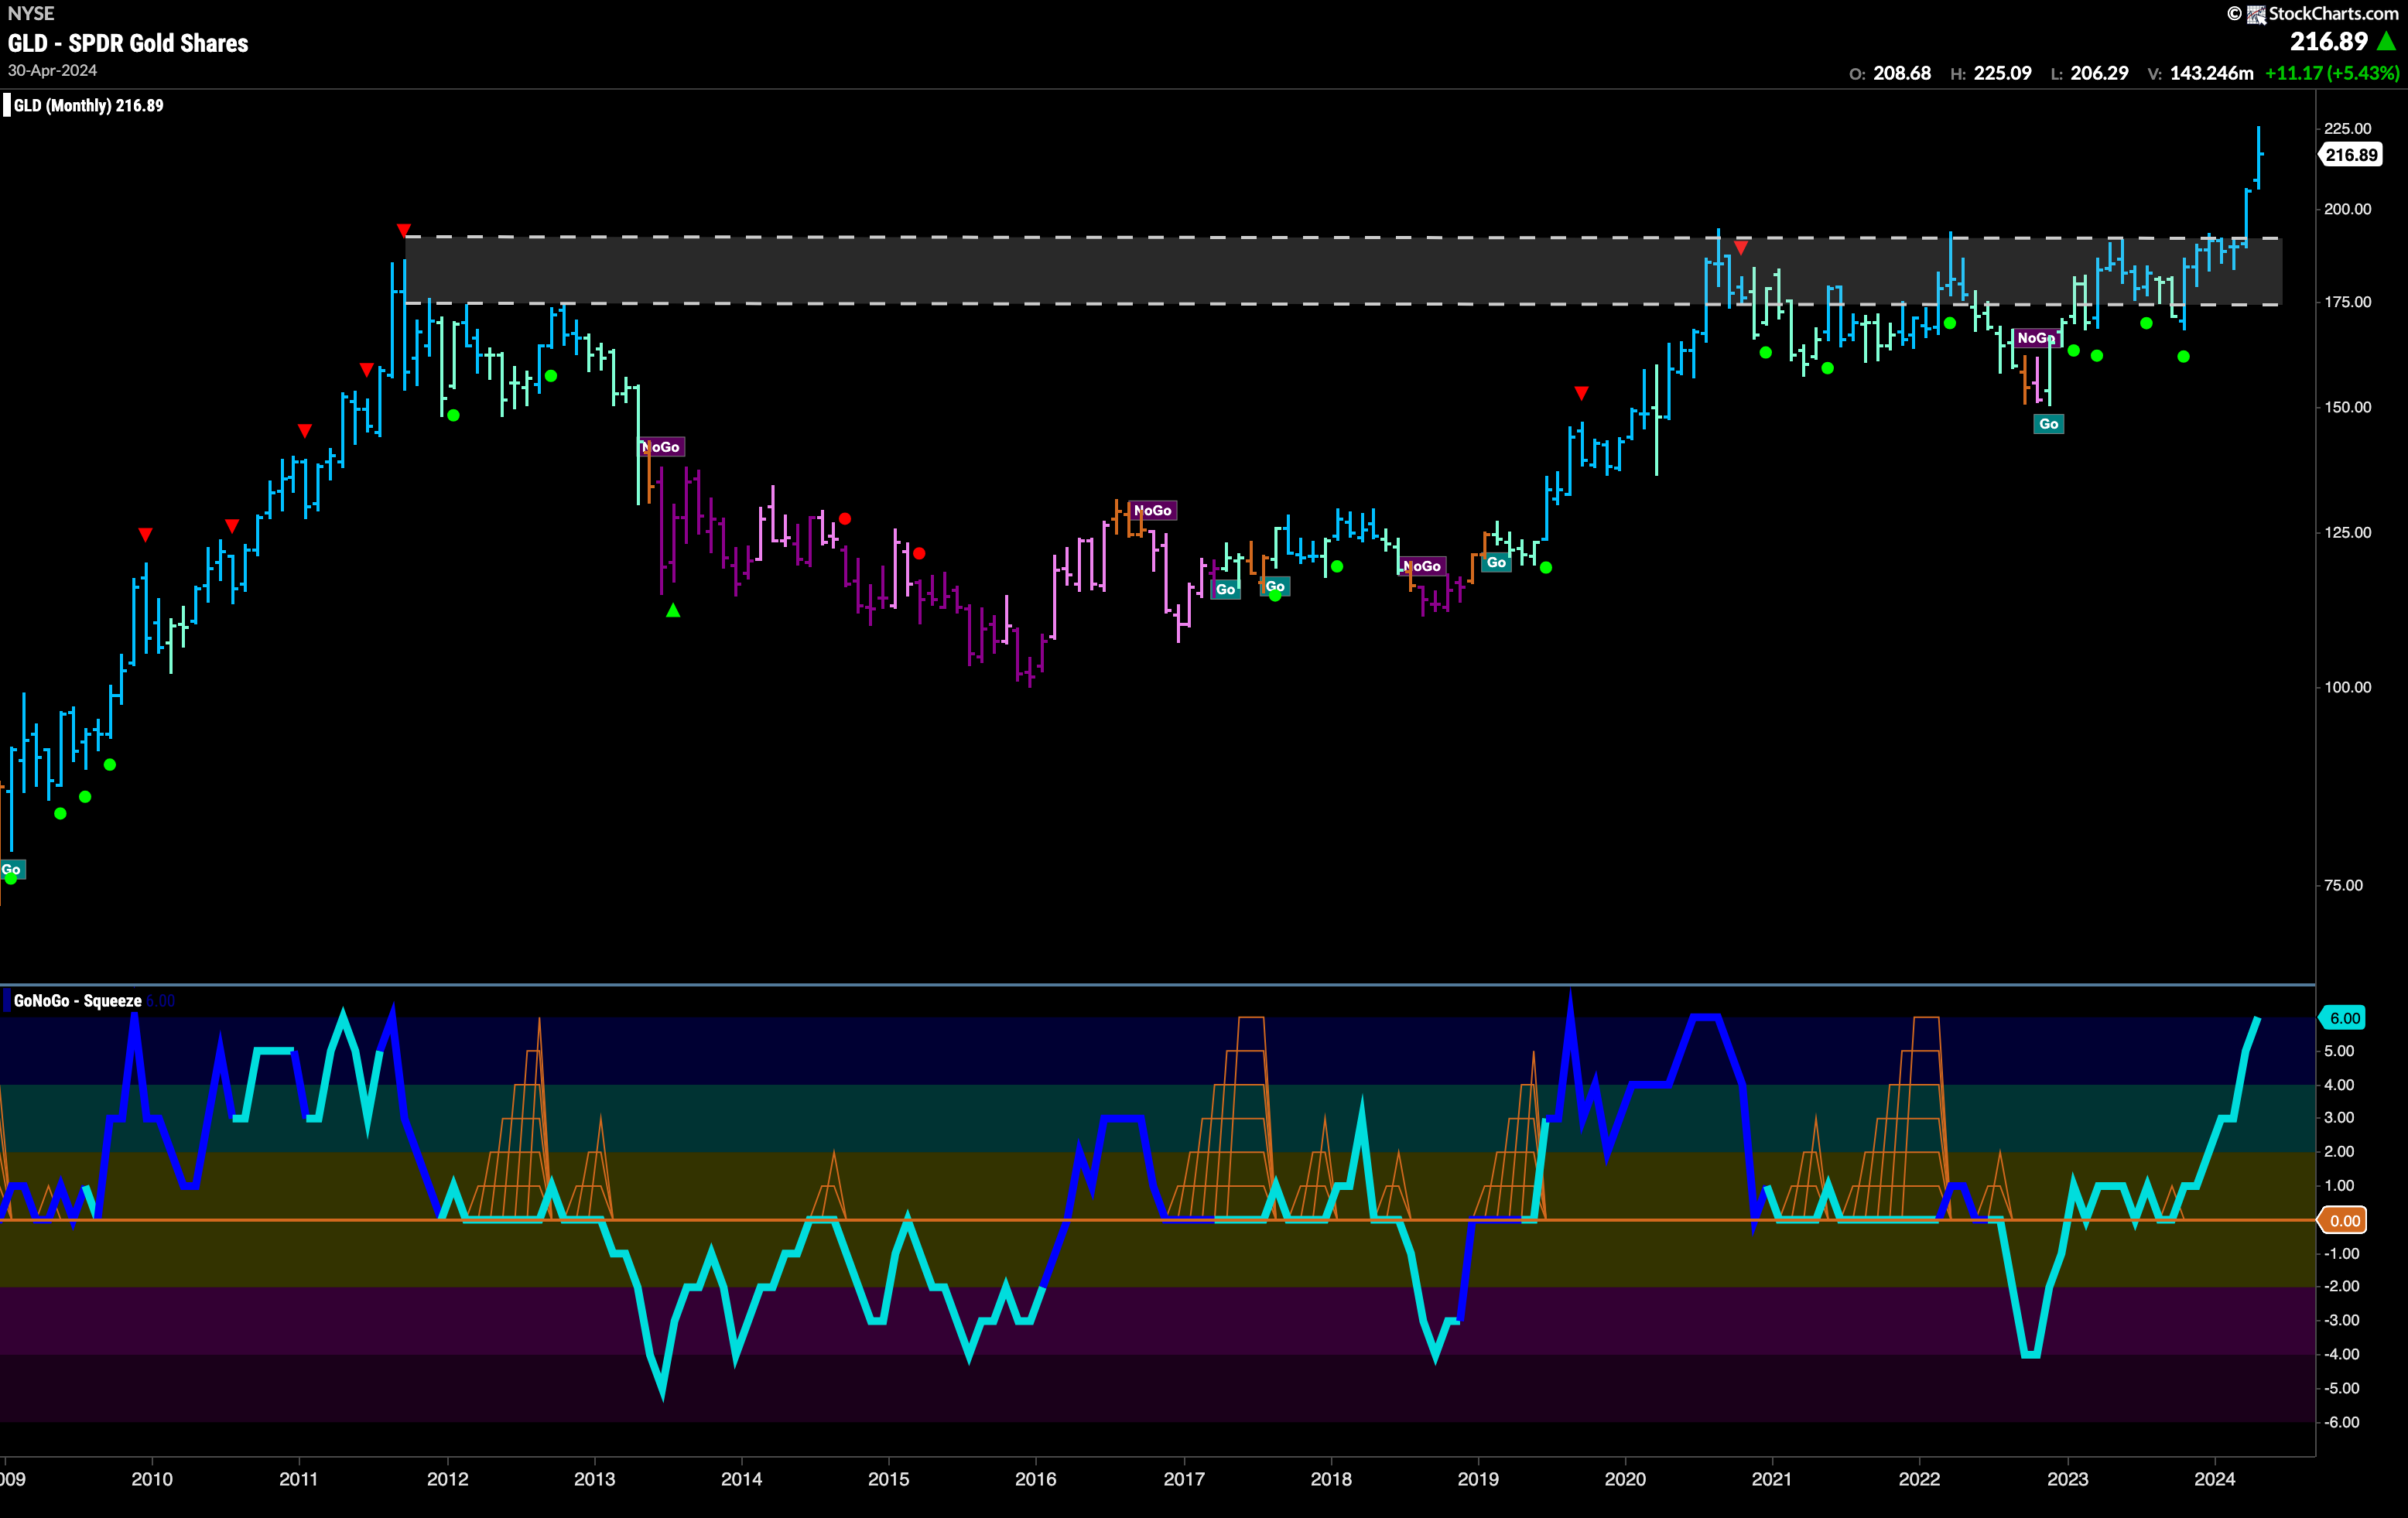
Sector RelMap
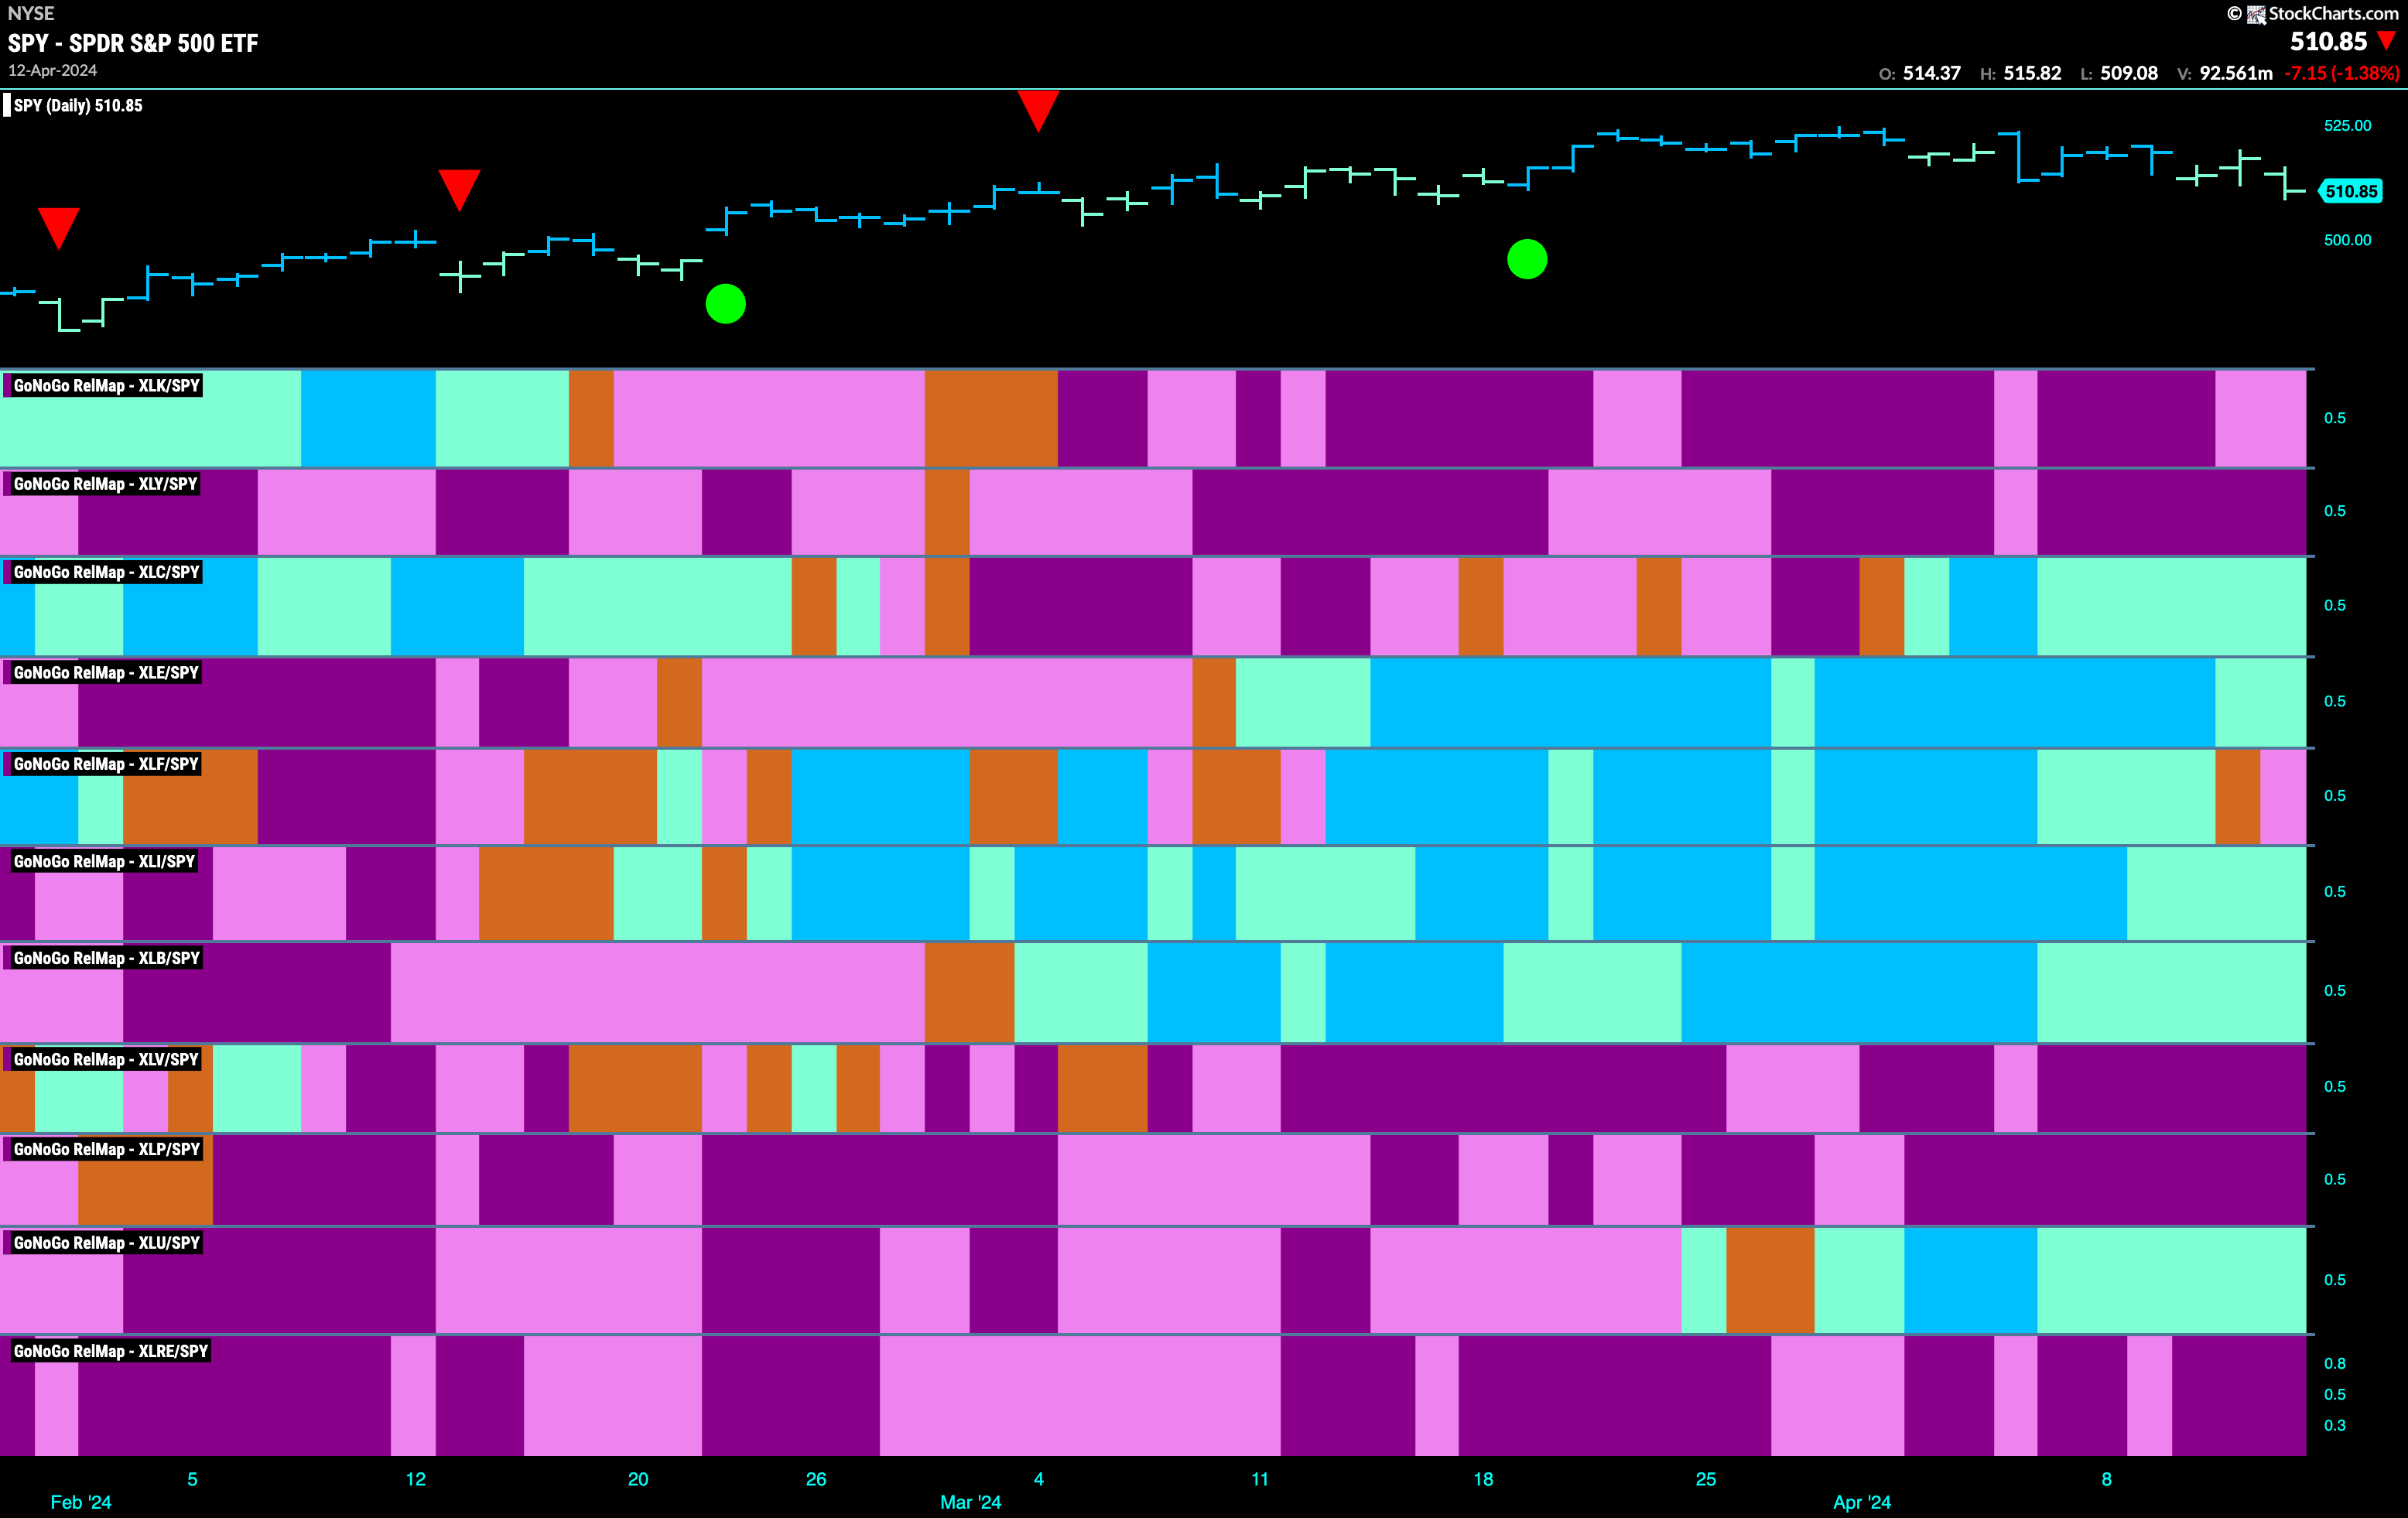
Below is the GoNoGo Sector RelMap. This GoNoGo RelMap applies the GoNoGo Trend to the relative strength ratios of the sectors to the base index. Looking at this map, we can quickly see where the relative outperformance is coming from as well as which sectors are lagging on a relative basis. 5 sectors are outperforming the base index this week. $XLC, $XLE, $XLI, $XLB, and $XLU are painting relative “Go” bars.
Industrials Sub-Group RelMap
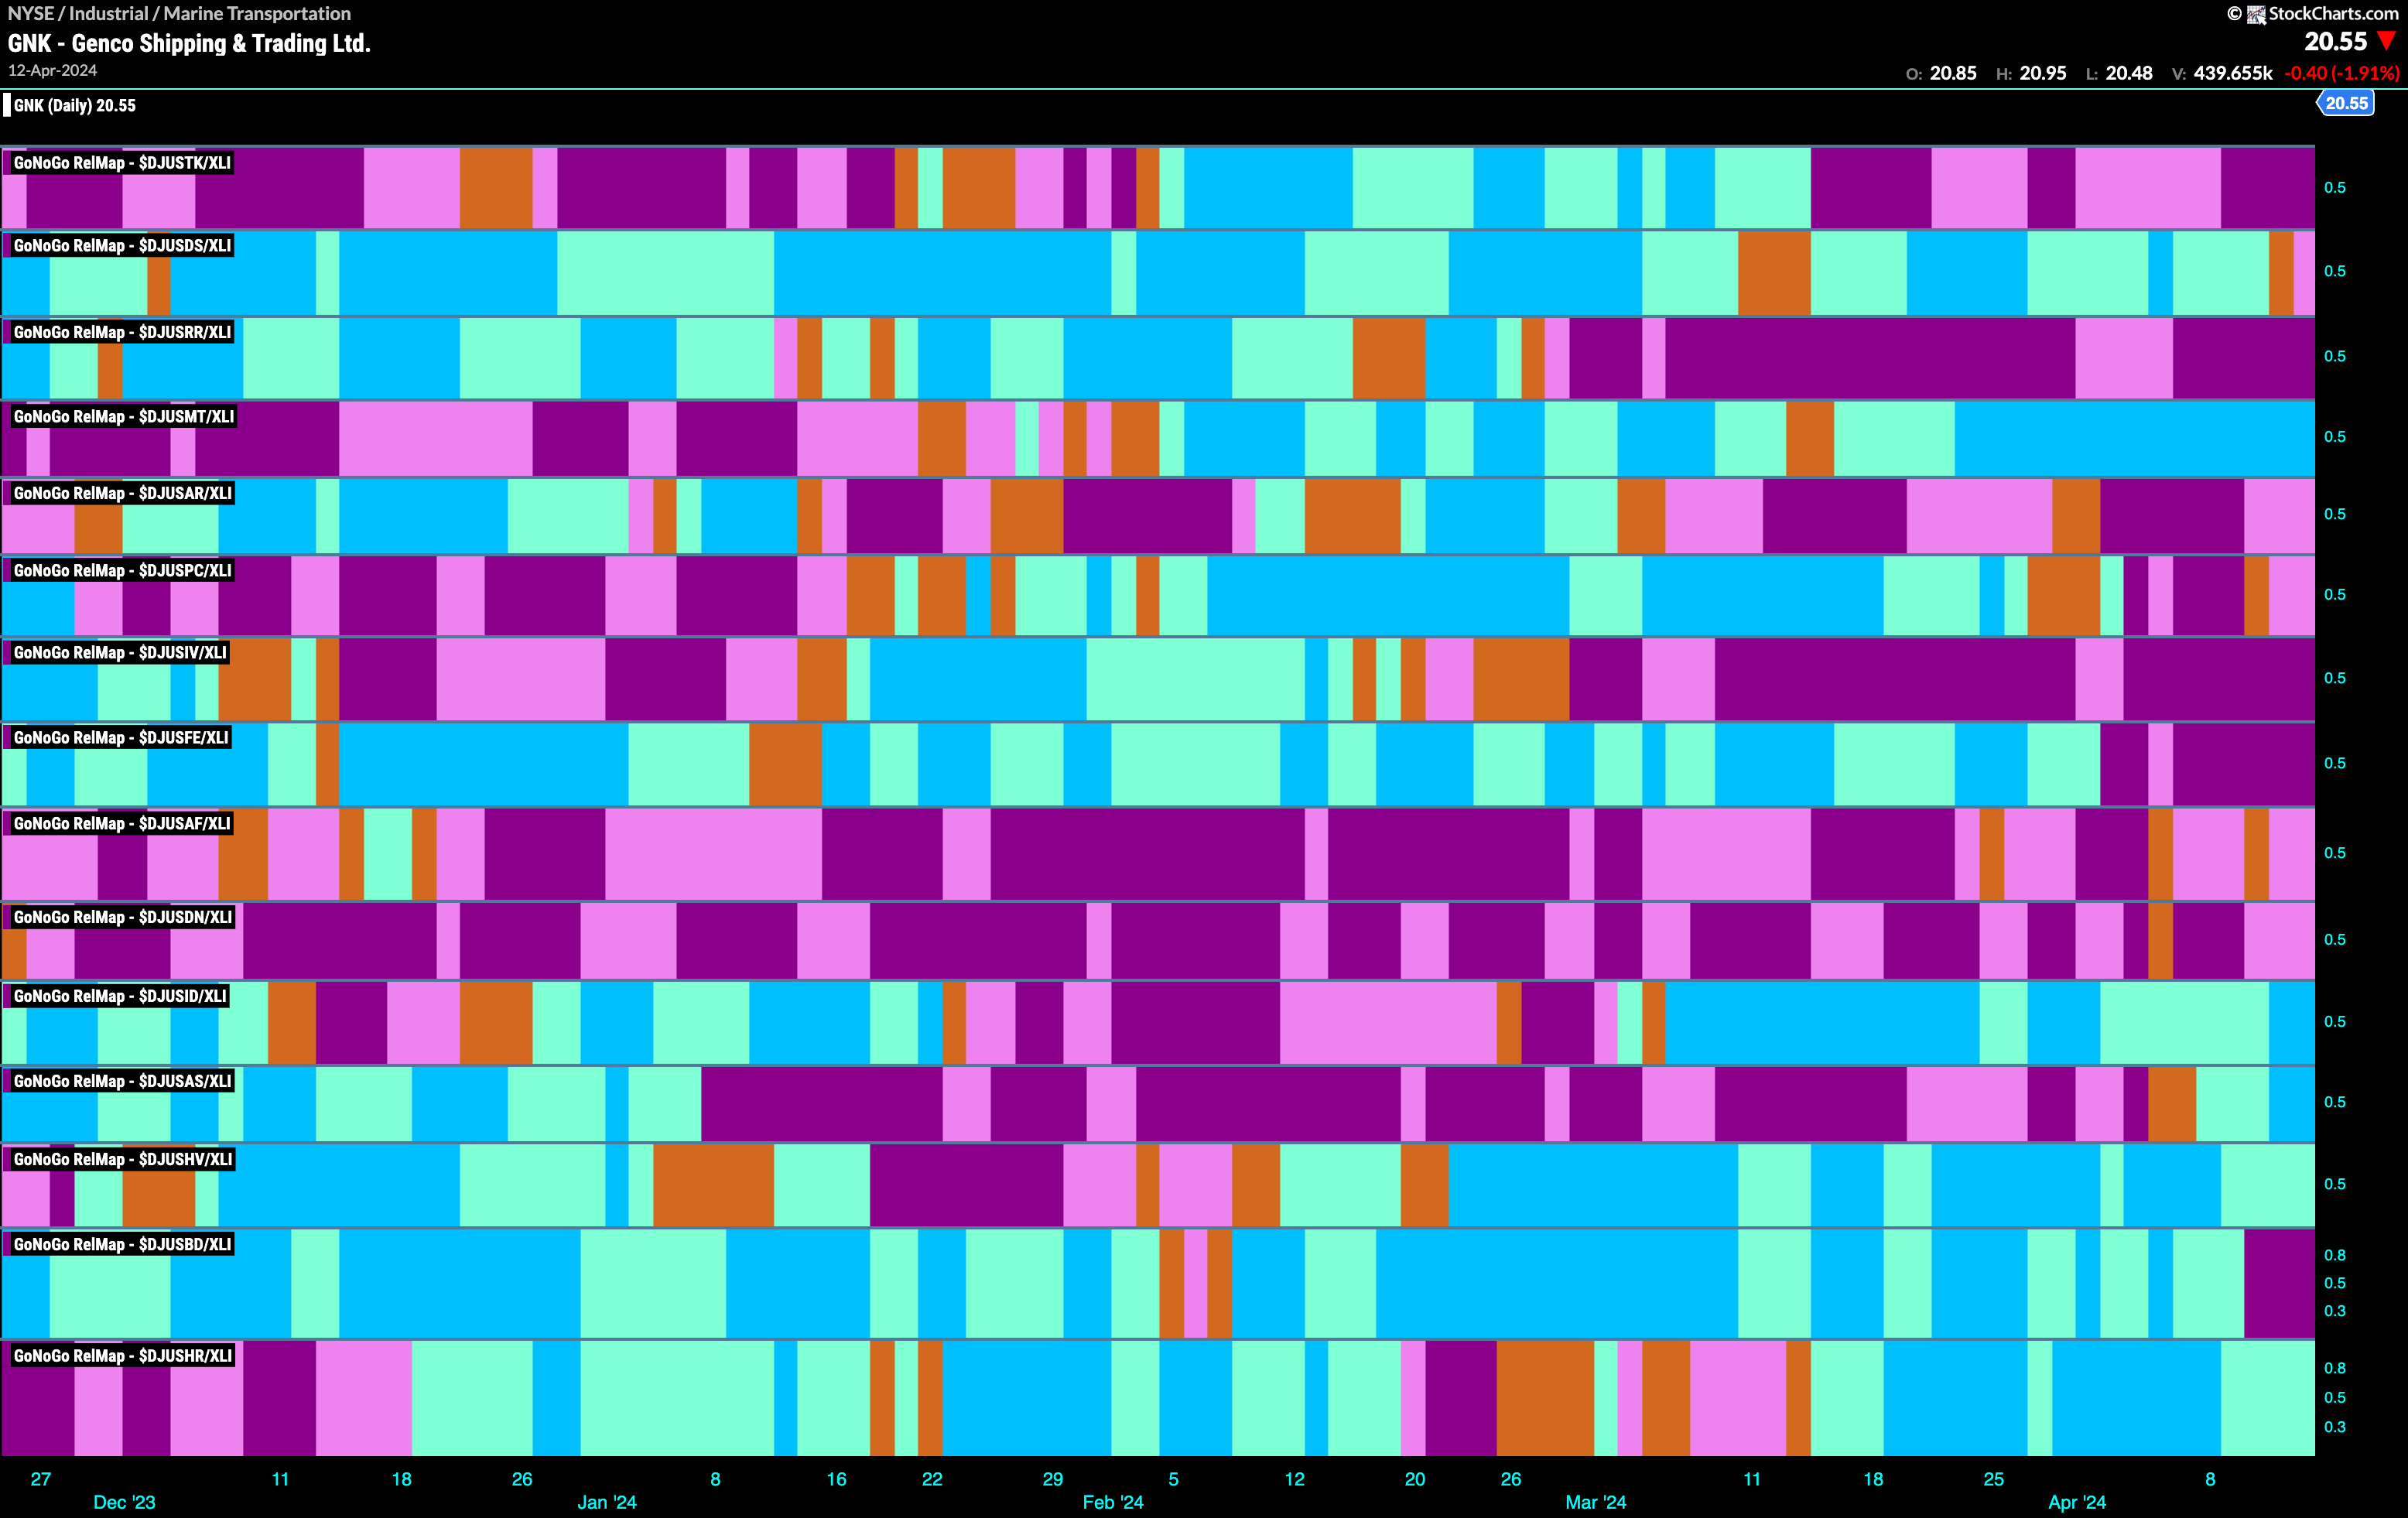
The GoNoGo Sector RelMap above shows that the industrials sector has been the most consistent out-performer as its relative “Go” trend has lasted longer than any other sector. When we look at the sub industry group GoNoGo RelMap below we can see that there are a few groups that are pushing the industrial sector higher. One of these, Marine Transportation (4th panel) has been in relative “Go” trend for a few weeks and is painting consistent bright blue “Go” bars. We will watch to see if this trend persists and identify some opportunities below.
$NMM Setting up for Higher Highs?
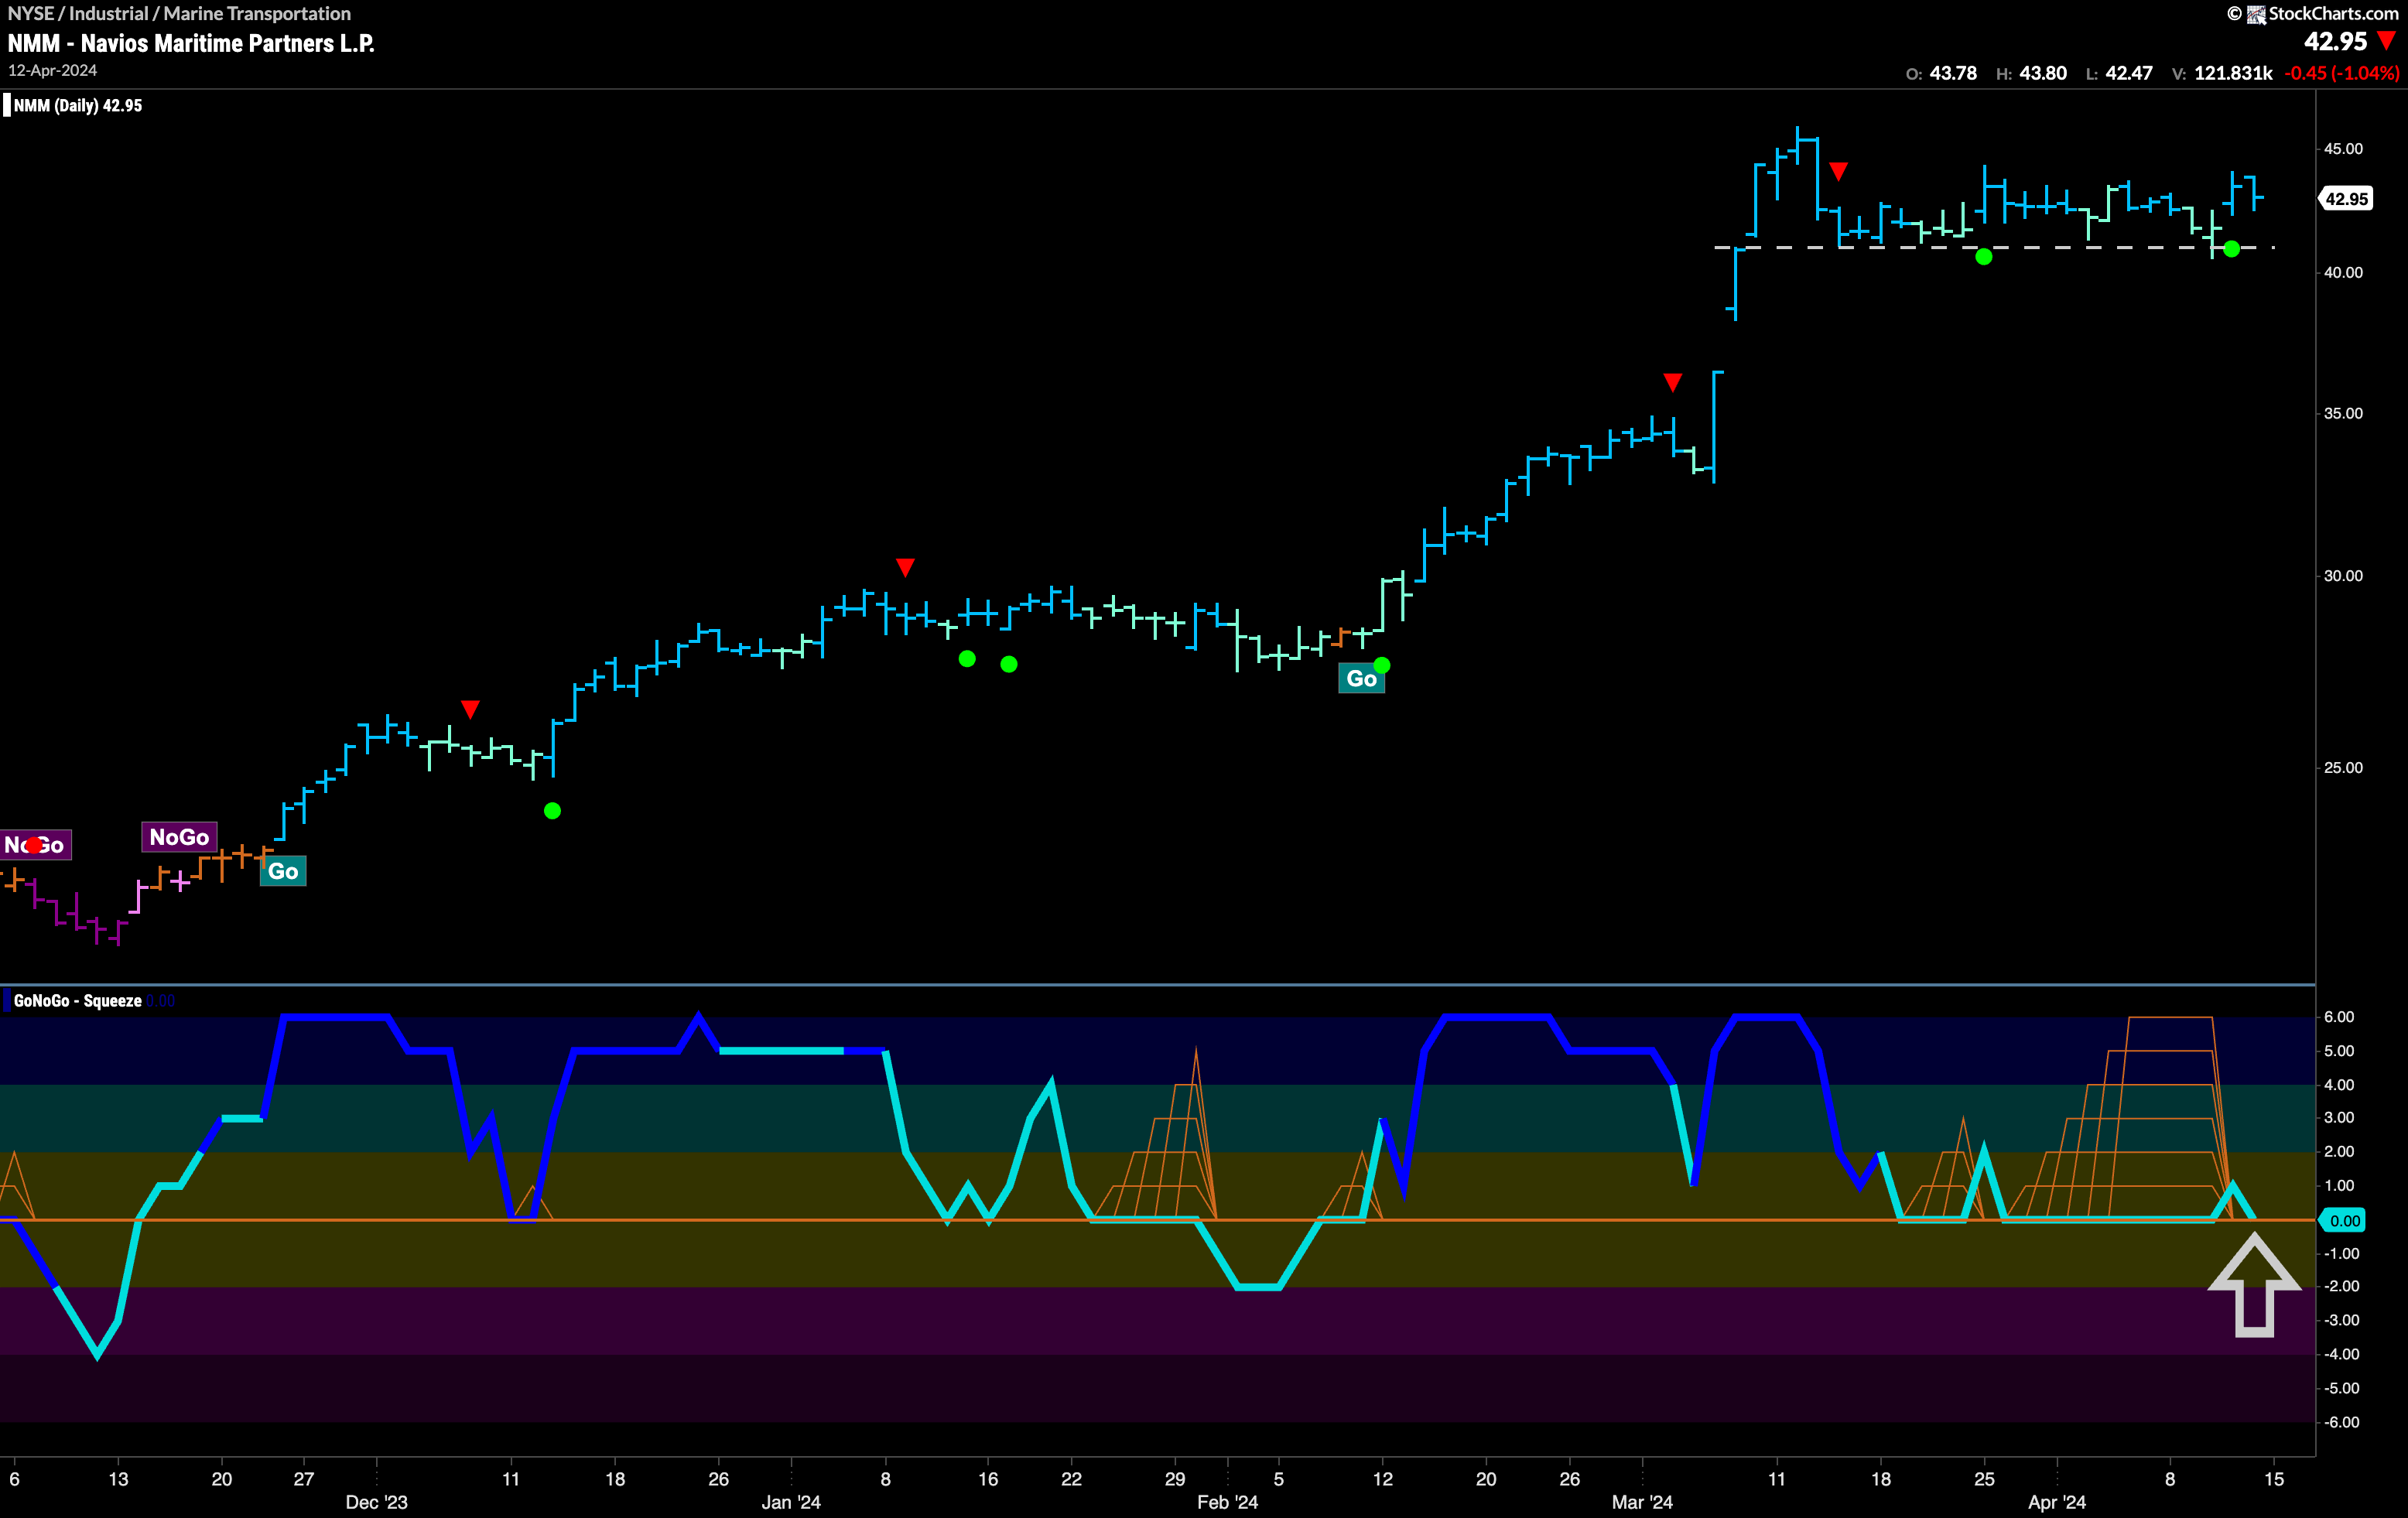
Below is the chart of Navios Maritime Partners L.P. We can see that the “Go” trend has been in place sor several months and during this time GoNoGo Oscillator has primarily been finding support at the zero line. After the most recent leg higher, we saw a Go Countertrend Correction Icon (red arrow) which told us that price may struggle to higher in the short term. This has been the case, with price moving mostly sideways since. We have seen support at the horizontal level on the chart and if we look at the lower panel we see that the GoNoGo Oscillator fell to test the zero line after the most recent high. Importantly, it has not fallen into negative territory. In fact, we see a Max GoNoGo Squeeze as the oscillator remained at zero for an extended period of time. This helps us visualize reduced volatility and a lack of directional momentum. We are watching closely now as the oscillator tries to move into positive territory, breaking the tug of war between buyers and sellers at this level. If the oscillator can rally back into positive territory then we will expect the resurgent momentum in the direction of the “Go” trend to help price push to make an attack on new highs.
$MATX Looks to end Uncertainty
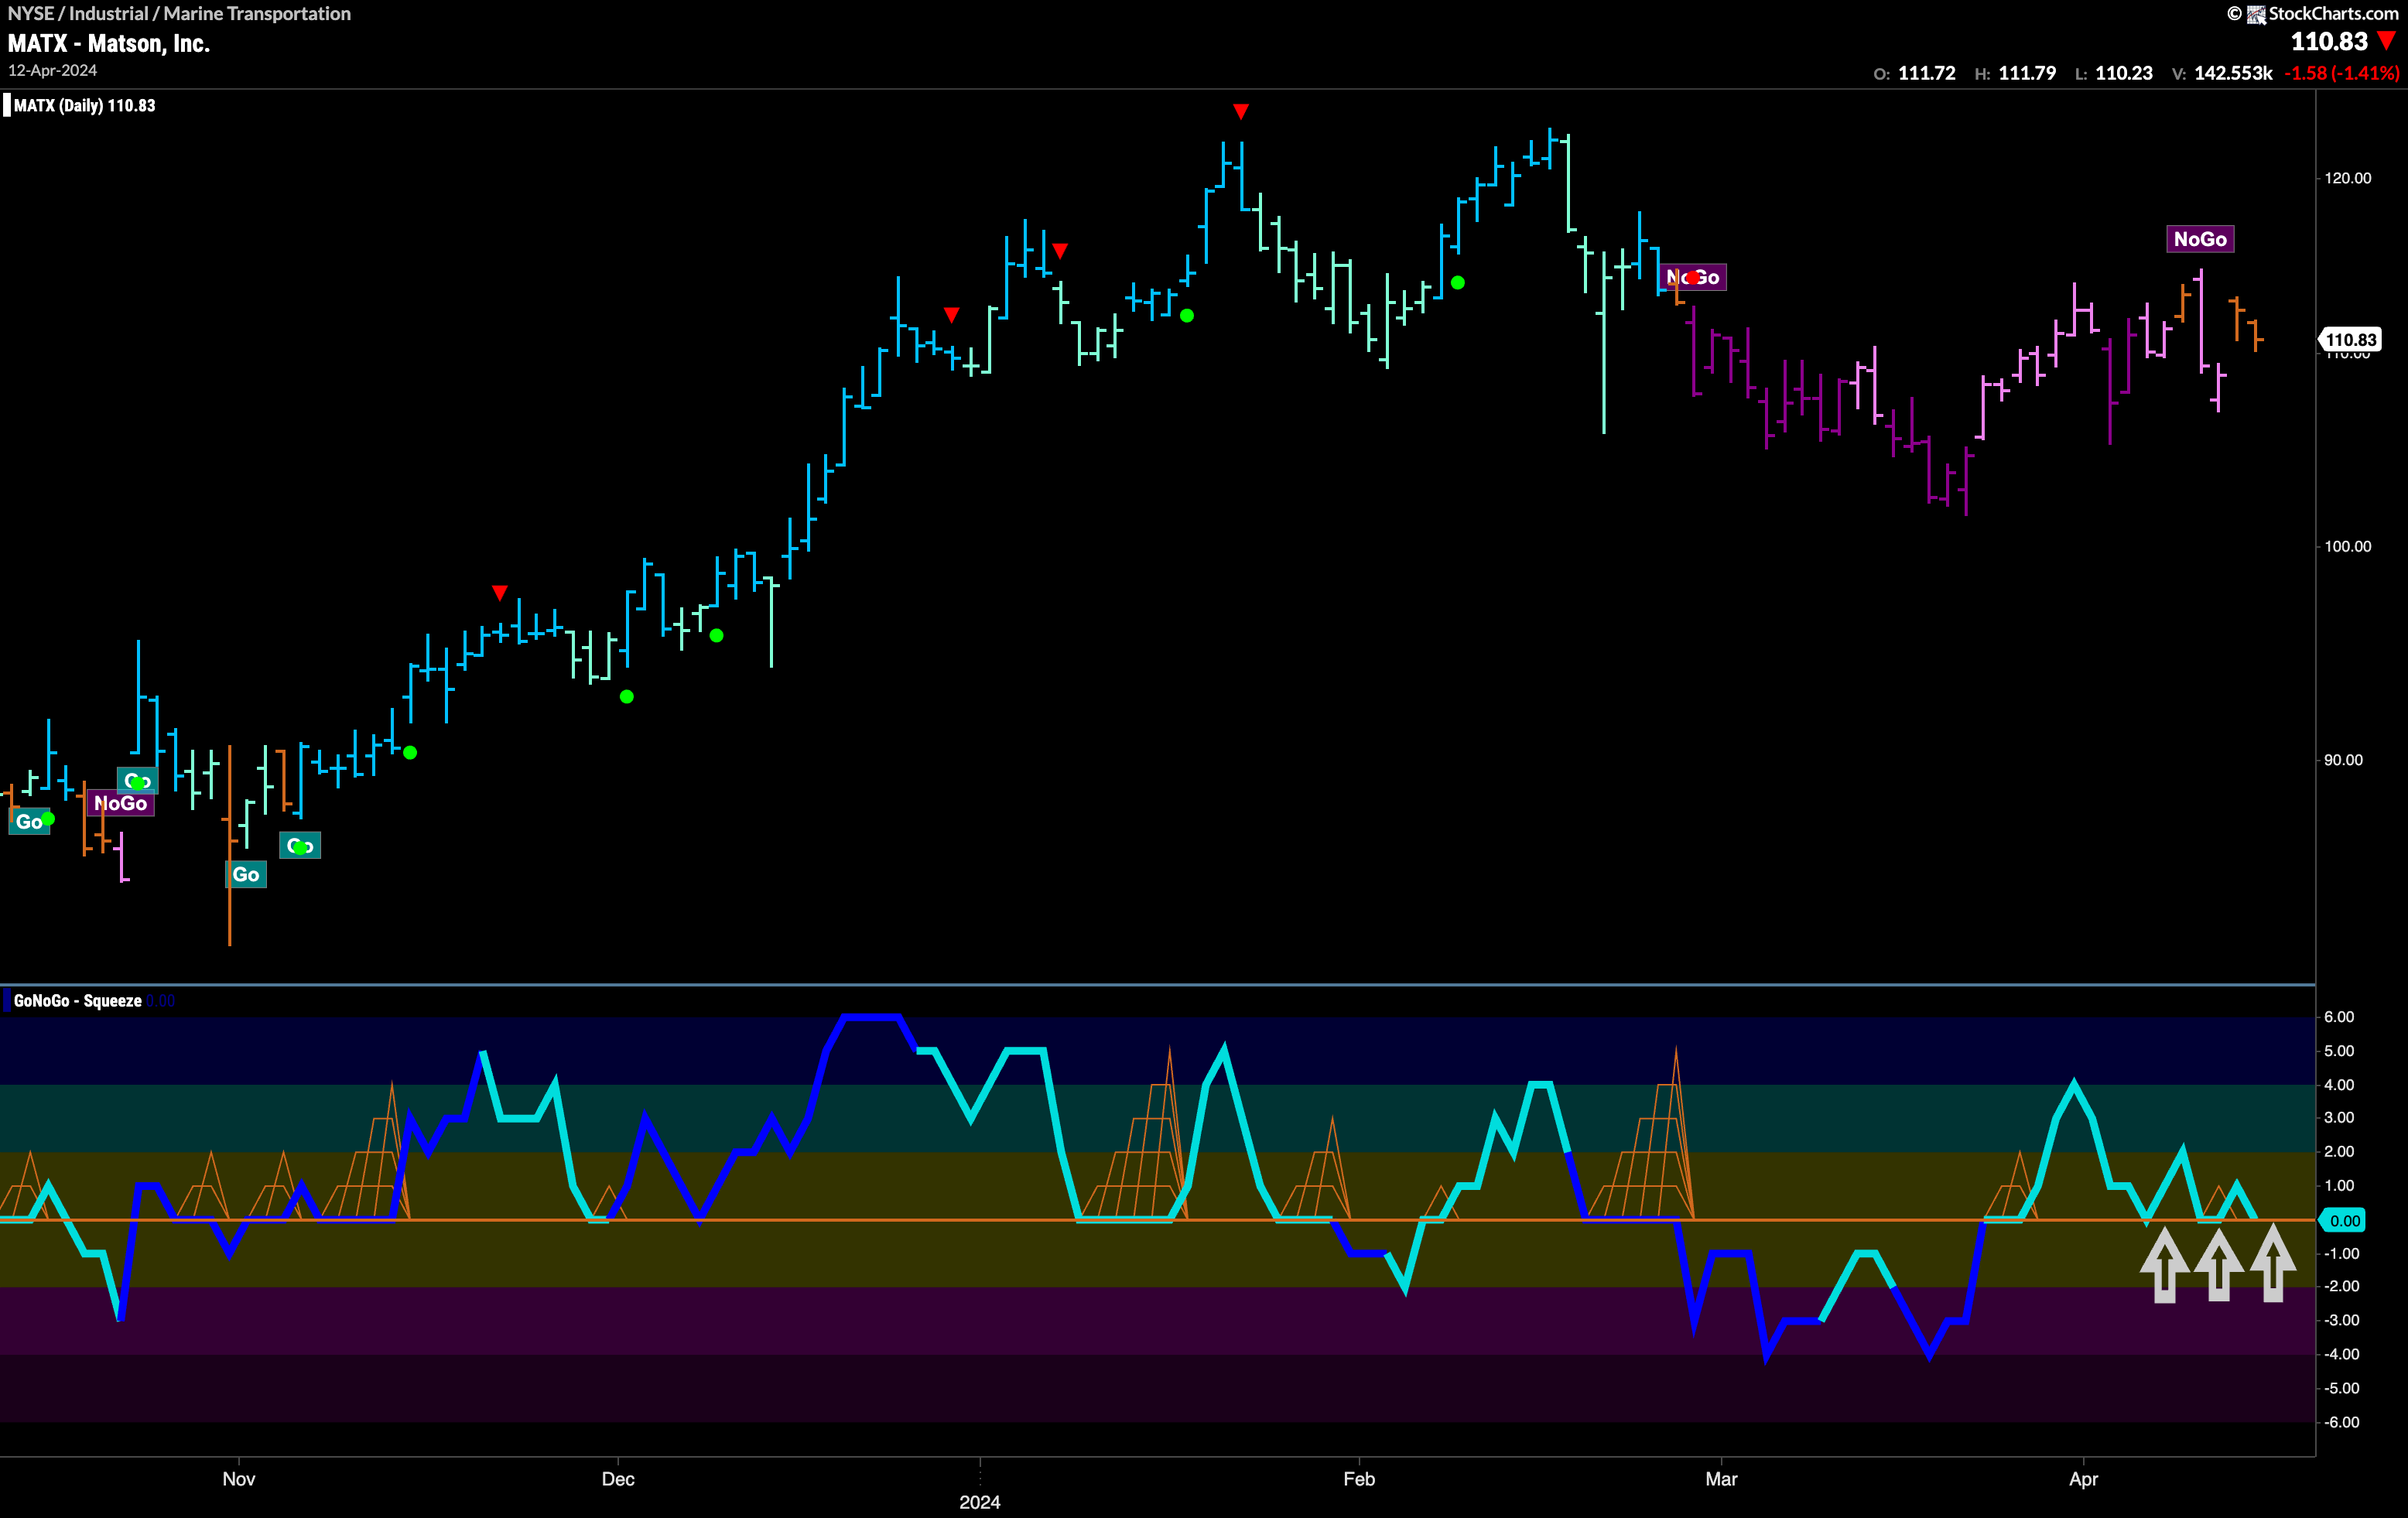
Matson, Inc, has suffered a “NoGo” correction but there are signs that the market is perhaps ready to turn back to the “Go” trend that has dominated much of the last few months. In late March, GoNoGo Oscillator broke back into positive territory which was not to be expected if the “NoGo” trend was healthy. We have since seen GoNoGo Trend struggle to maintain “NoGo” colors as it paints a few amber “Go Fish” bars that reflect uncertainty. During this time GoNoGo Oscillator has repeatedly found support at the zero line and we are testing that level again. If the oscillator is able to bounce back into positive territory again, we will likely see GoNoGo Trend return to paint “Go” bars and we will look for price to go higher.
