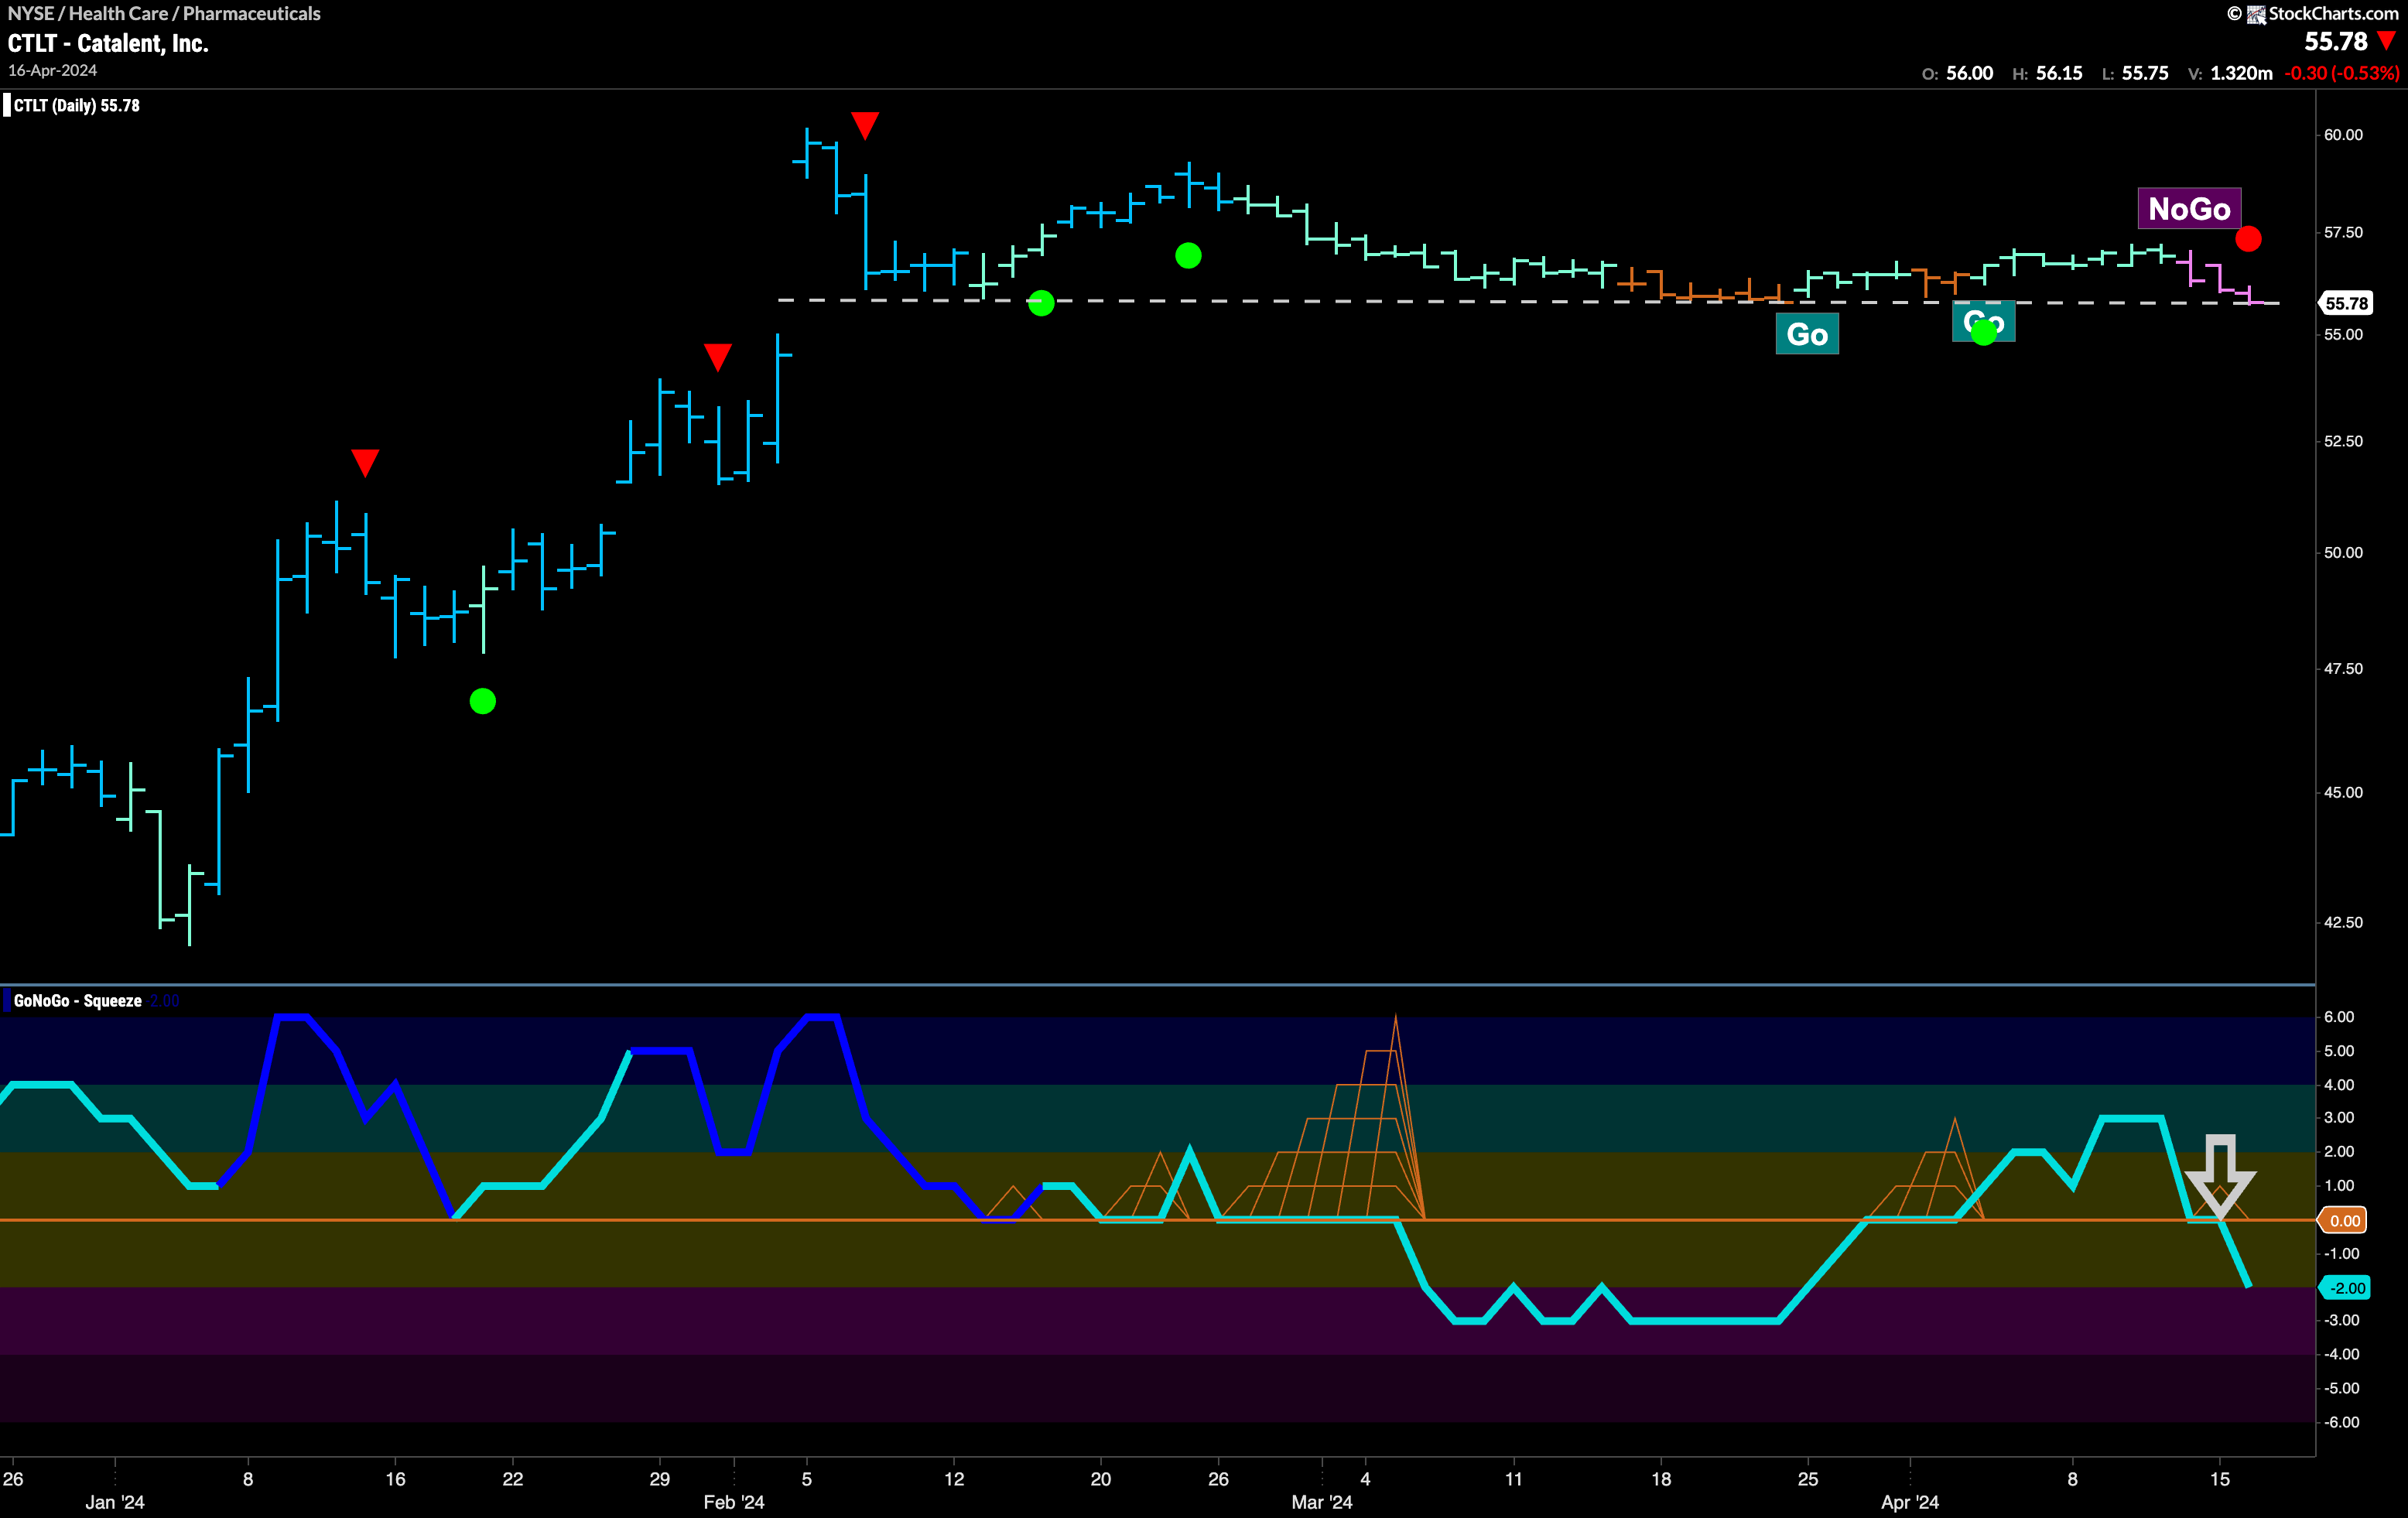

$CTLT was in a “Go” trend that peaked in early February of this year.
After a series of higher highs and higher lows we saw a Go Countertrend Correction icon at the last high. This warned us that price may struggle to go higher in the short term as momentum had waned. We then saw signs of weakness in the “Go” trend as the indicator painted a string of weaker aqua bars. During this time, GoNoGo Oscillator fell to test the zero line from above. After a Max GoNoGo Squeeze, GoNoGo Oscillator broke into negative territory and GoNoGo Trend showed uncertainty in the health of the “Go” trend by painting amber “Go Fish” bars as price continued to try to find support at the horizontal level we see on the chart. Although GoNoGo Oscillator was able to regain positive territory, the damage was done, and a new “NoGo” trend has been identified as price once again tests support. With GoNoGo Oscillator breaking back below zero, we can say that momentum is surging in the direction of the new “NoGo” trend and we therefore see signs of “NoGo” trend continuation. We will watch for price to break below support and new lows to follow.


