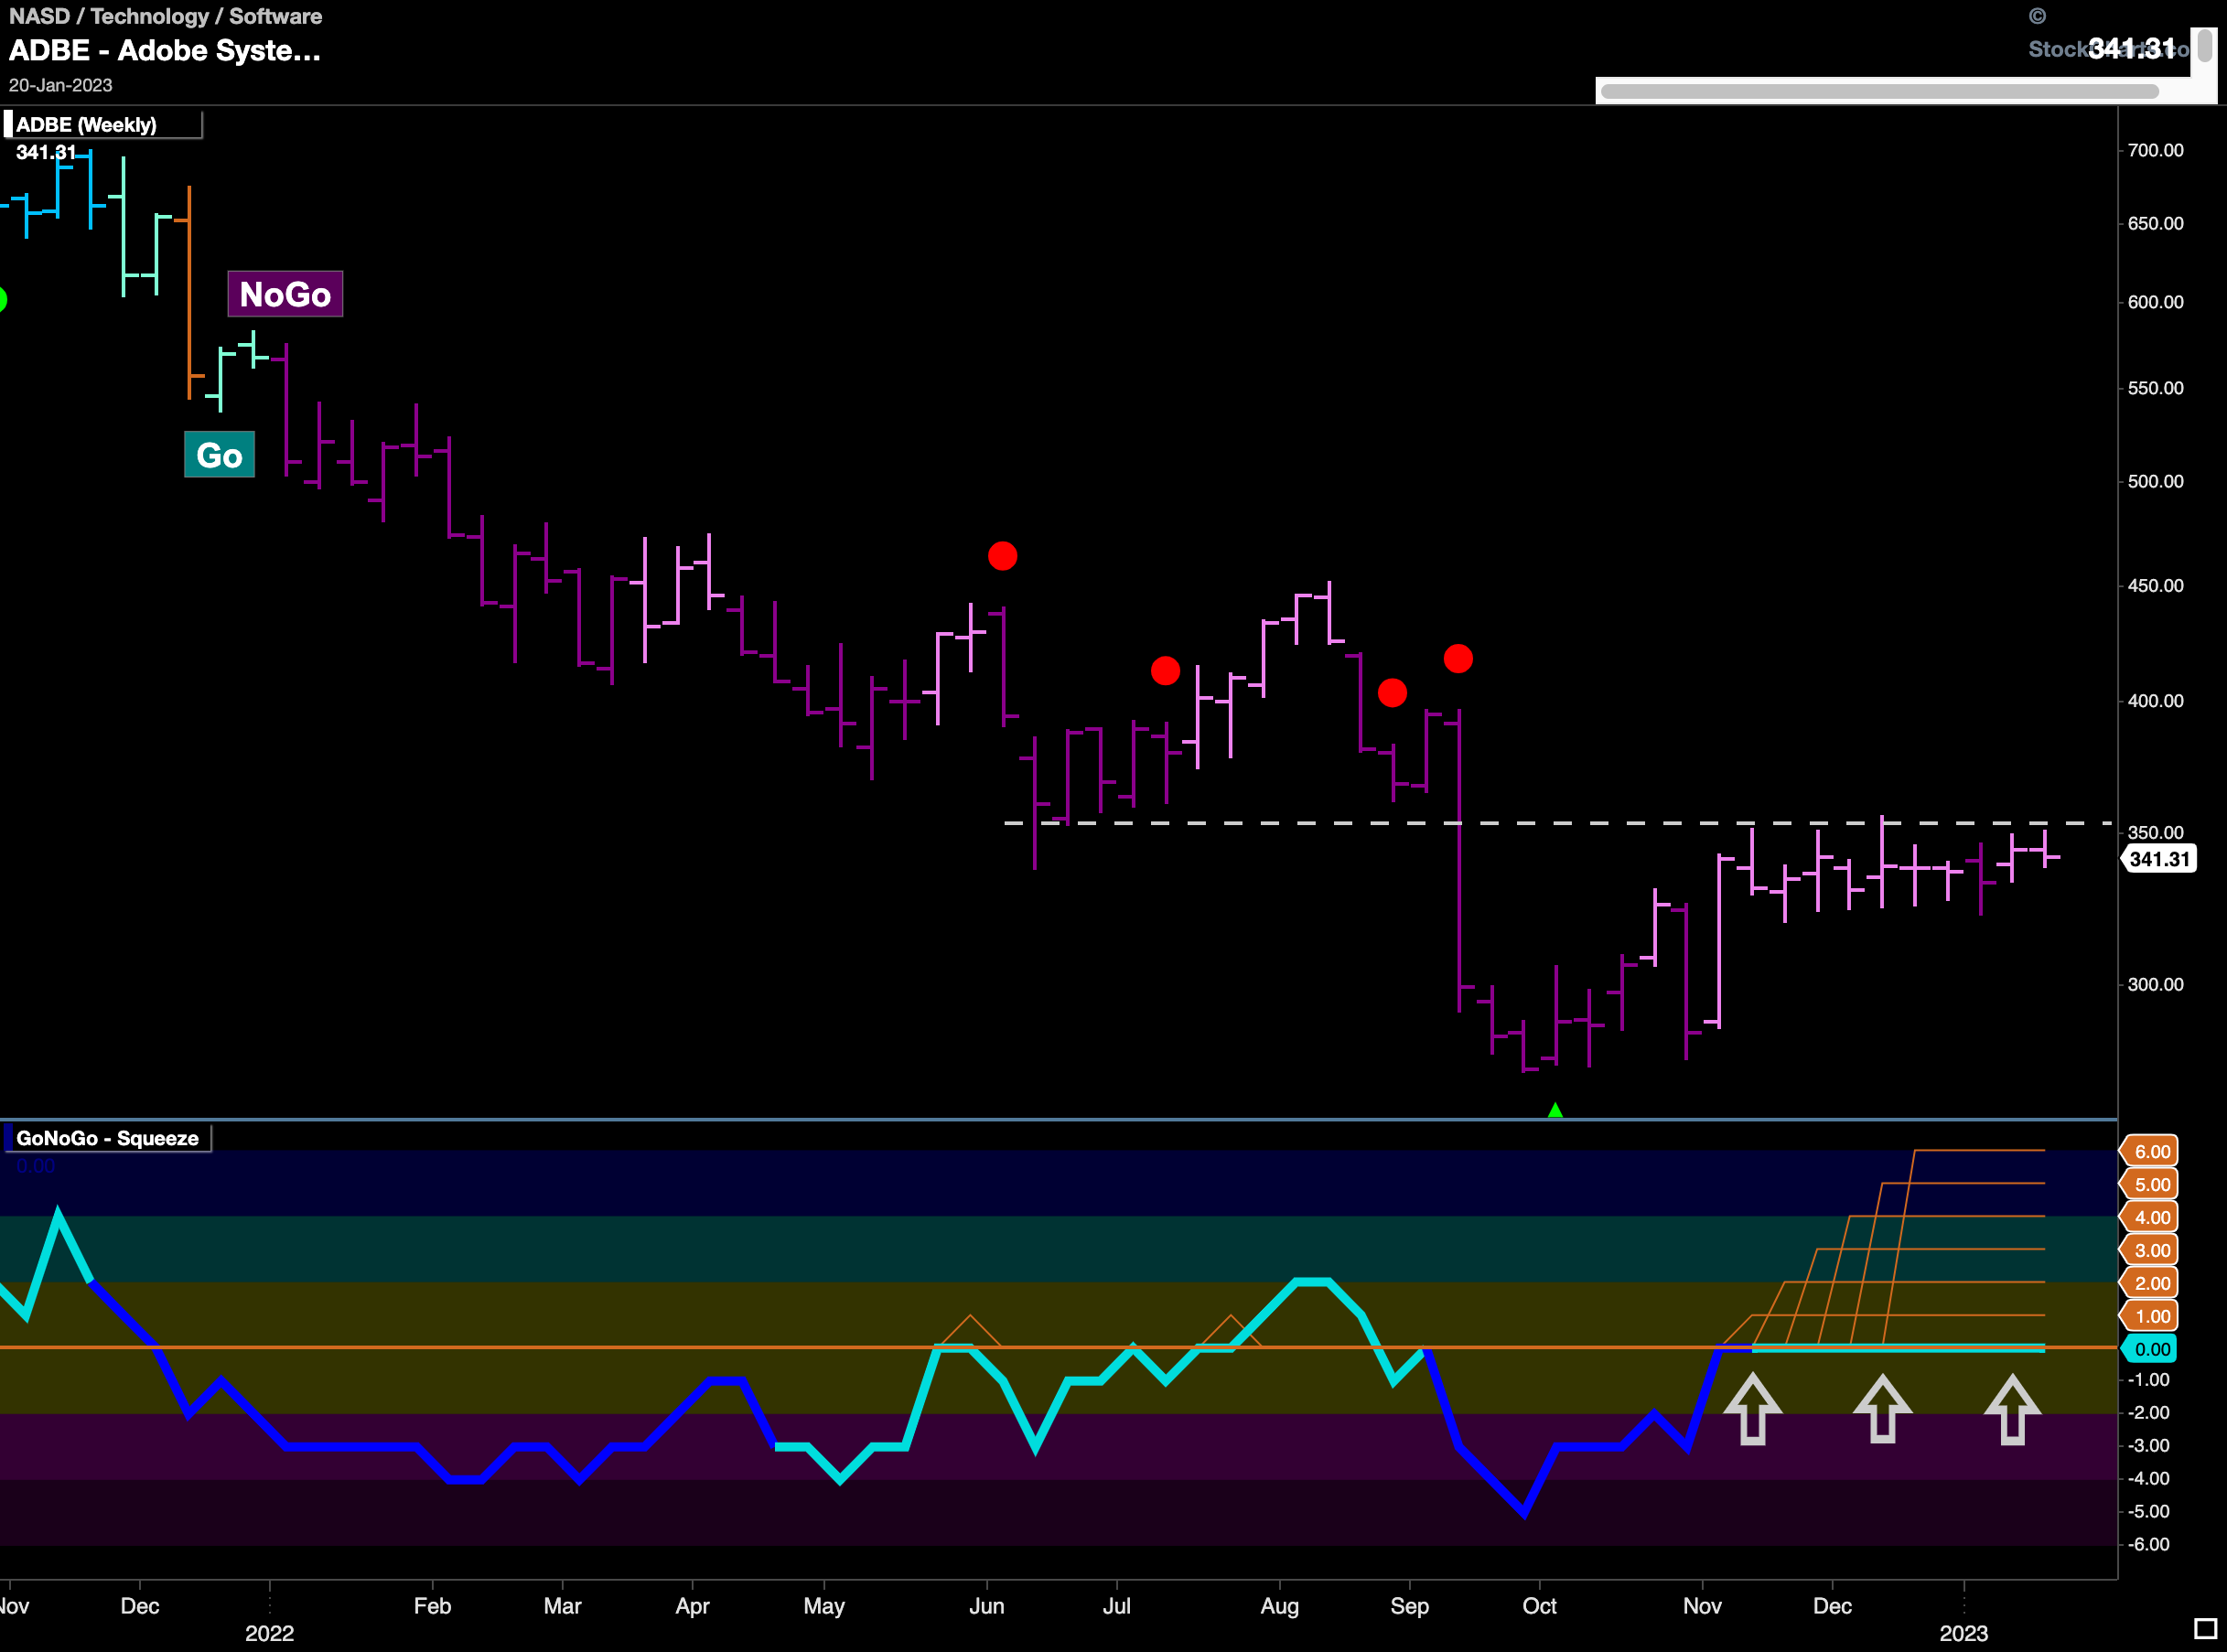

$ADBE has been in a “NoGo” trend on a weekly basis since the beginning of last year.
The daily chart (not pictured) shows that the trend is a “Go” and the oscillator is finding support at the zero line. Looking at this longer time frame chart we can see that we are at an important inflection point. The “NoGo” trend is still in place however price is painting weaker pink bars as it rallies off the lows from late last year. GoNoGo Oscillator is riding the zero line, telling us that there is a tug of war between buyers and sellers resulting in little directional momentum. As price tries to climb above resistance, we will watch to see if the oscillator can break out of the GoNoGo Squeeze into positive territory which might give price the push it needs.


