
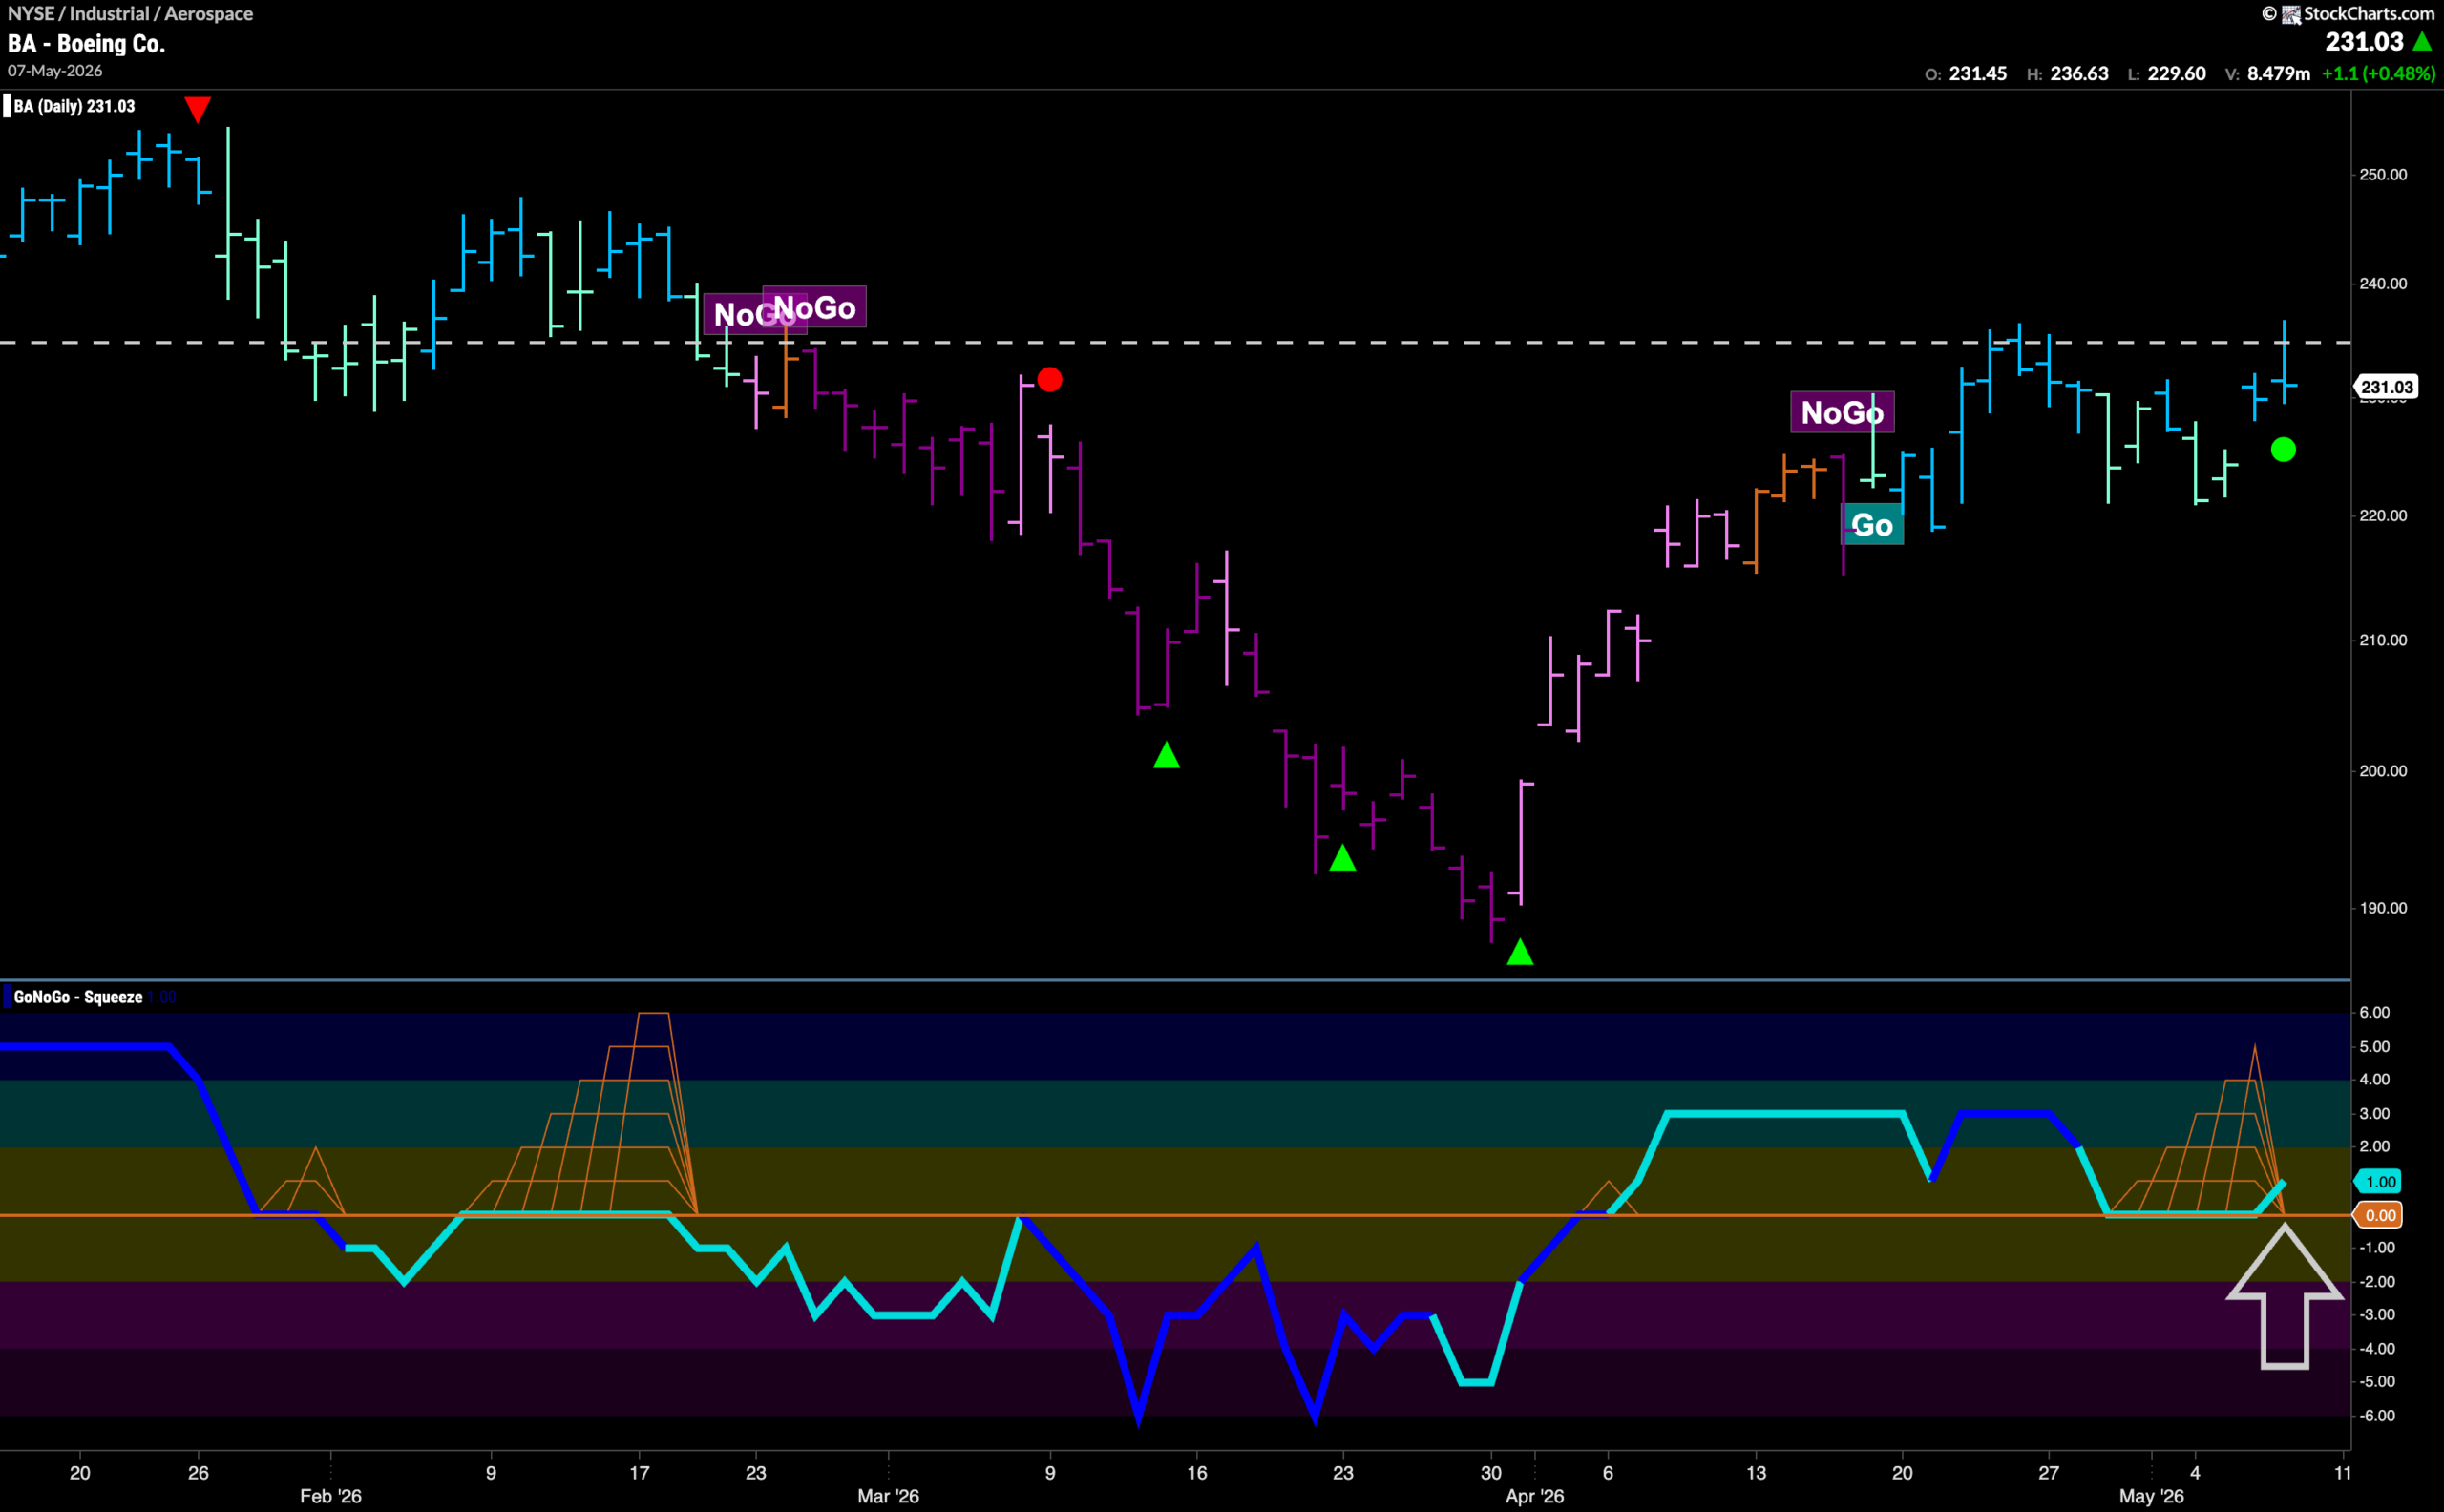

$BA has been in a “Go” trend since the middle of April.
Since then, it has made a higher high on bright blue “Go” bars but ran into resistance from earlier this year. We then saw GoNoGo Oscillator fall to test the zero line from above. The oscillator got stuck at the zero line, embroiled in a virtual tug of war between buyers and sellers at this level. We see that it has broken out of a Max GoNoGo Squeeze back into positive territory. This tells us that momentum is resurgent in the direction of the “Go” trend and we see a Go Trend Continuation Icon (green circle) under the price bar. We will watch to see if this boost in momentum is enough for price to climb above the horizontal resistance we see on the chart and set a new higher high in the coming days.





