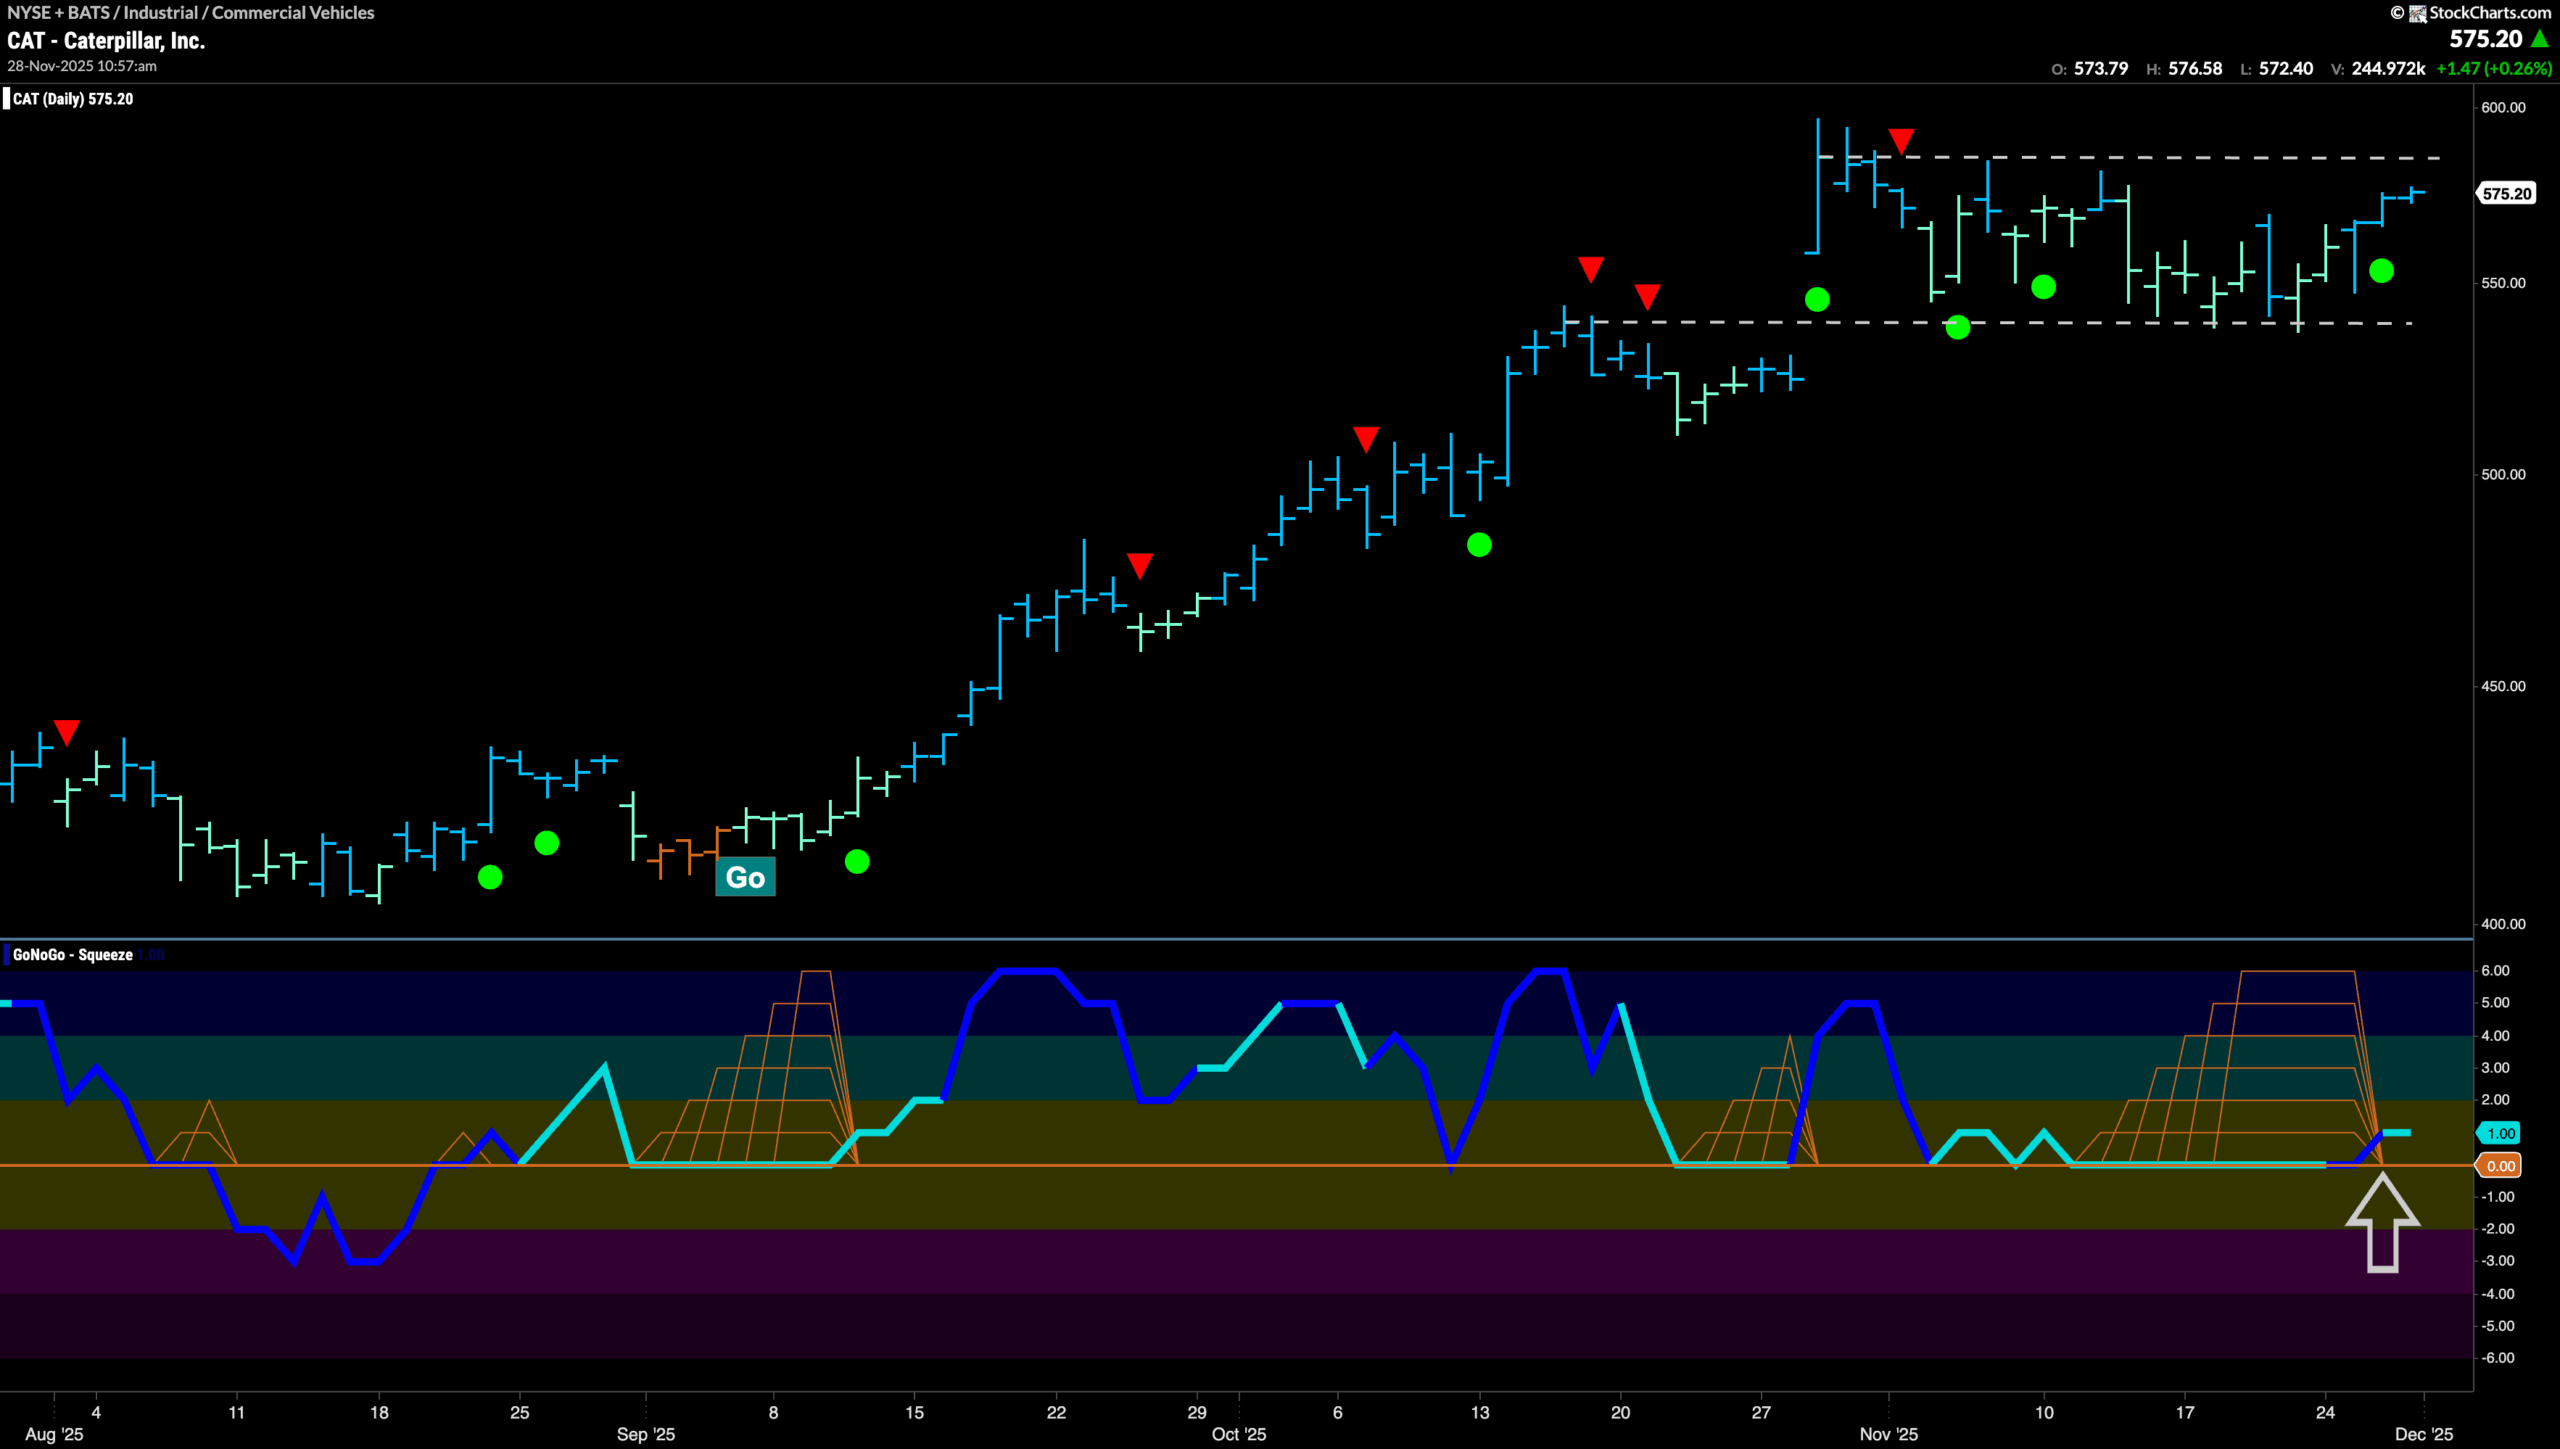

$CAT has been in a lengthy “Go” trend.
We have seen a series of higher highs and higher lows as price has climbed to almost $600. After that most recent high, we saw a Go Countertrend Correction Icon (red arrow) indicating that price may struggle to move higher due to waning momentum. Indeed, price moved mostly sideways since and GoNoGo Trend has painted a majority of weaker aqua bars. A positive sign is that price has found support at the prior high within the gap, and as it tested this level, GoNoGo Oscillator fell to test the zero line from above. It has found support, causing an extended Max GoNoGo Squeeze to build as investors grapple over direction. Now, with GoNoGo Oscillator breaking out of the Max GoNoGo Squeeze into positive territory, we see a Go Trend Continuation Icon (green circle) and price once again painting strong blue “Go” bars as it nears overhead resistance. With momentum resurgent in the direction of the “Go” trend, we will watch to see if this gives price the push it needs to break to new higher highs.