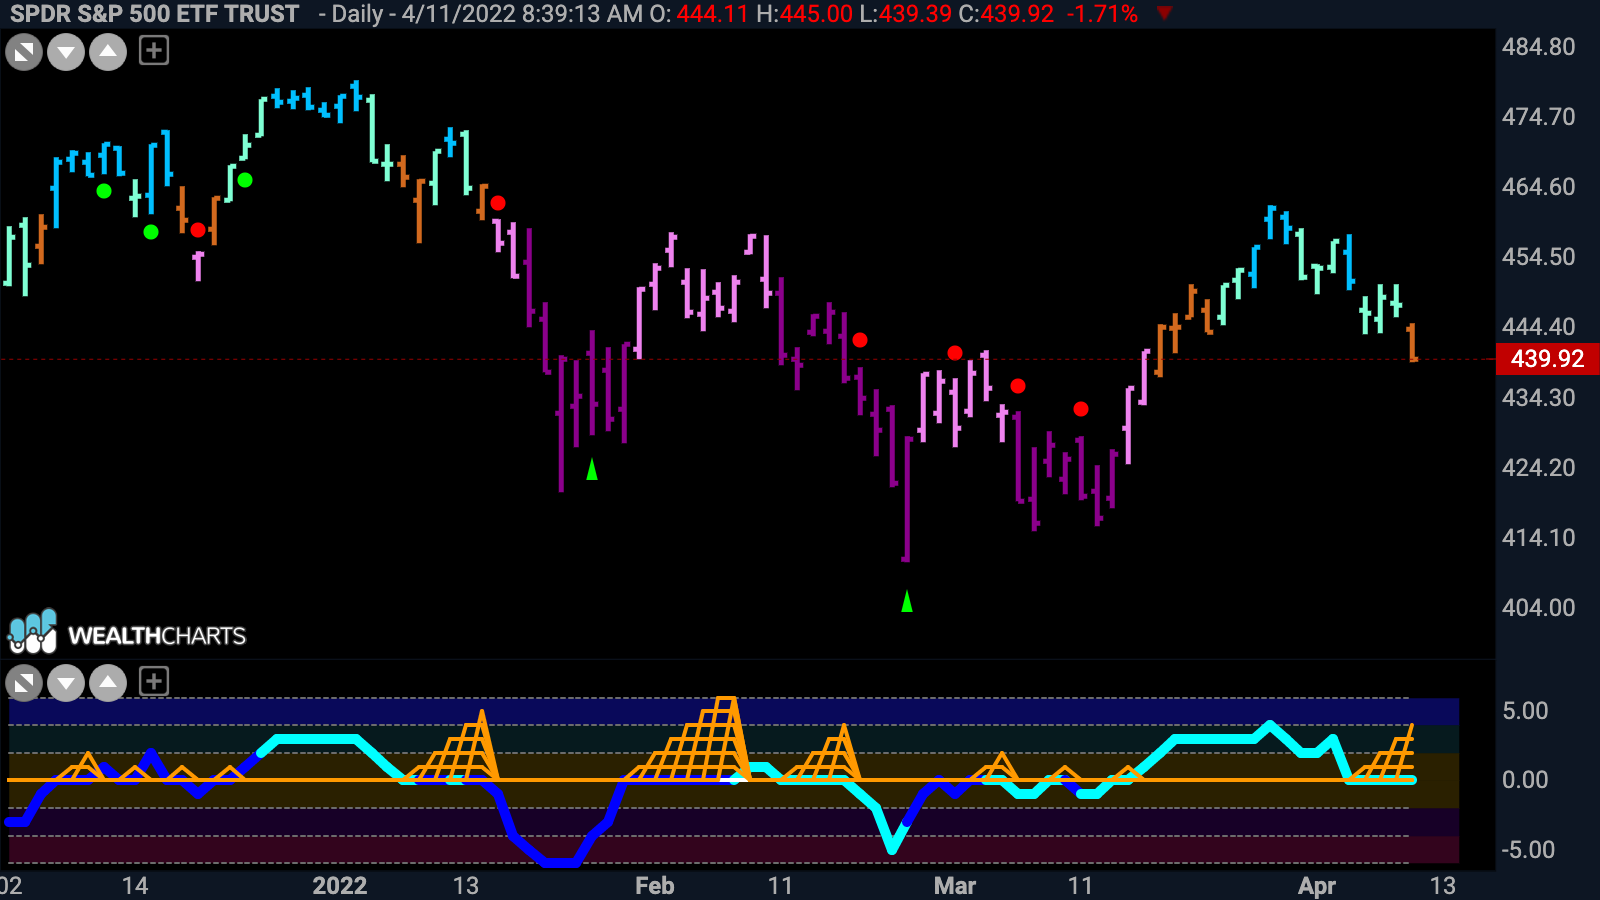

Here is the GoNoGo Chart of the S&P 500 with GoNoGo Trend, Oscillator and Squeeze applied.
Having freed itself from the “NoGo” trend that had been in place since the start of the year, price moved into a “Go” toward the end of March. The very end of March saw prices struggle to go higher and GoNoGo Trend weakened painting mostly paler aqua bars since. Yesterday, for the first time since the new “Go” was identified, we see an amber “Go Fish” bar, signaling uncertainty in the current trend. Concurrently, GoNoGo Oscillator has fallen back to the zero line. As the oscillator remains at zero looking for support, a GoNoGo Squeeze has started to build. We will watch to see if GoNoGo Oscillator can break out of the squeeze into positive territory, telling us that momentum has returned to the upside, or if it breaks out to the downside. This would tell us that momentum has turned bearish and the “Go” trend may be gone for a while.


