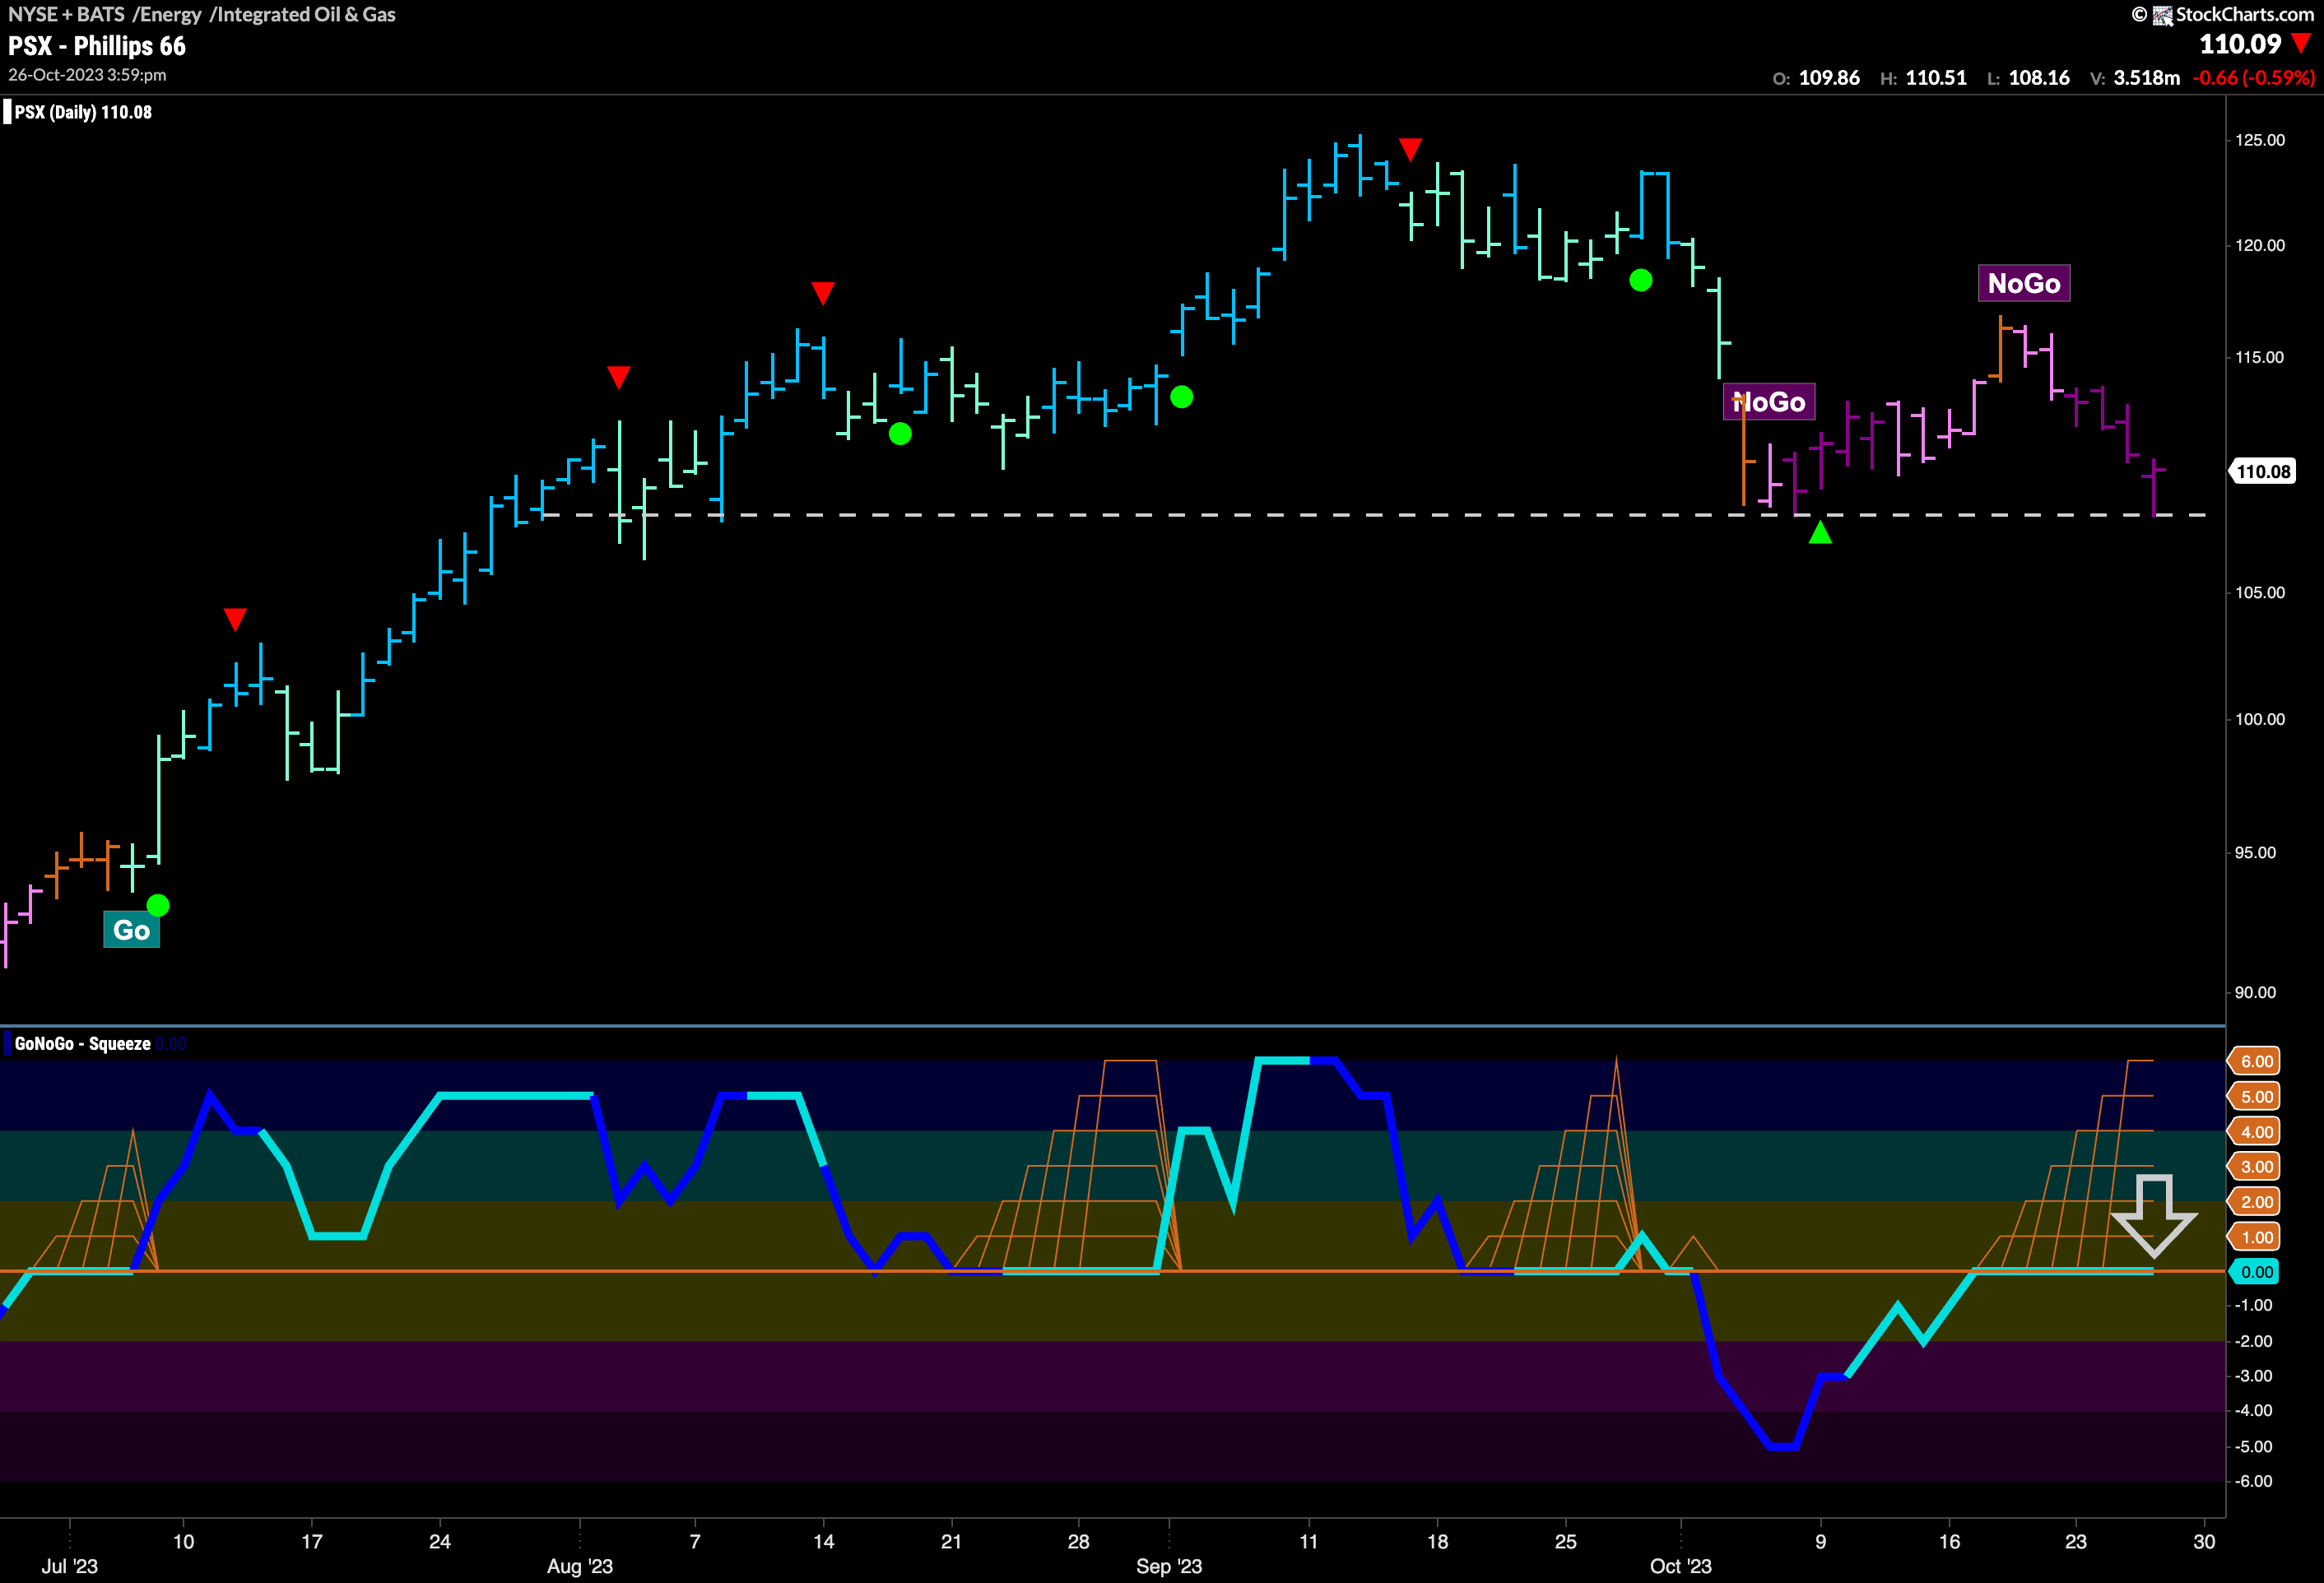

$PSX has been in a “NoGo” trend since the beginning of this month.
Having hit highs in September, the GoNoGo Chart displayed a Go Countertrend Correction Icon (red arrow) that told us price may struggle to go higher in the short term. Indeed, after that we saw the “Go” trend weaken to paint mostly aqua bars before an amber “Go Fish” bar gave way to “NoGo” colors. As that happened, GoNoGo Oscillator fell below the zero line and so momentum was on the side of the new “NoGo”. Now, with price having moved mostly sideways and trying to find support, we see GoNoGo Oscillator has risen to test the zero line from below. As it rides the zero line, we see the climbing grid of a Max GoNoGo Squeeze. It will be important to see in which direction the GoNoGo Squeeze is broken. If the Squeeze is broken back into negative territory then we will look for further downside price action and for new lower lows.


