
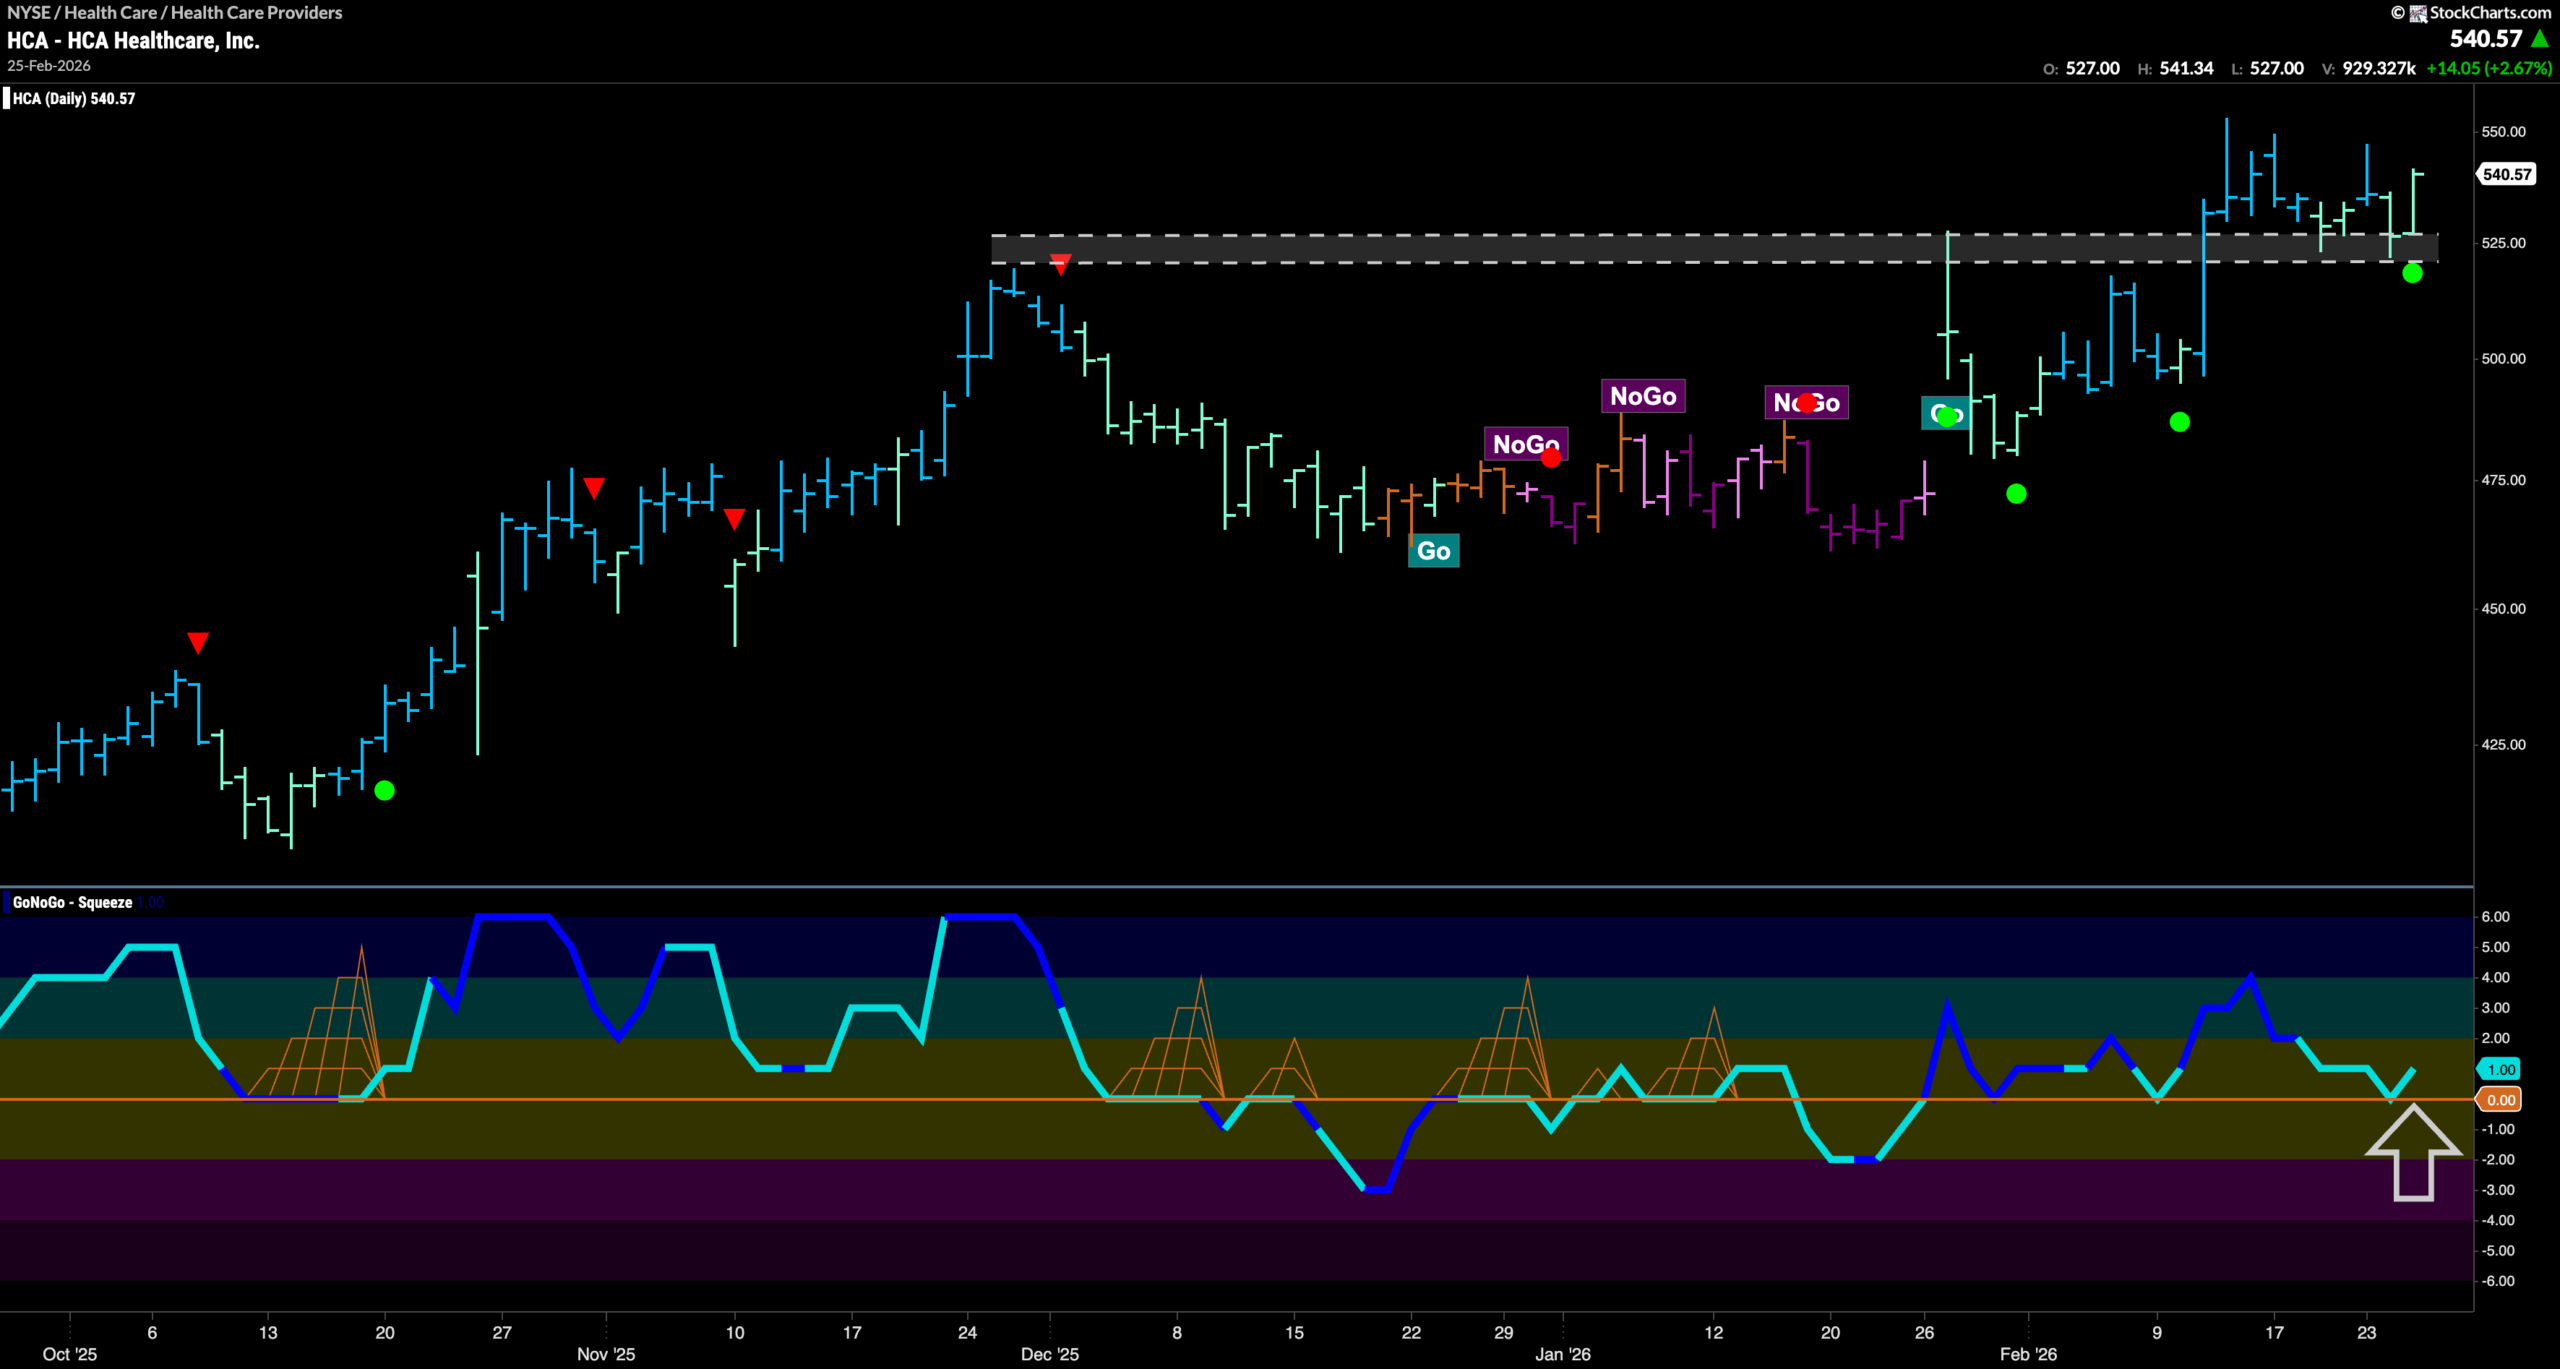

$HCA has been in a “Go” trend since the end of January.
This new trend started after price was able to rally out of the “NoGo” correction it was in. We saw price quickly climb to set a new higher high above the prior high resistance that we see on the chart. At the same time, GoNoGo Oscillator was able to rally back into positive territory and has since been finding support at that level. Having broken above horizontal resistance, we have seen price re-test that level and find it to be support. GoNoGo Oscillator has also fallen once again to test the zero line from above and has rallied back into positive territory. This tells us that momentum is resurgent in the direction of the “Go” trend and we see a Go Trend Continuation Icon (green circle). With GoNoGo Trend again painting a strong blue “Go” bar, we will watch to see if this boost in momentum will help price climb to another higher high in the coming days.





