
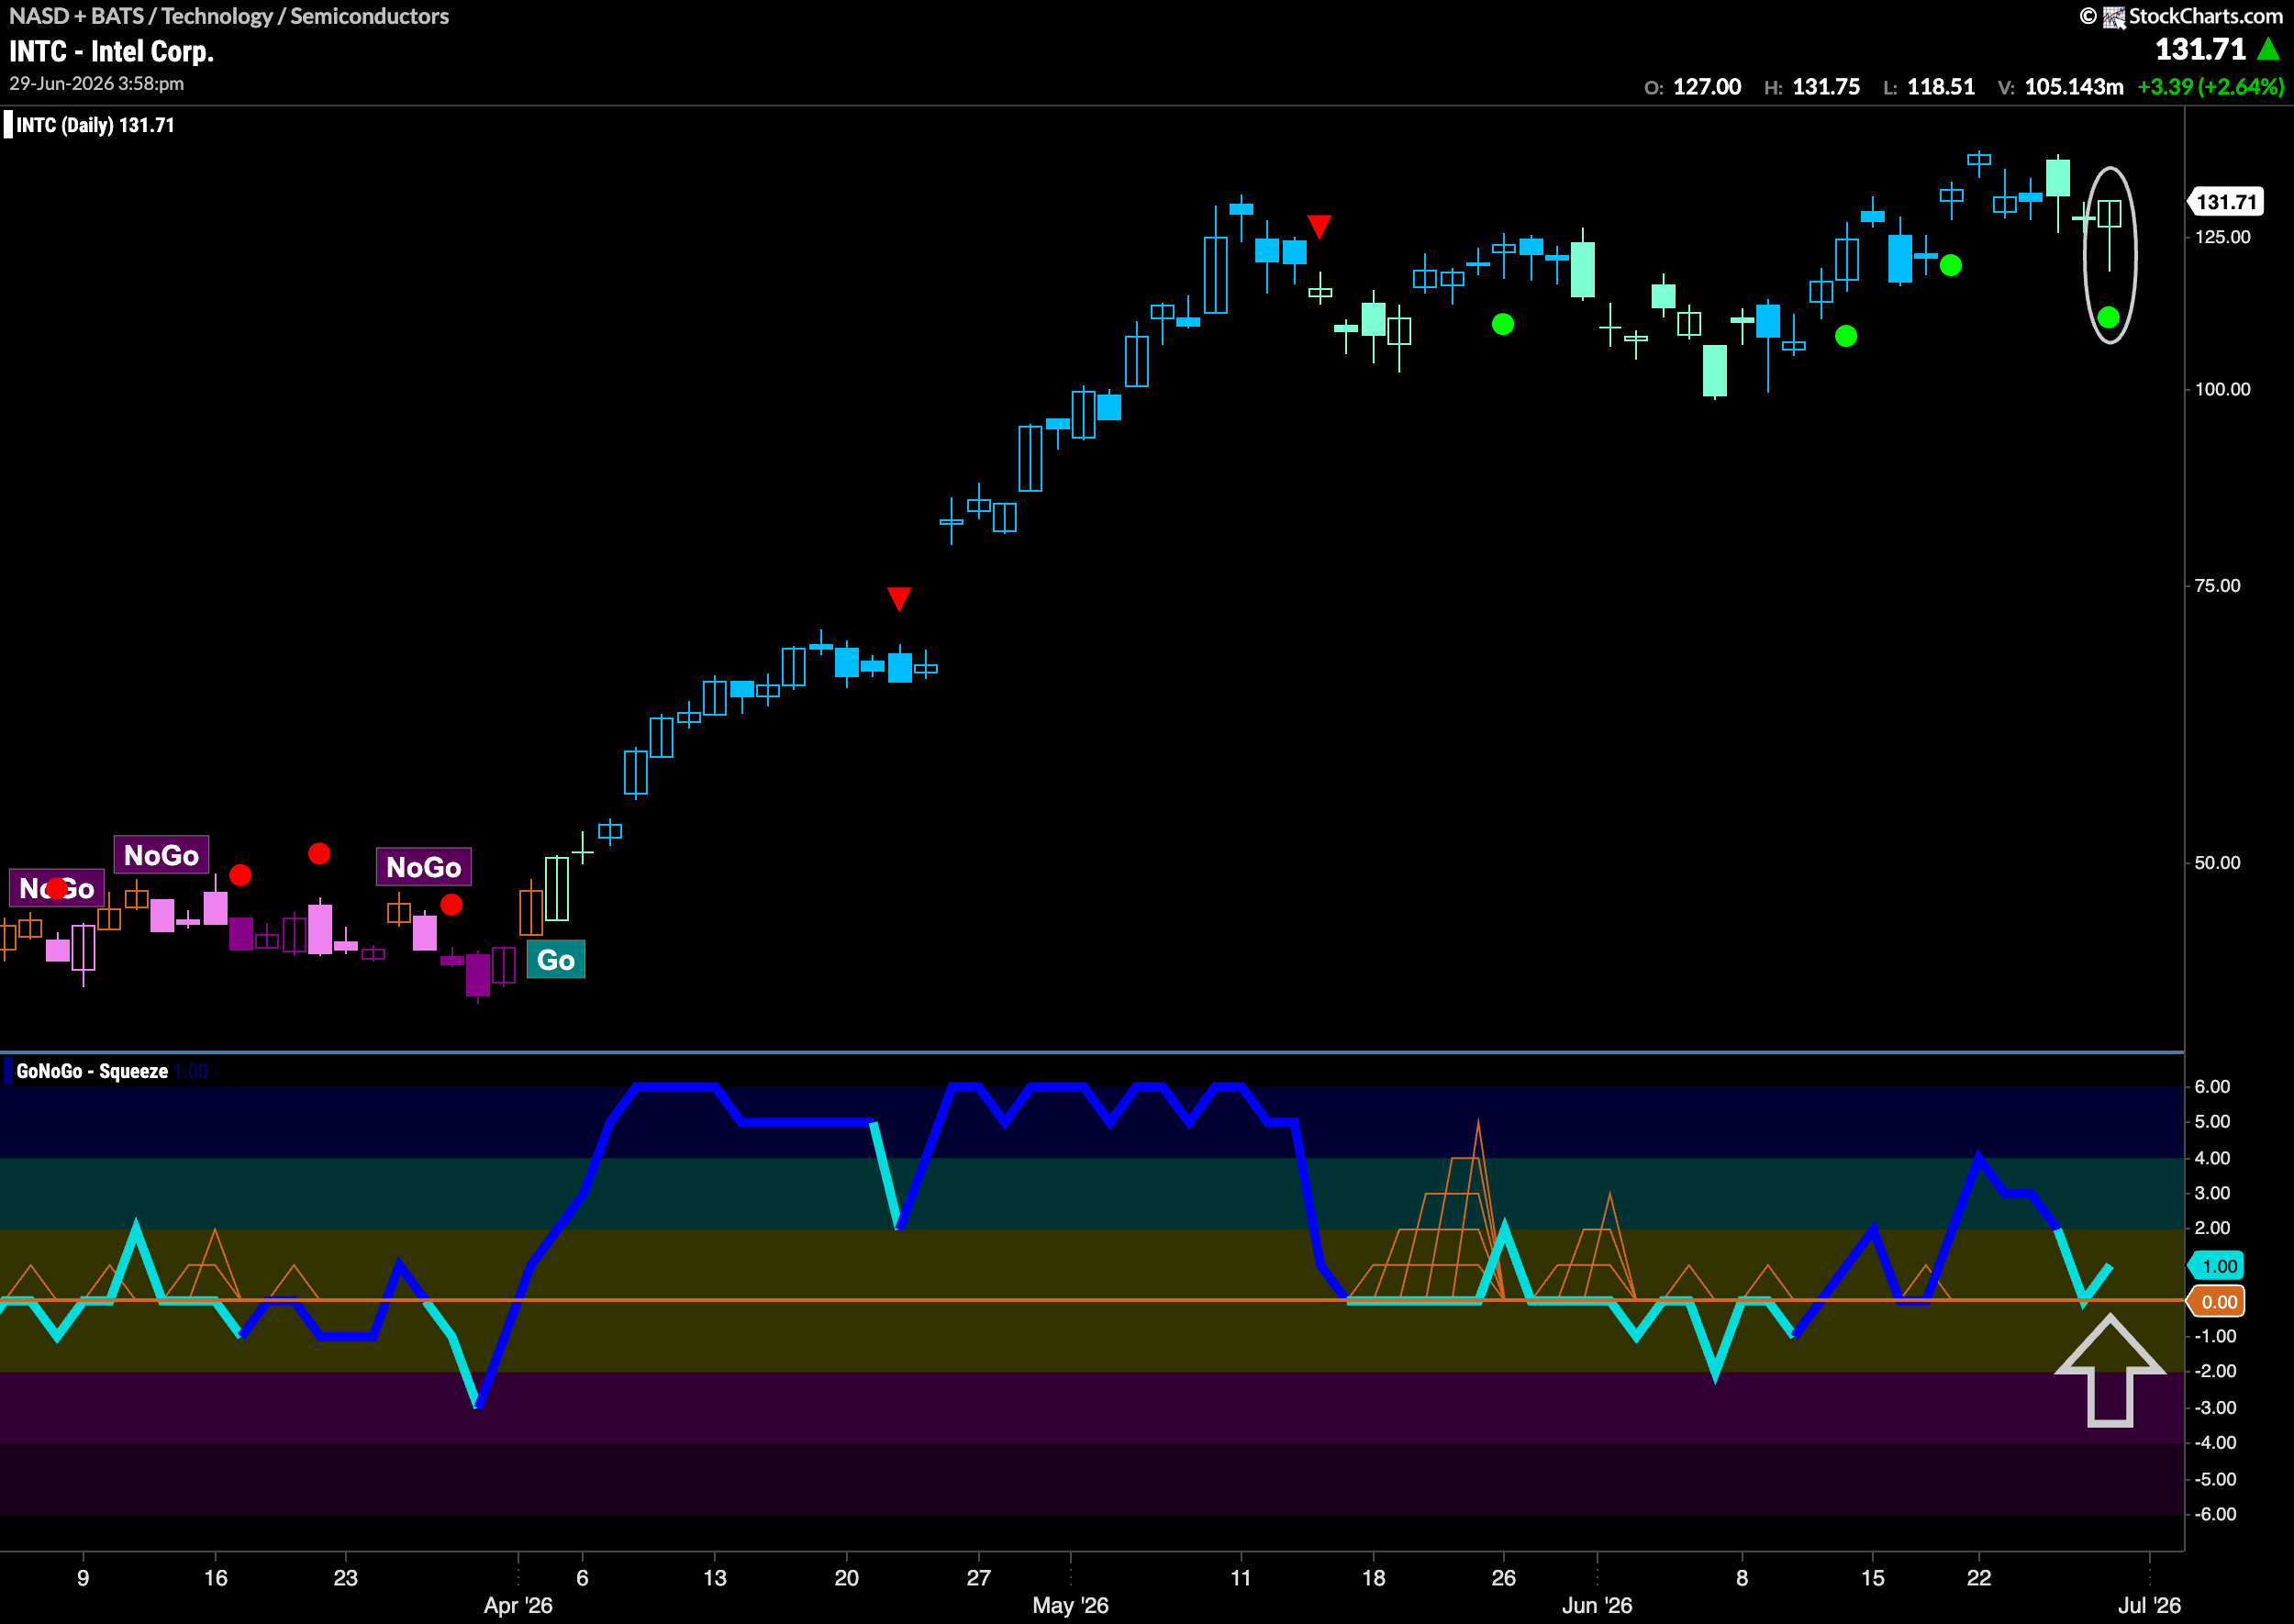

$INTC has been in a “Go” trend since early April.
Since then, we have seen price move higher after a runaway gap before stalling and moving mostly sideways. This was after a Go Countertrend Correction Icon (red arrow) indicated that price may struggle to go higher in the short term. As price moved sideways and slightly lower on weaker aqua bars, GoNoGo Oscillator even dipped into negative territory, threatening the “Go” trend in price. Recently however, we see that the oscillator was able to regain positive territory and has been finding support at that level. After a slightly higher high, we see GoNoGo Trend painting weaker aqua bars again but the oscillator this time has bounced off zero, triggering a Go Trend Continuation Icon (green circle) telling us that momentum is resurgent in the direction of the trend. At the same time, using candlesticks we see a “hammer” pattern. This is short term bullish, coming after prices correction against the prior high. We will watch to see if this confluence of events gives price the push it needs to climb to a new higher high in the coming days.





