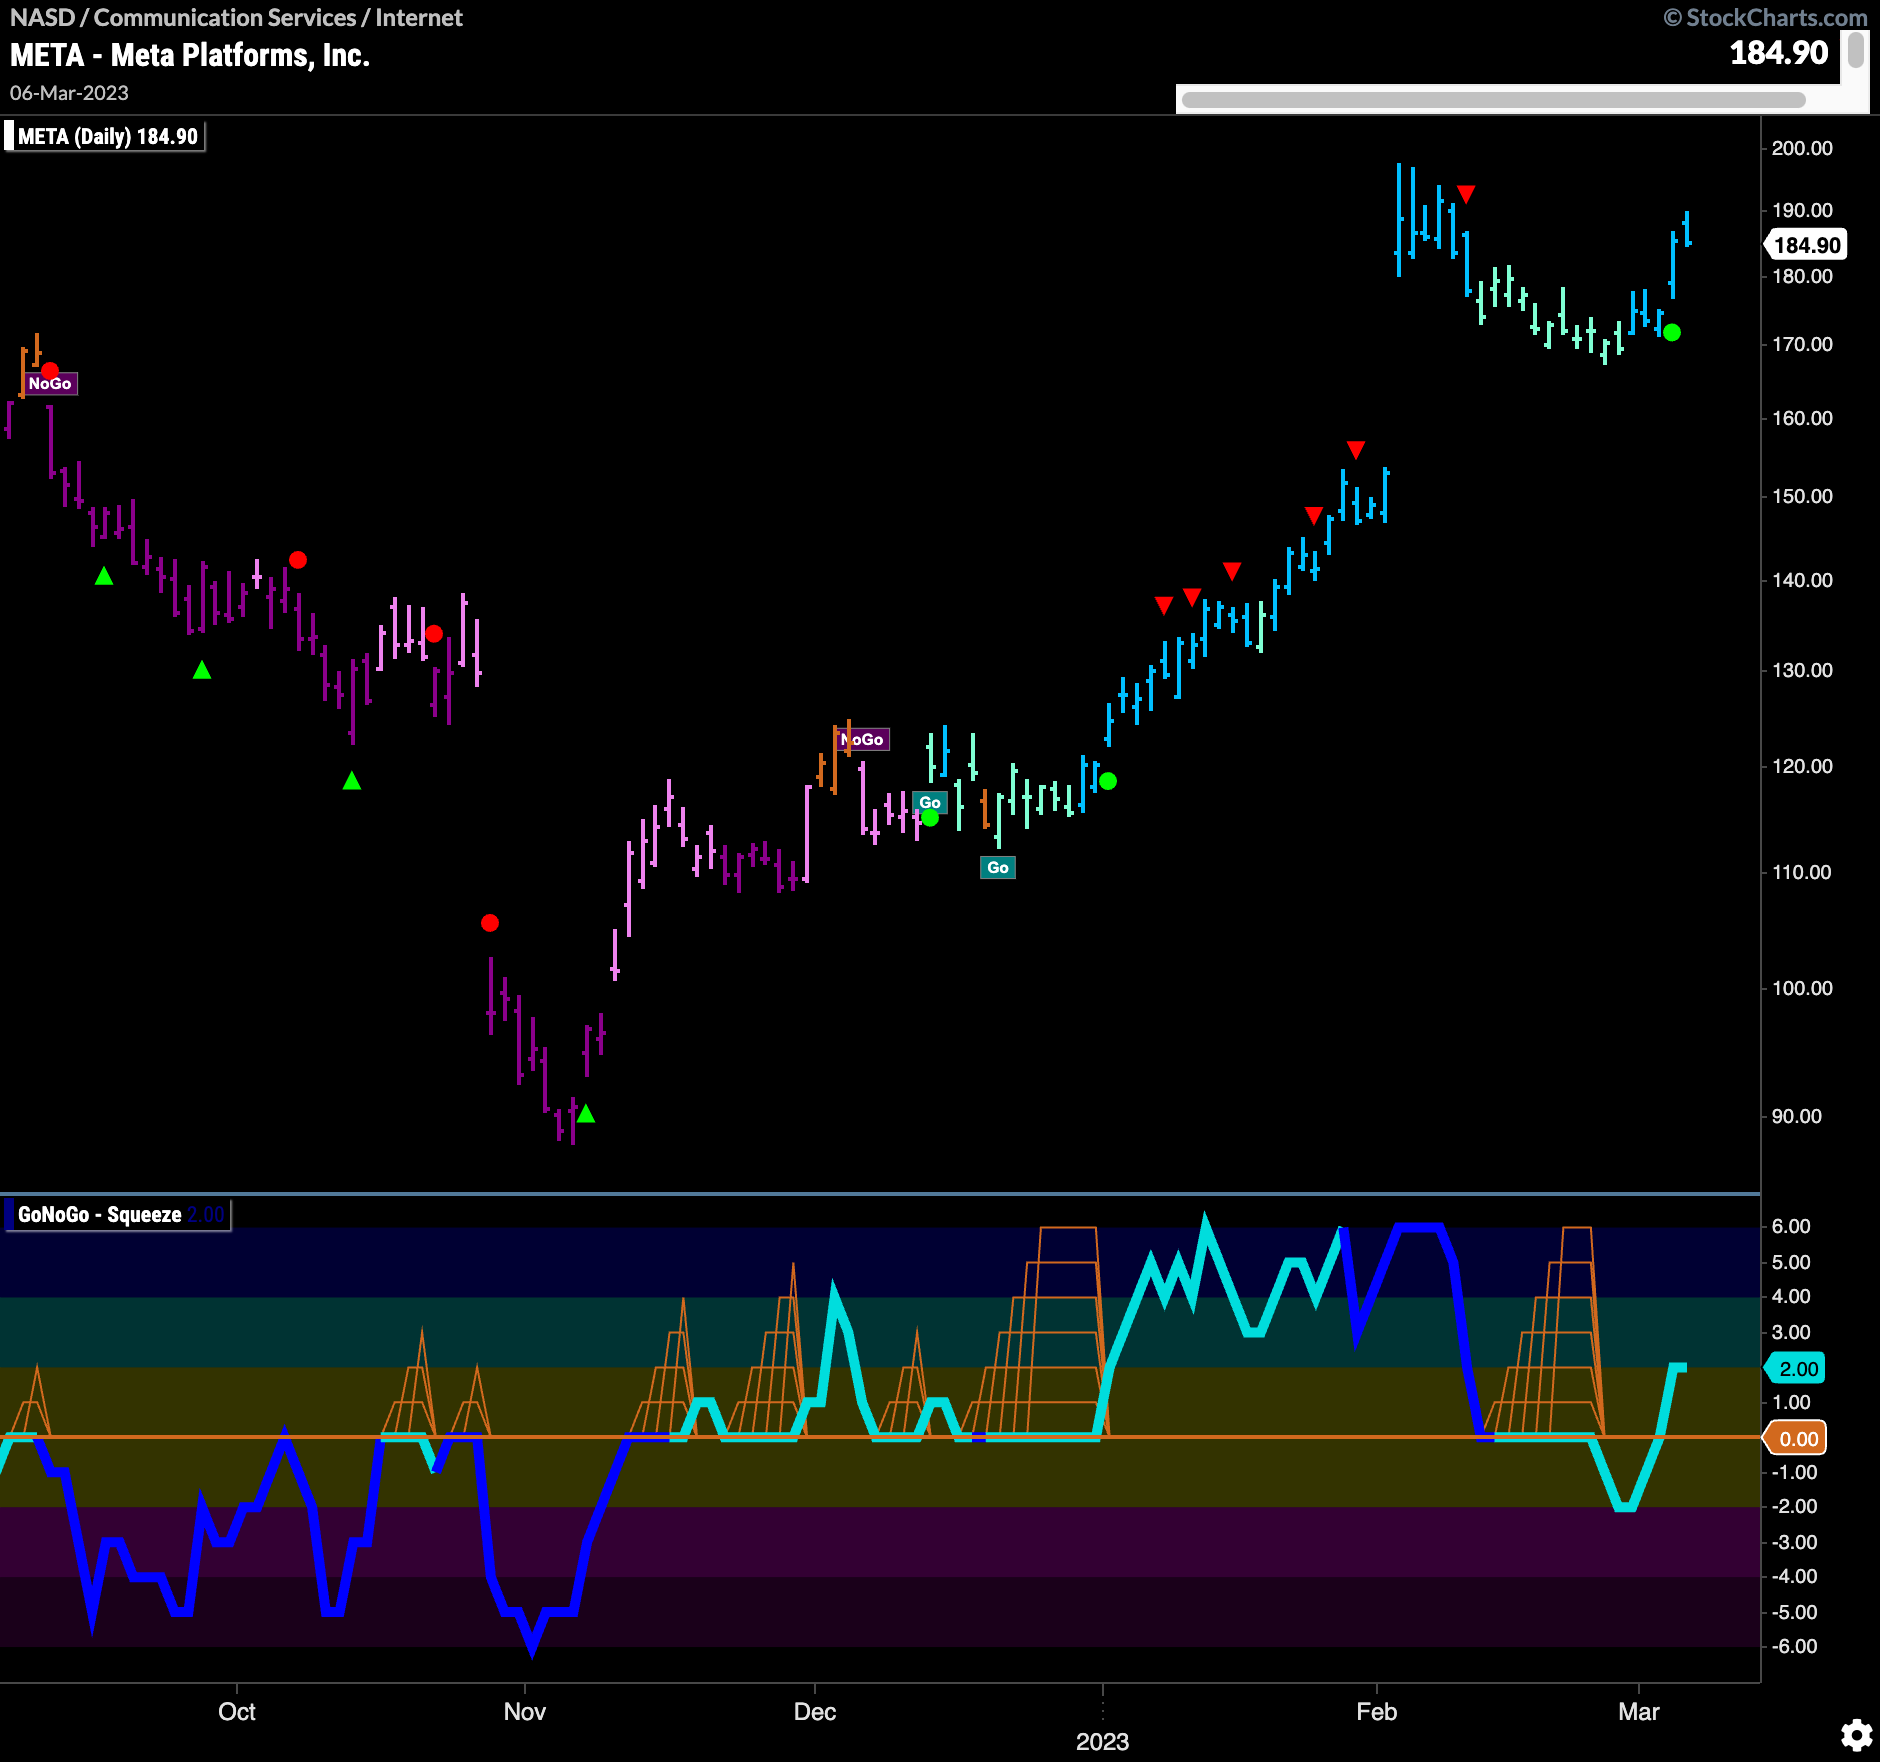
$META prices rise to test prior high.
After the large gap higher at the beginning of February, price corrected from the high and we saw a Go Countertrend Correction Icon (red arrow) signaling that price may struggle to go higher in the short term. GoNoGo Trend also started to paint weaker aqua “Go” bars as price fell into the territory of the gap. Price found support and GoNoGo Trend began painting stronger blue bars. After falling into negative territory, GoNoGo Oscillator broke back north of the zero line indicating that momentum was once again on the side of the “Go” trend. This triggered the Go Trend Continuation Icon (green circle) that suggests price will make an attack on the prior high.


