Not looking good for $NIO on weekly GoNoGo Chart

Not looking good for $NIO on weekly GoNoGo Chart

21

October 2022

By

Alex Cole

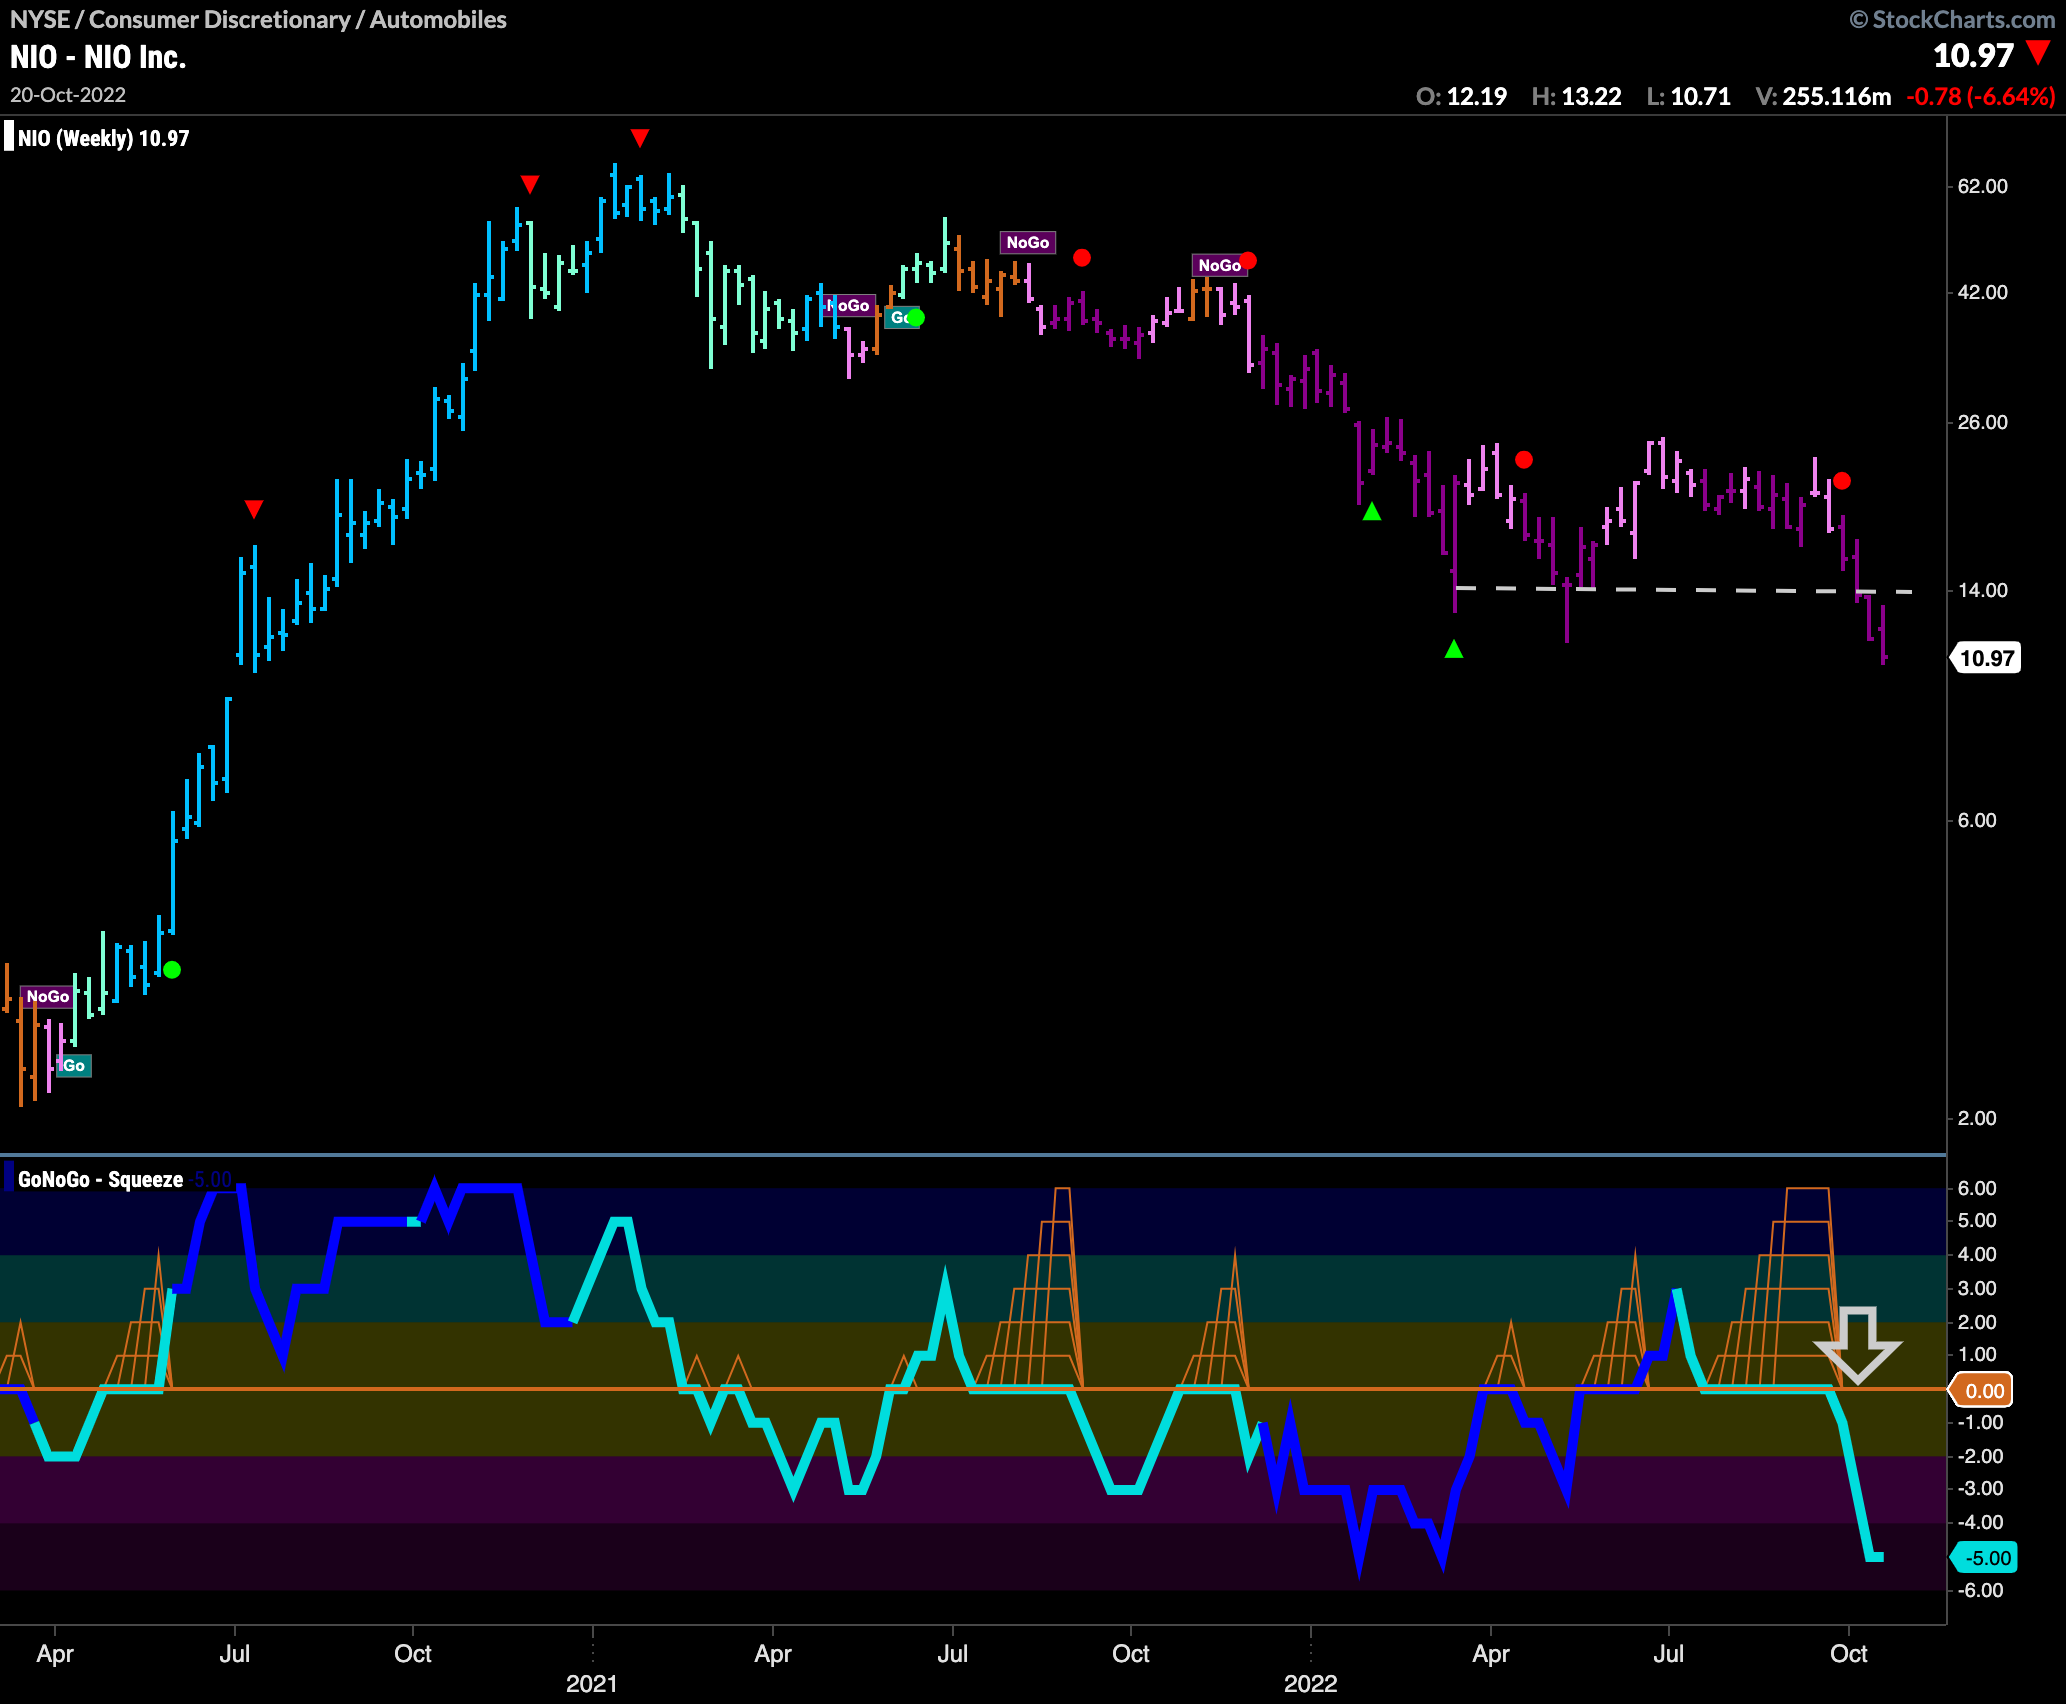
Price taking a turn for the worse for $NIO on the weekly chart.

GoNoGo Trend has been painting “NoGo” bars since July and the past month has seen strong purple bars.  This week we are seeing price fall further from a horizontal level that once was support.  Confirming the price move, GoNoGo Oscillator broke out of a max GoNoGo Squeeze into negative territory and so it seems there is strong market participation in this move lower in price. There could be some support at June’s runaway gap but if price fails at that level we will look for further price deterioration.

get in touch

Mon - Fri 8:00 - 16:00
Subscription Form
research
$1.99 / week
Trend Analysis and Charts Delivered Weekly
Flight Path
Pre-Market Monday Morning
Launch Conditions
Delivered Every Saturday Morning
Research Chart Pack
16 GoNoGo Charts Included with Every Report
Premium
$9.99 / week
Daily Research
Flight Path
Pre-Market Monday Morning
Launch Conditions
First Thing Saturday Morning
Daily Blast Off
Pre Market Daily
add-ons
Deploy GoNoGo Indicators on Your Favorite Platforms