
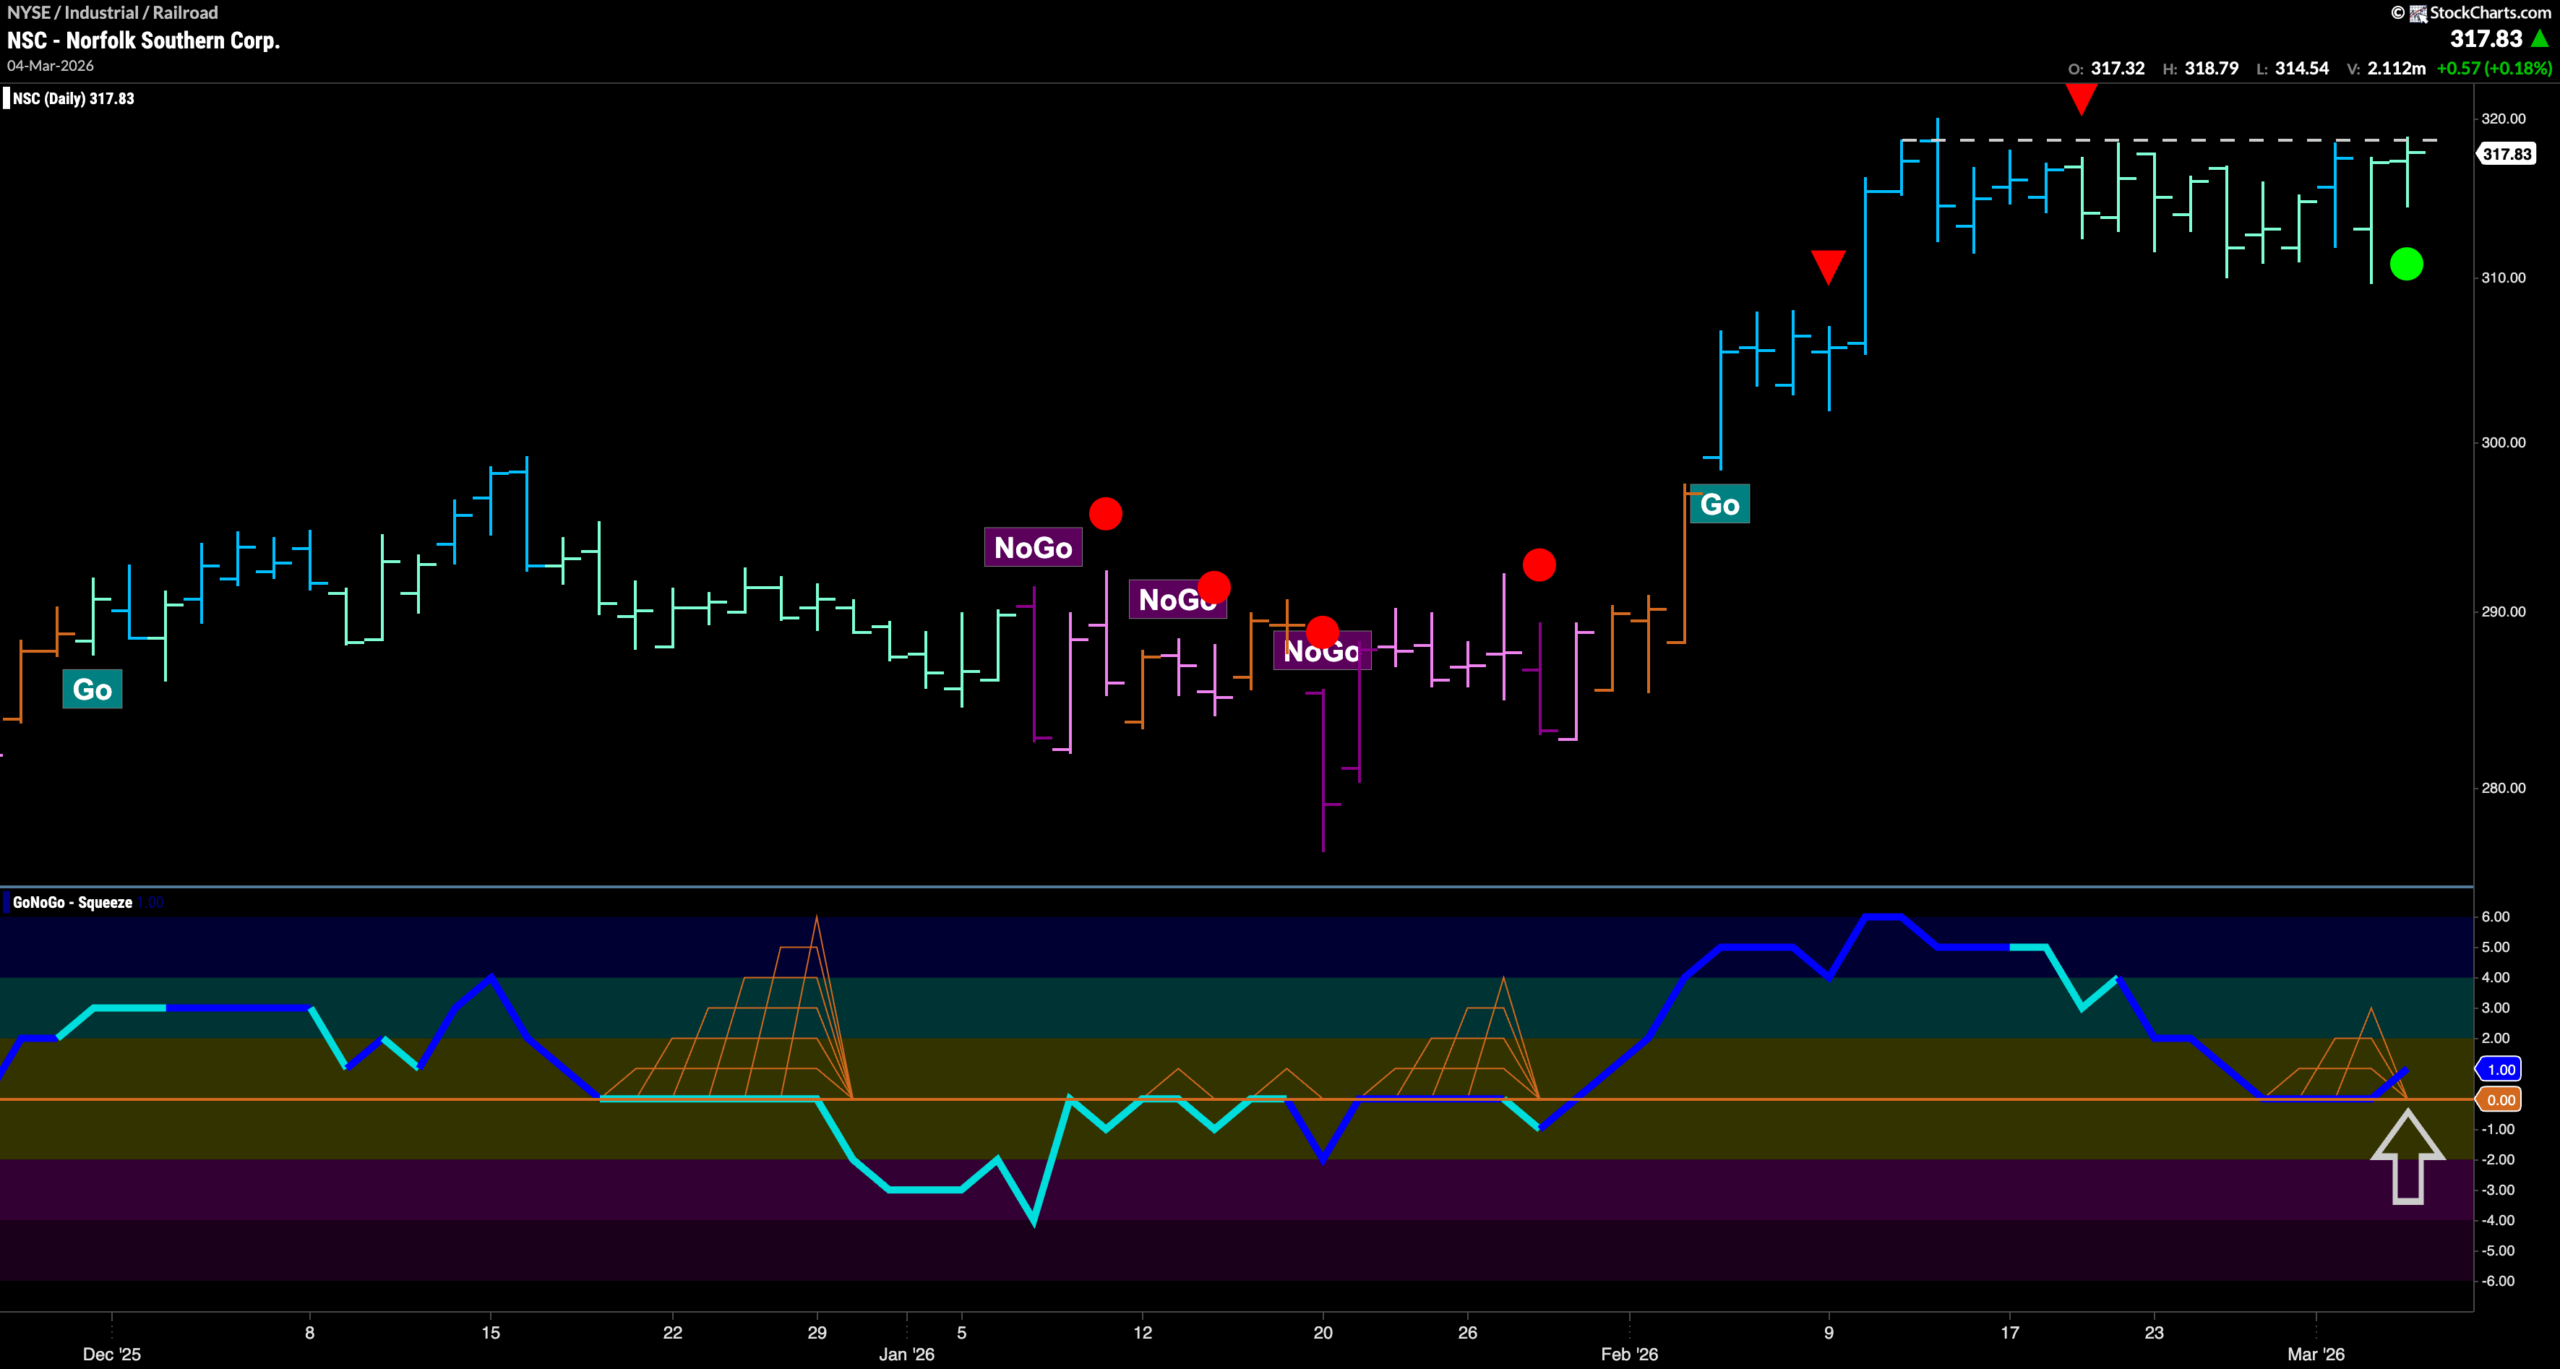

$NSC has been in a “Go” trend since early last month.
Since then, we saw price race to a higher high on strong blue “Go” bars. After the high, price started to drift sideways and soon after a Go Countertrend Correction Icon (red arrow) appeared indicating that price may struggle to go higher in the short term. Indeed, GoNoGo Trend then painted a string of weaker aqua bars as price made no ground. When we look at the oscillator panel, we see that GoNoGo Oscillator fell to test the zero line from above after that period of weakness. After just a couple of bars, we see that it found support and has rallied back into positive territory on heavy volume (darker blue of oscillator). Now, with momentum therefore resurgent in the direction of the trend, we see a Go Trend Continuation Icon (green circle) under price. We will watch to see if this gives price the push it needs to climb above horizontal resistance to a new higher high in the coming days.





