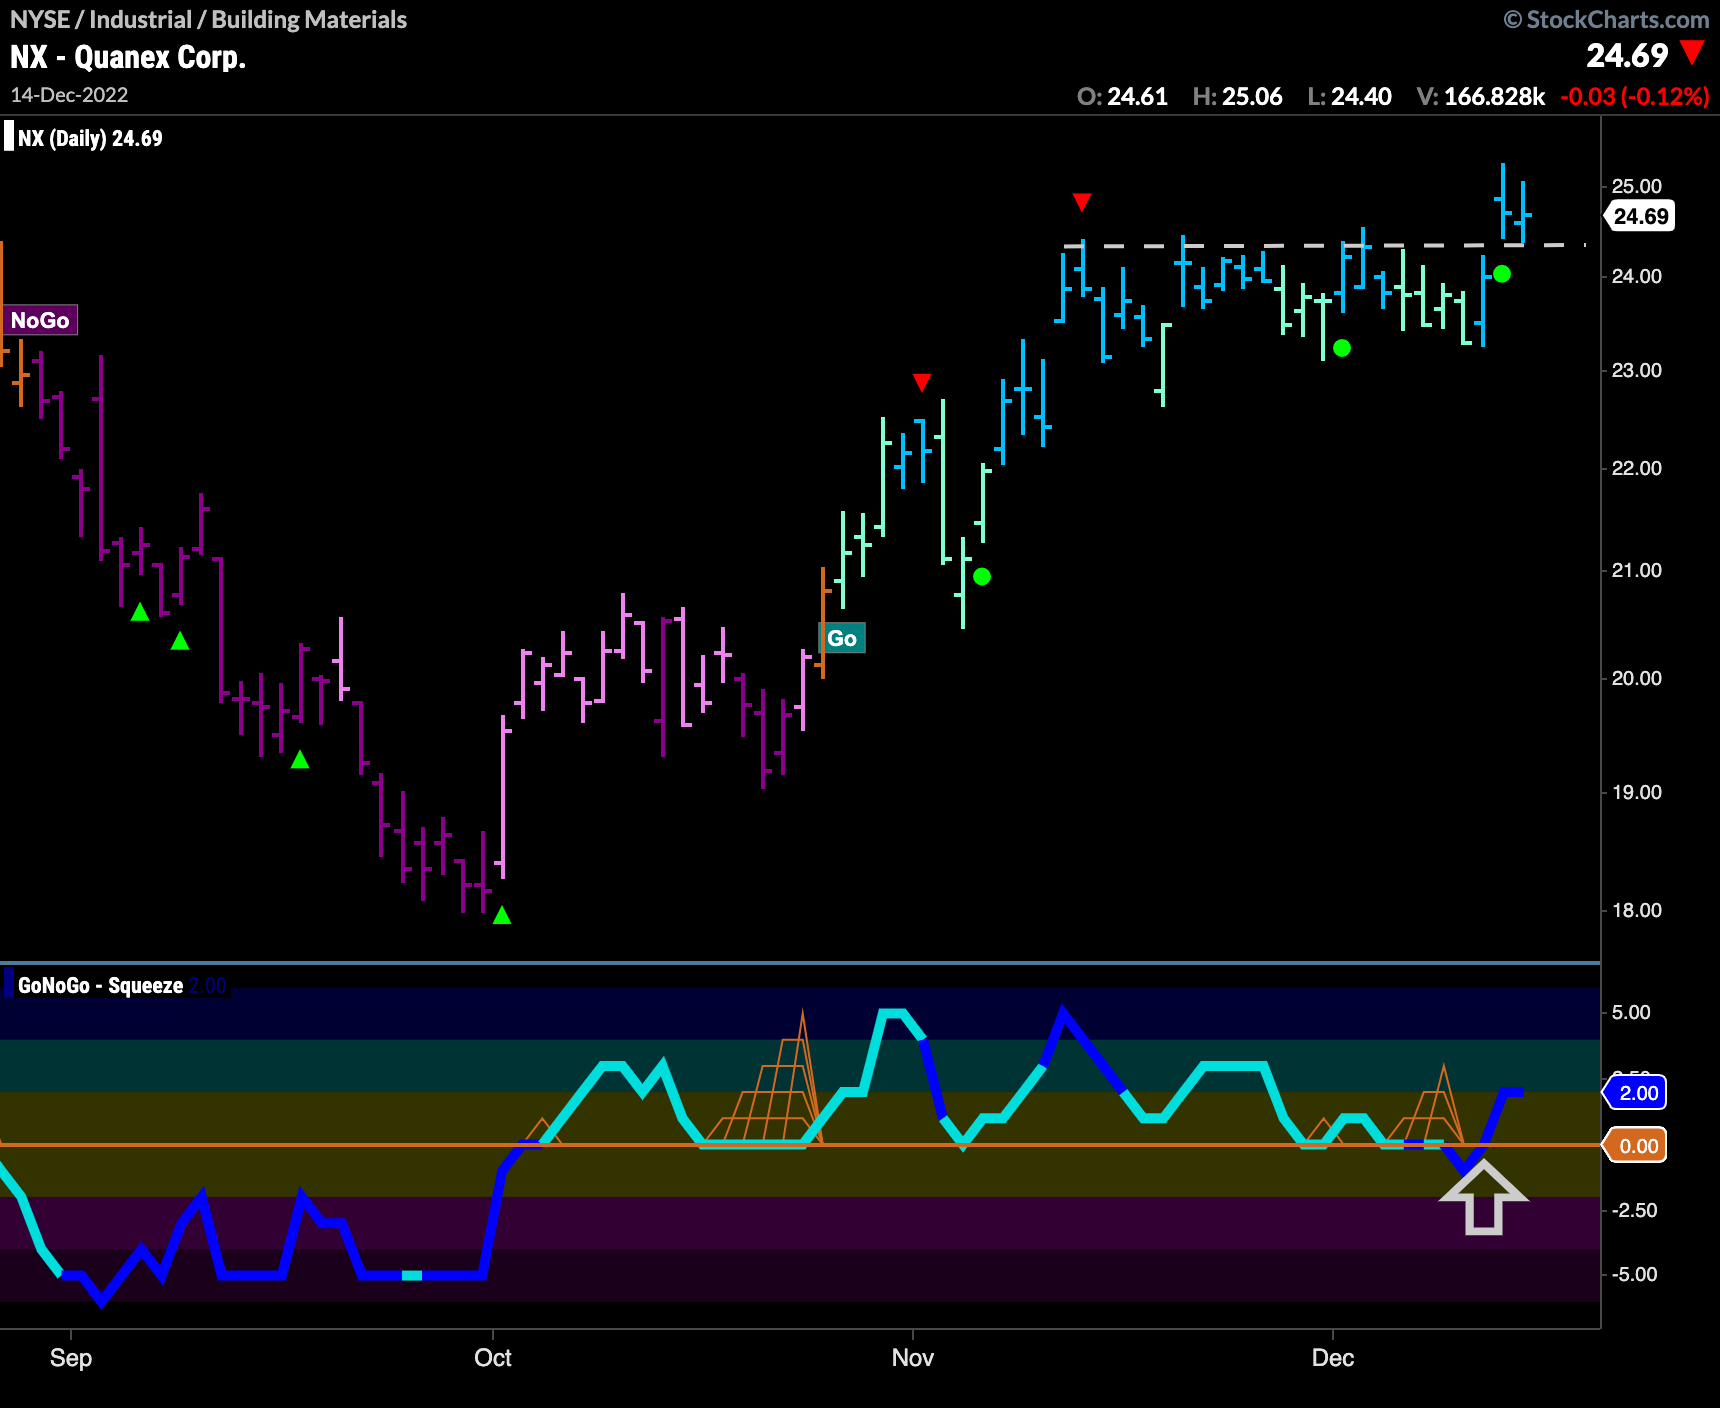
At the end of November $NX entered a “Go” trend and hit a high in early November.
A Go Countertrend Correction Icon (red arrow) appeared on 11/11 that suggested price would struggle to go higher in the short term. Since then, we have seen price move mostly sideways on reduced volatility as GoNoGo Oscillator has hovered around the zero line. Now, on heavy volume we see GoNoGo Oscillator break sharply into positive territory as price climbs above horizontal resistance on strong blue “Go” bars.


