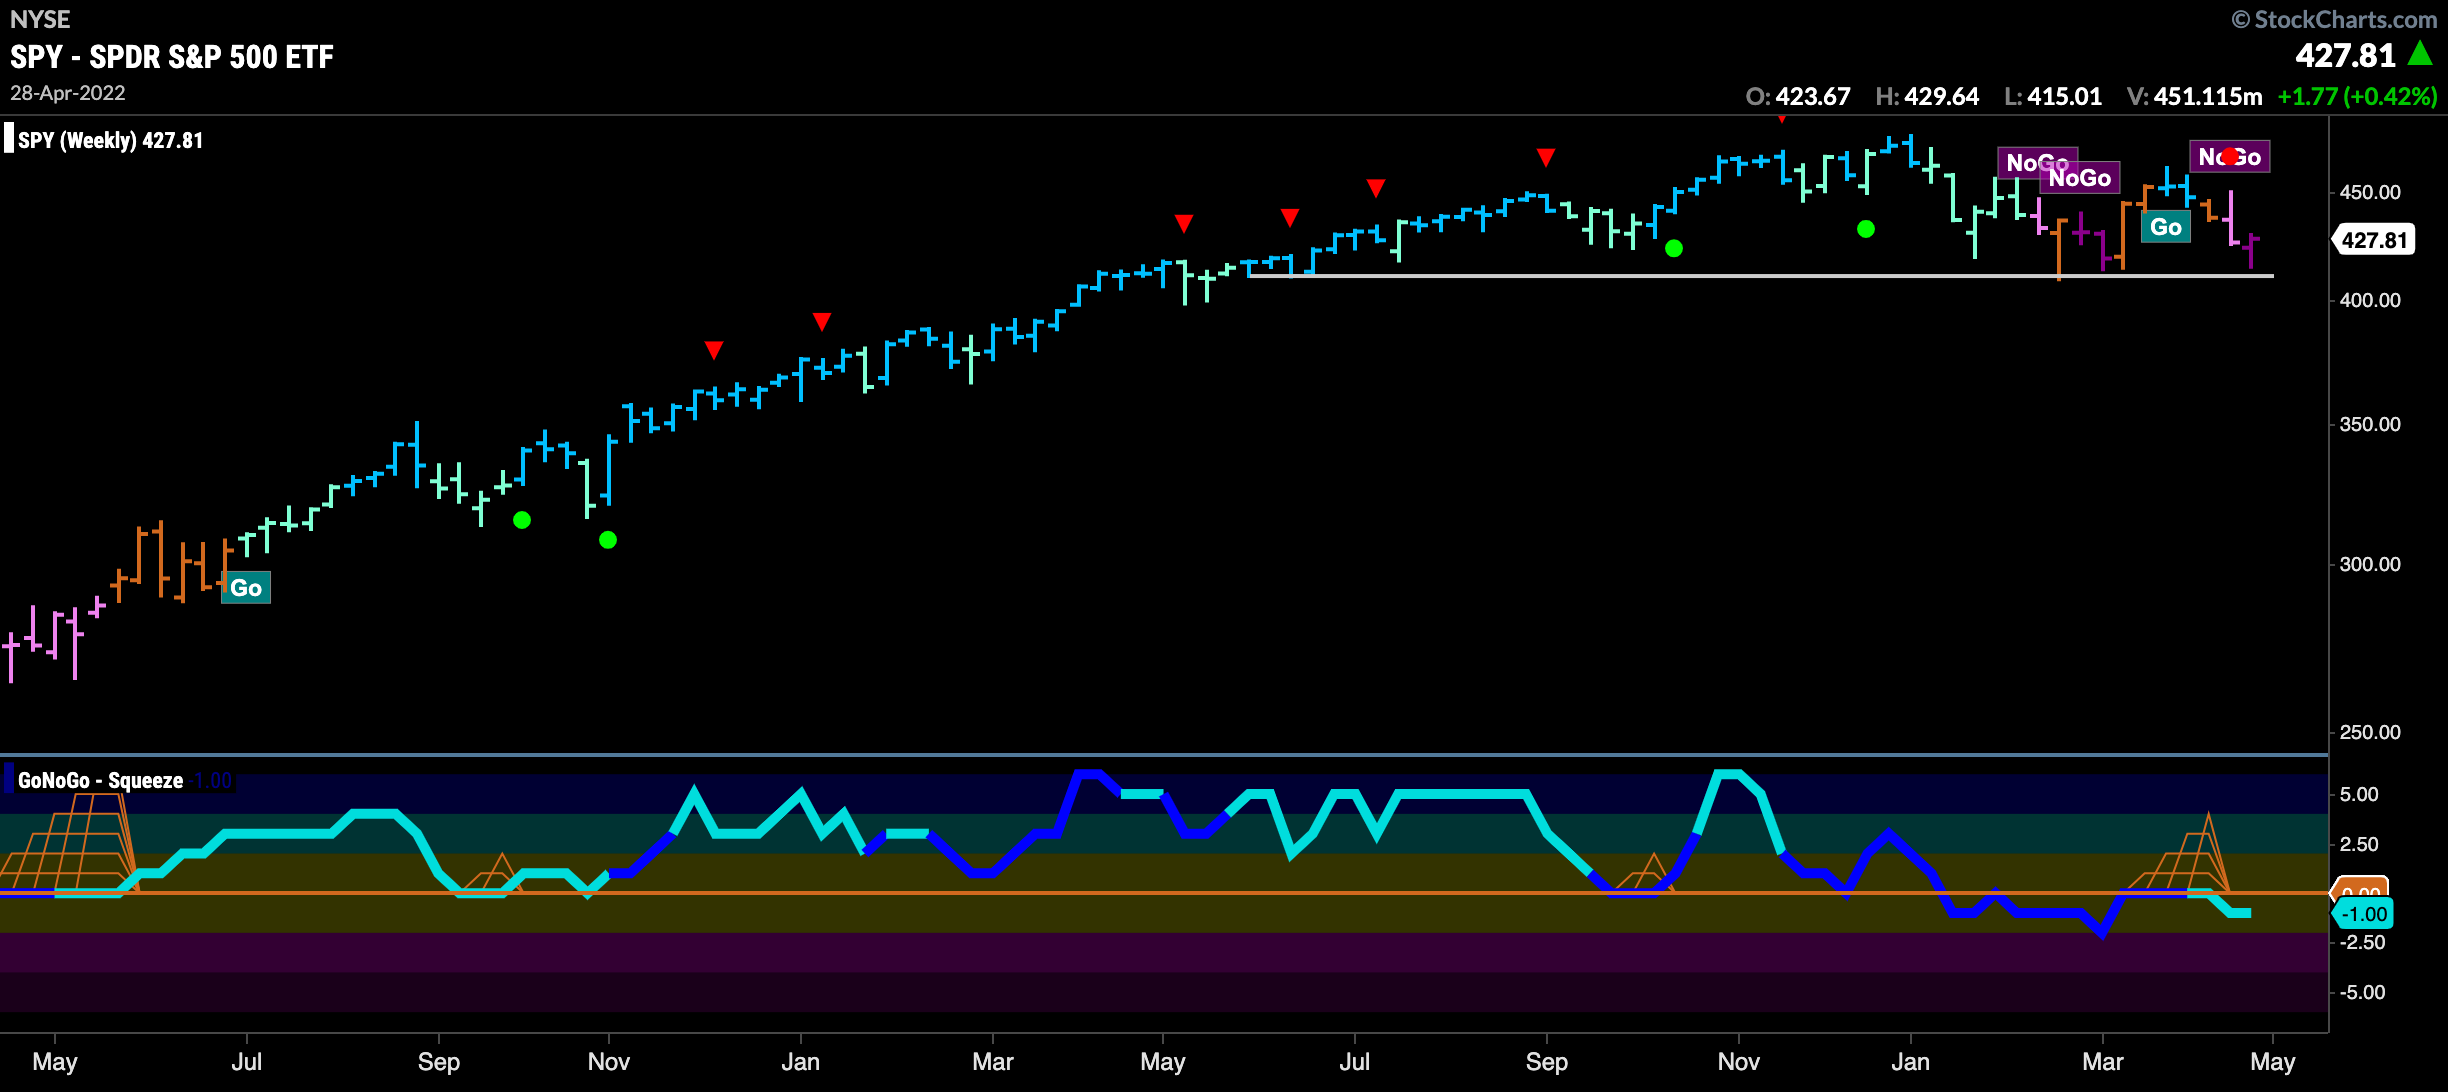

The weekly chart of the $SPY shows how close price is to long term support.
A “NoGo” is in place, and GoNoGo Oscillator has been rejected by the zero line from below. This indicates that momentum is in the direction of the “NoGo”. We may well see this level tested again soon and if a break below support is made it would be a strong move in the “NoGo” trend.


