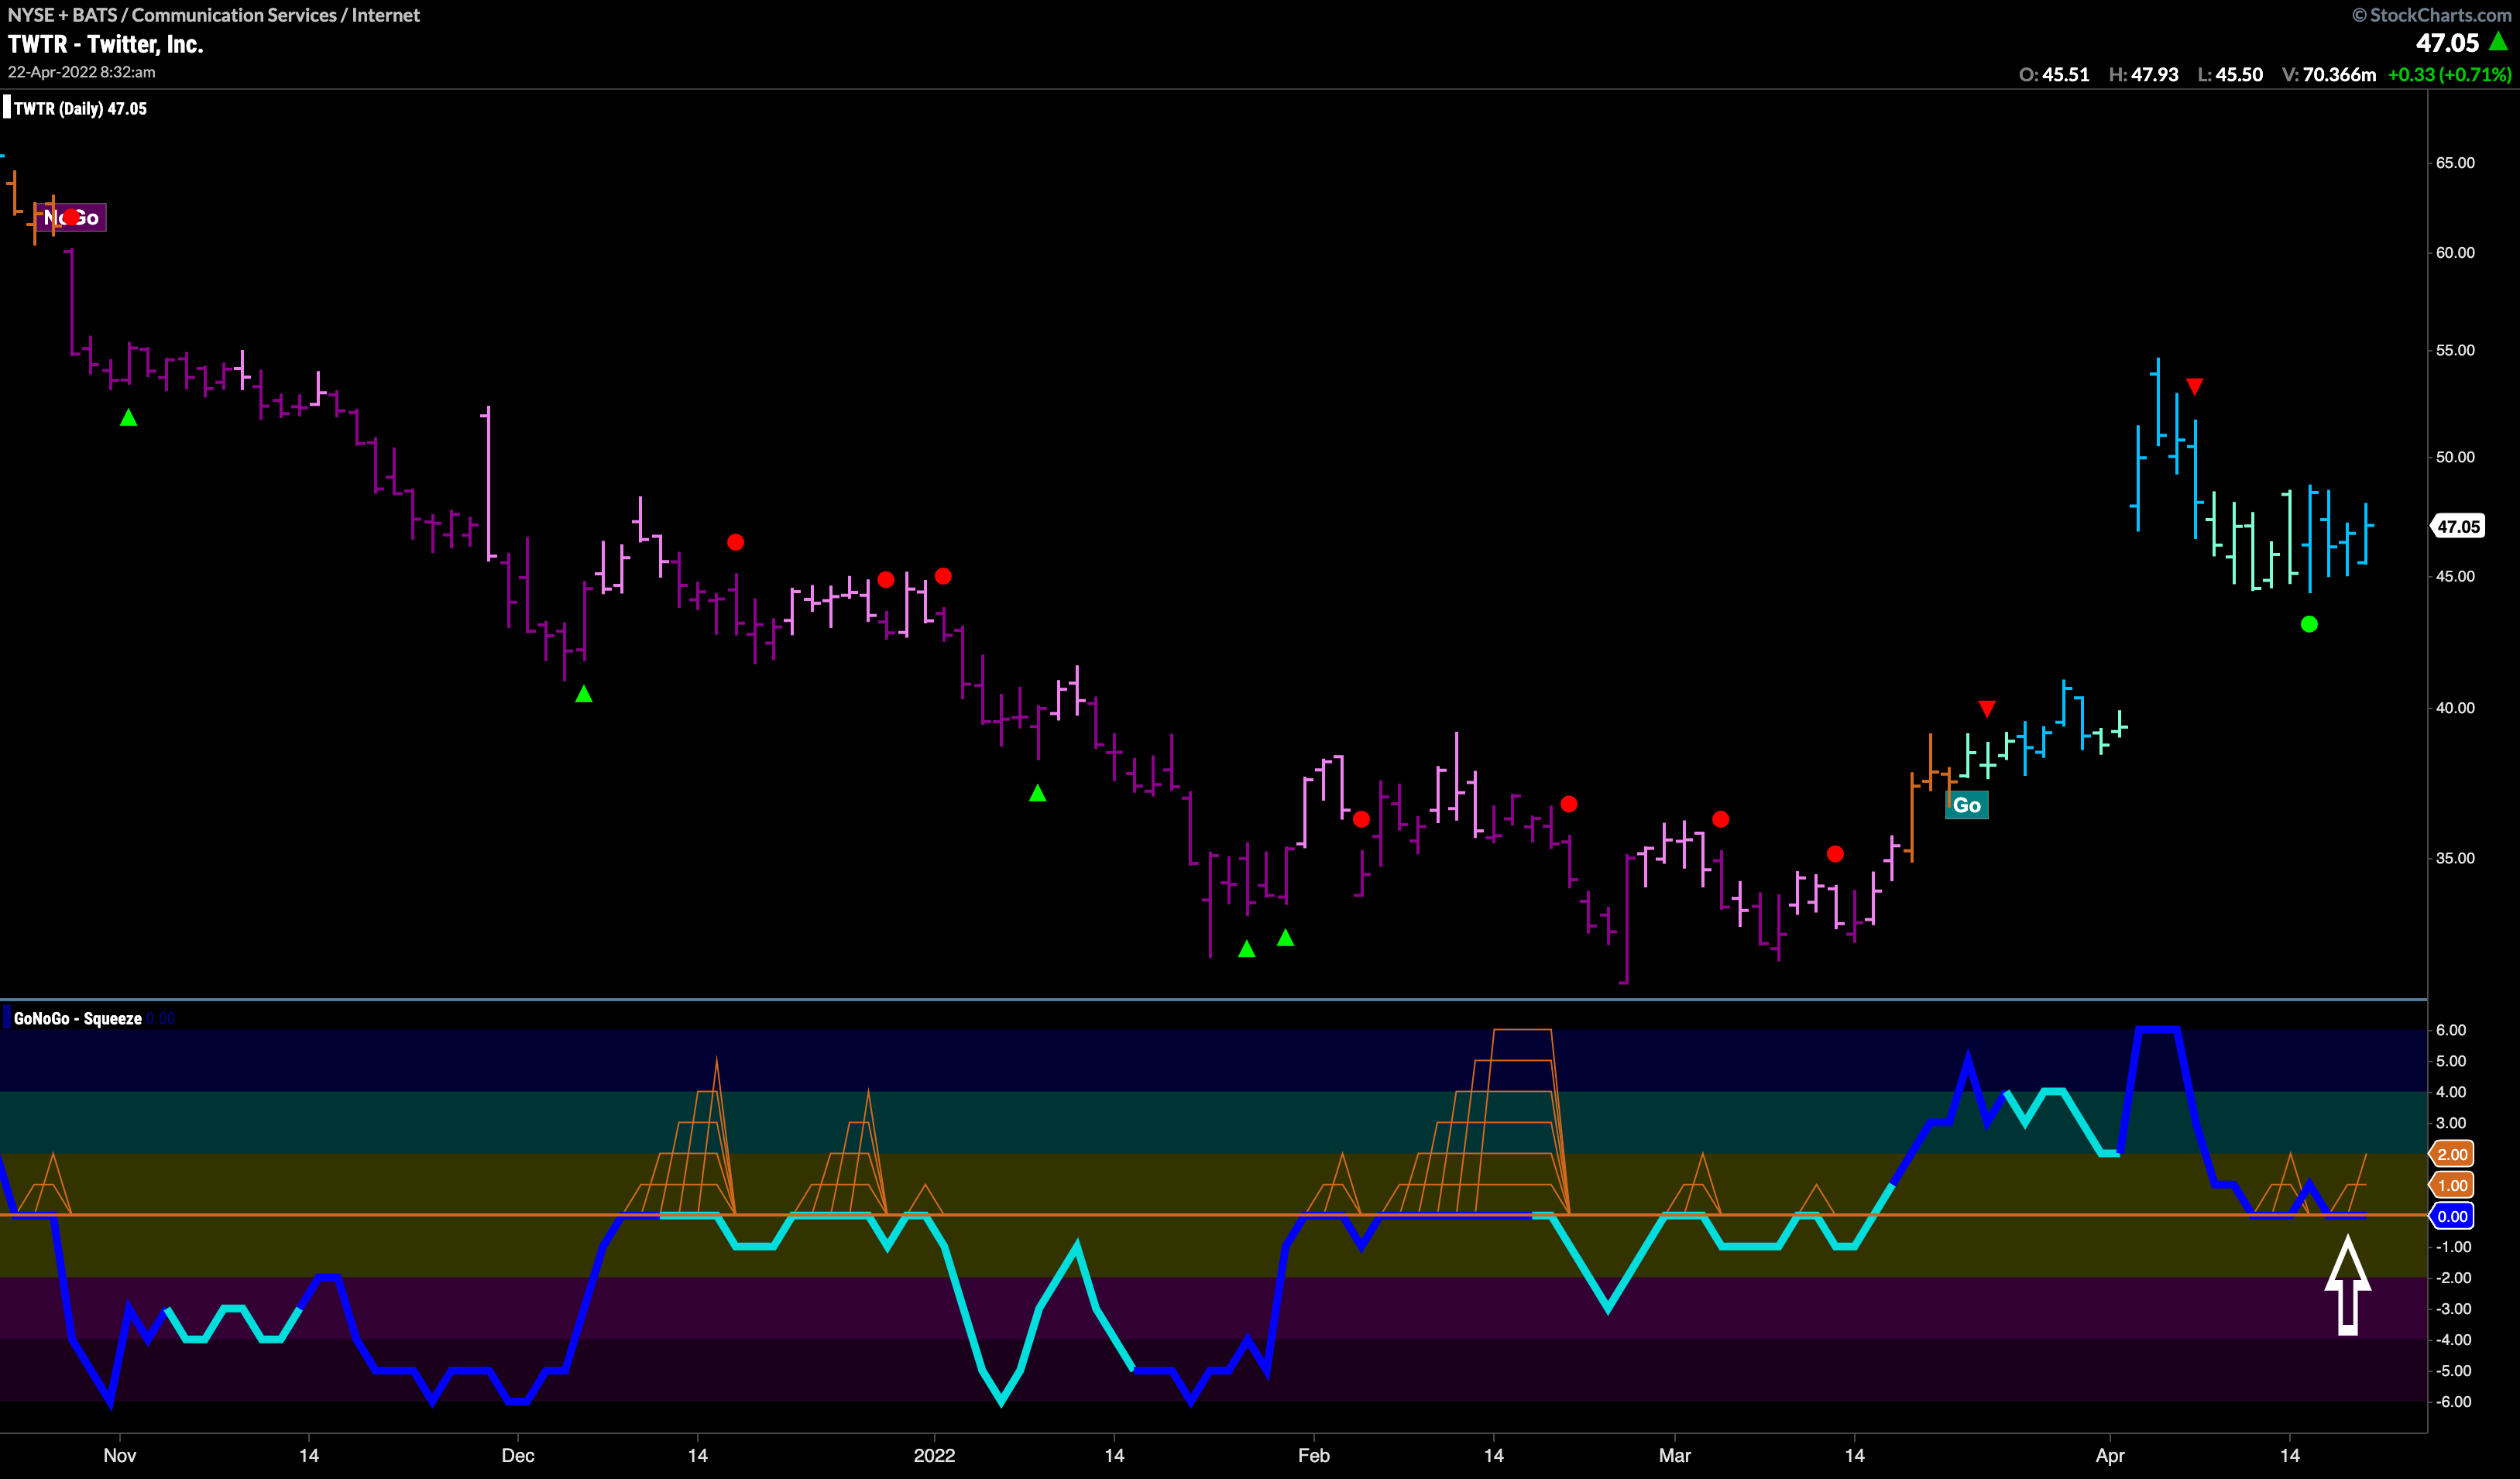

Giant moves for Twitter lately. As investors digest the huge gap in price we saw on the 4th, we can look at the GoNoGo Chart for more insight.
The chart below shows that as price consolidates sideways the “Go” trend has held, with GoNoGo Trend painting strong blue “Go” bars again this week. We will look closely now at GoNoGo Oscillator to see if it finds support at the zero line. If this move is to have legs, then we will expect the oscillator to rally off zero back into positive territory. Should this happen, we will see a Go Trend Continuation icon (green circle) appear under the price bar telling us that momentum is back in the direction of the “Go” trend. This would be the second such icon in quick succession, setting up a move higher in price.


