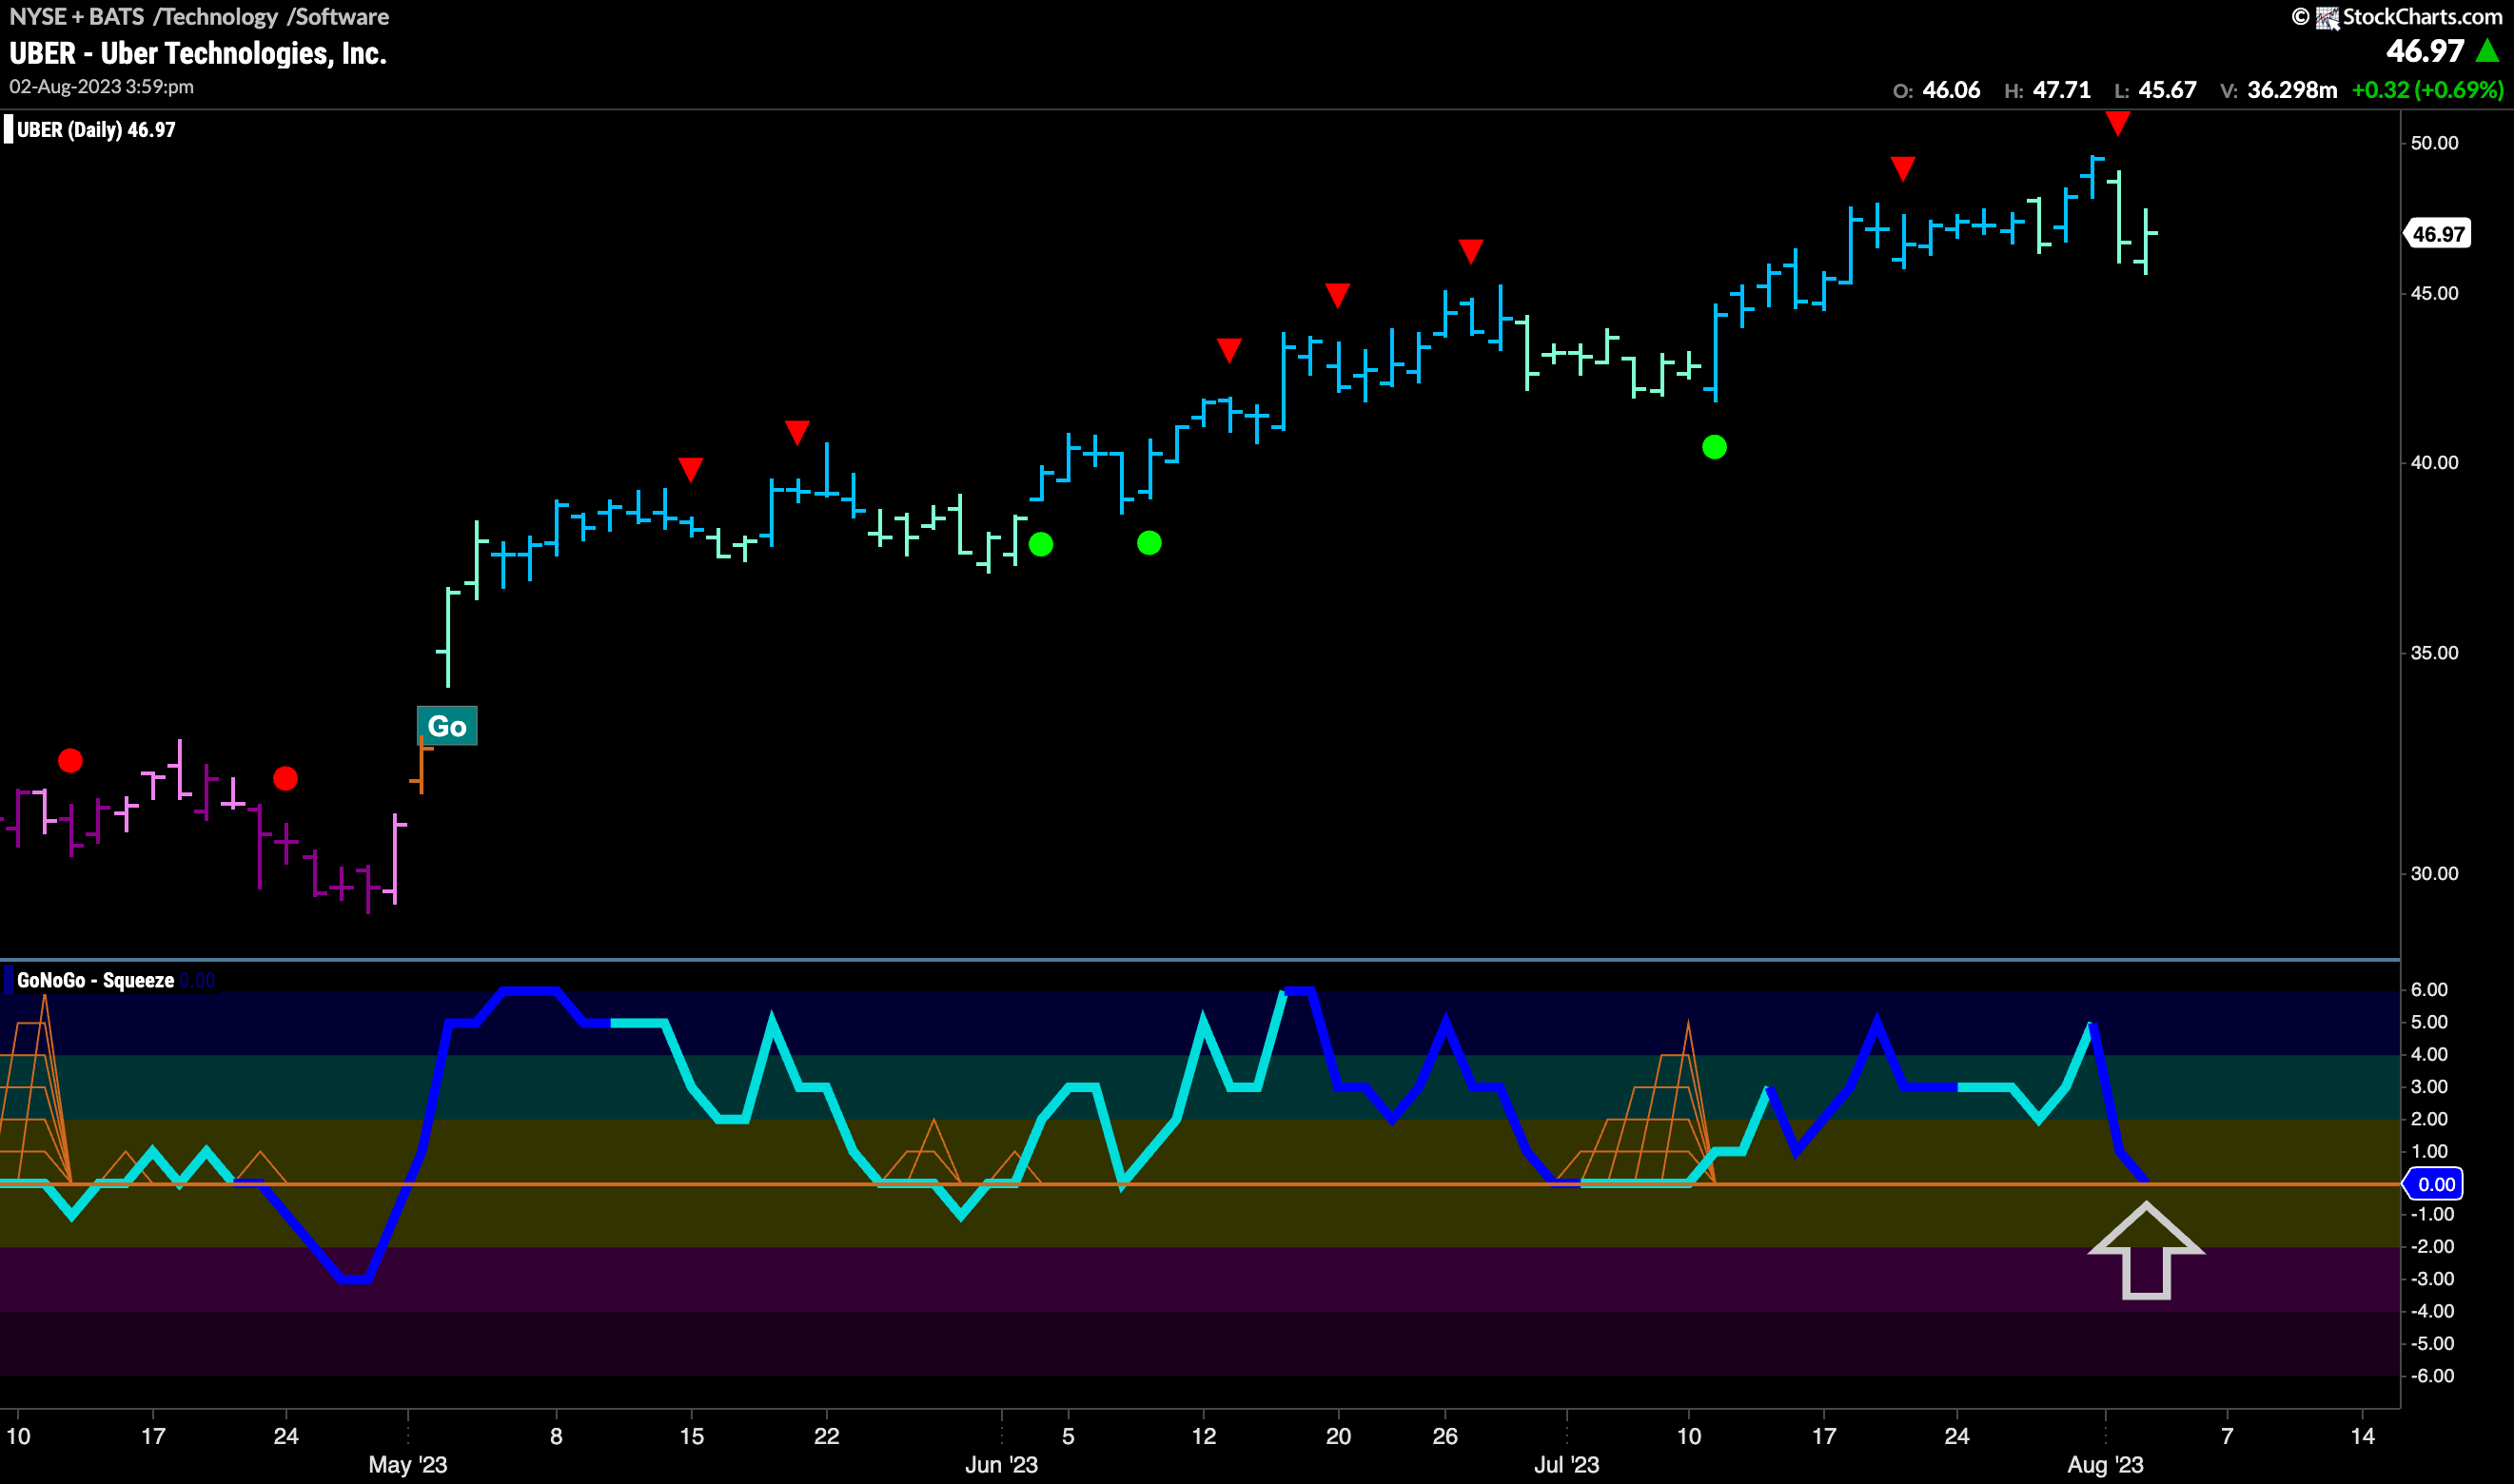
$UBER has been in a “Go” trend since early May.
Along the way it has made a series of higher highs and higher lows. Each time we have seen a pullback within the trend we have seen that GoNoGo Oscillator has found support at the zero line. We are in a similar situation now. A Go Countertrend Correction Icon (red arrow) was triggered after the most recent high, indicating that price may struggle to go higher in the short term. GoNoGo Trend painted a few weaker aqua bars in response as price fell from the high. GoNoGo Oscillator has fallen to once again test the zero line from above and we will look to see if it finds support at this level. Volume is heavy, showing strong market participation. If the Oscillator finds support here and rallies back into positive territory, we can look for another higher high in price.


