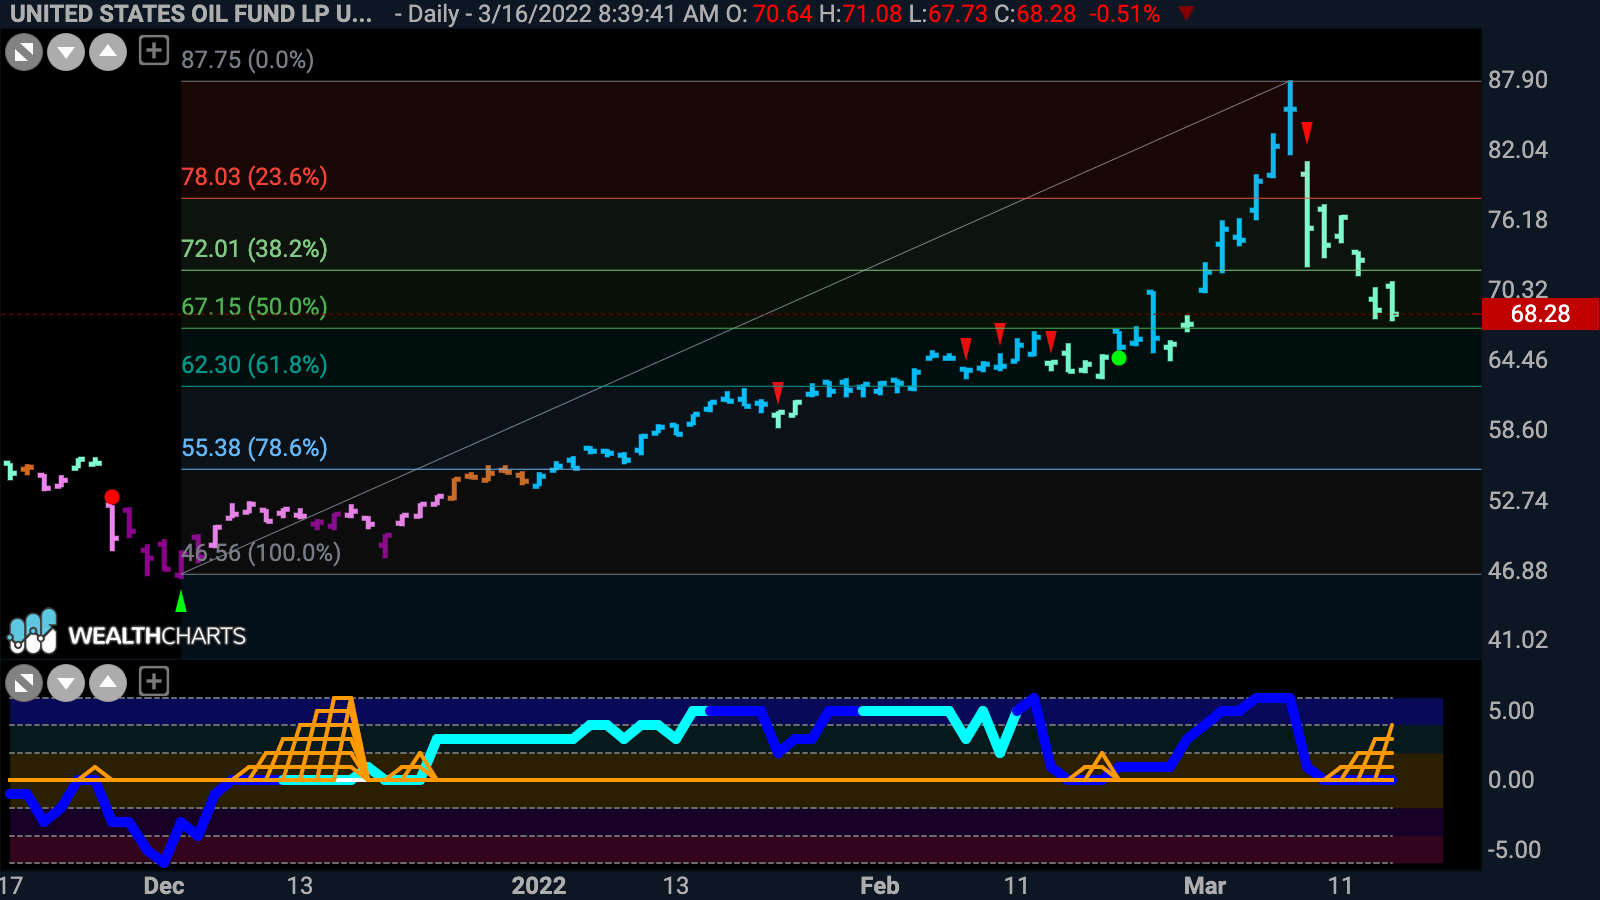

United States Oil Fund has retraced significantly from its high.
We can easily use the Fibonacci Retracement tool on a GoNoGo Chart of $USO to see that the fund has given back significant gains. Price has moved low enough to test the 50% level. GoNoGo Trend tells us that the trend is still a “Go” however, albeit painting weaker aqua bars. Looking to GoNoGo Oscillator, we can see that this price action has sent it crashing to the zero line where it has found itself stuck for several bars as the climbing grid of GoNoGo Squeeze starts to build. Knowing that Fibonacci levels can provide psychological support and using the objective level of zero as support for the GoNoGo Oscillator, we can wait for a Go Trend Continuation green circle (if and when the oscillator rallies off the zero line) to tell us that momentum has returned in the direction of the “Go” trend.


