
$USO: Is this a buy the dip opportunity in oil?
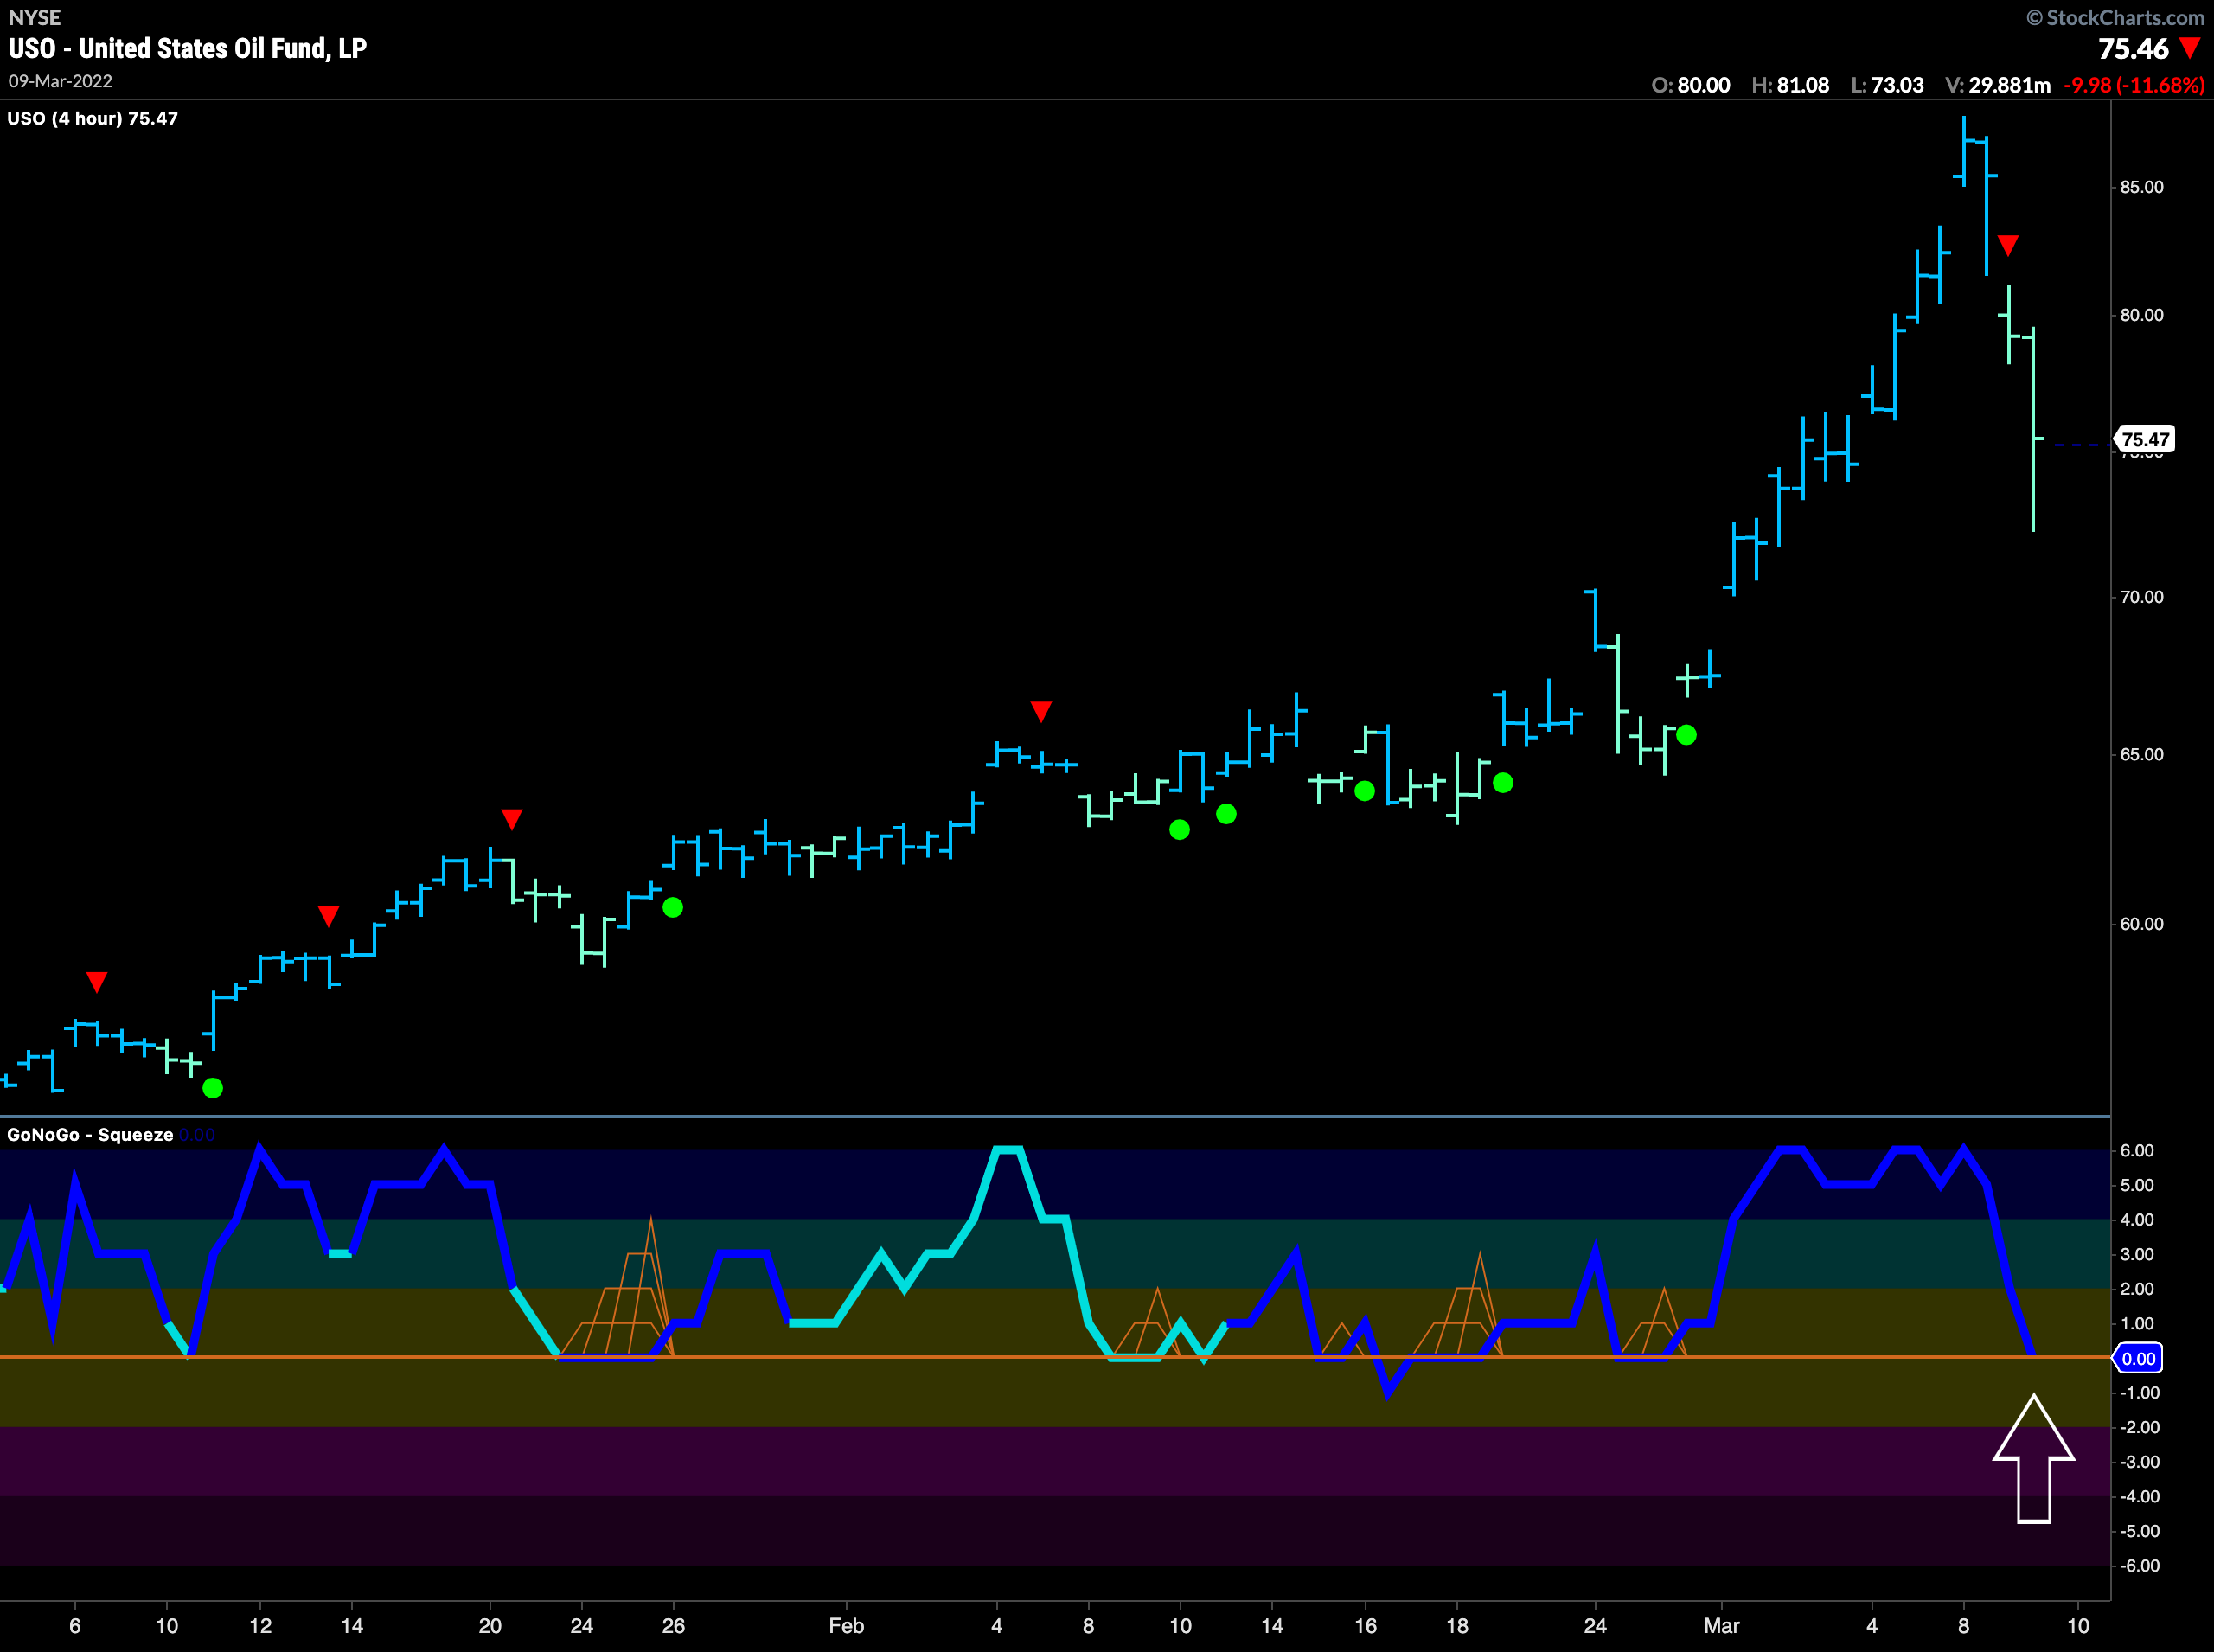
The GoNoGo Chart below shows 4 hour price bars with the GoNoGo Trend, Oscillator and Squeeze applied. If you are of the ilk that yesterday’s big drop in oil prices are an overreaction then we can look for opportunities to enter if the chart gives them. The chart shows that on a 4 hour timeframe the “Go” trend is still in place and the GoNoGo Oscillator has fallen to the zero line on heavy volume. We will look for this level to provide support and if it does we’ll see a Go Trend Continuation green circle suggesting a low risk opportunity to enter the “Go” trend in oil as momentum returns in the direction of the trend.


