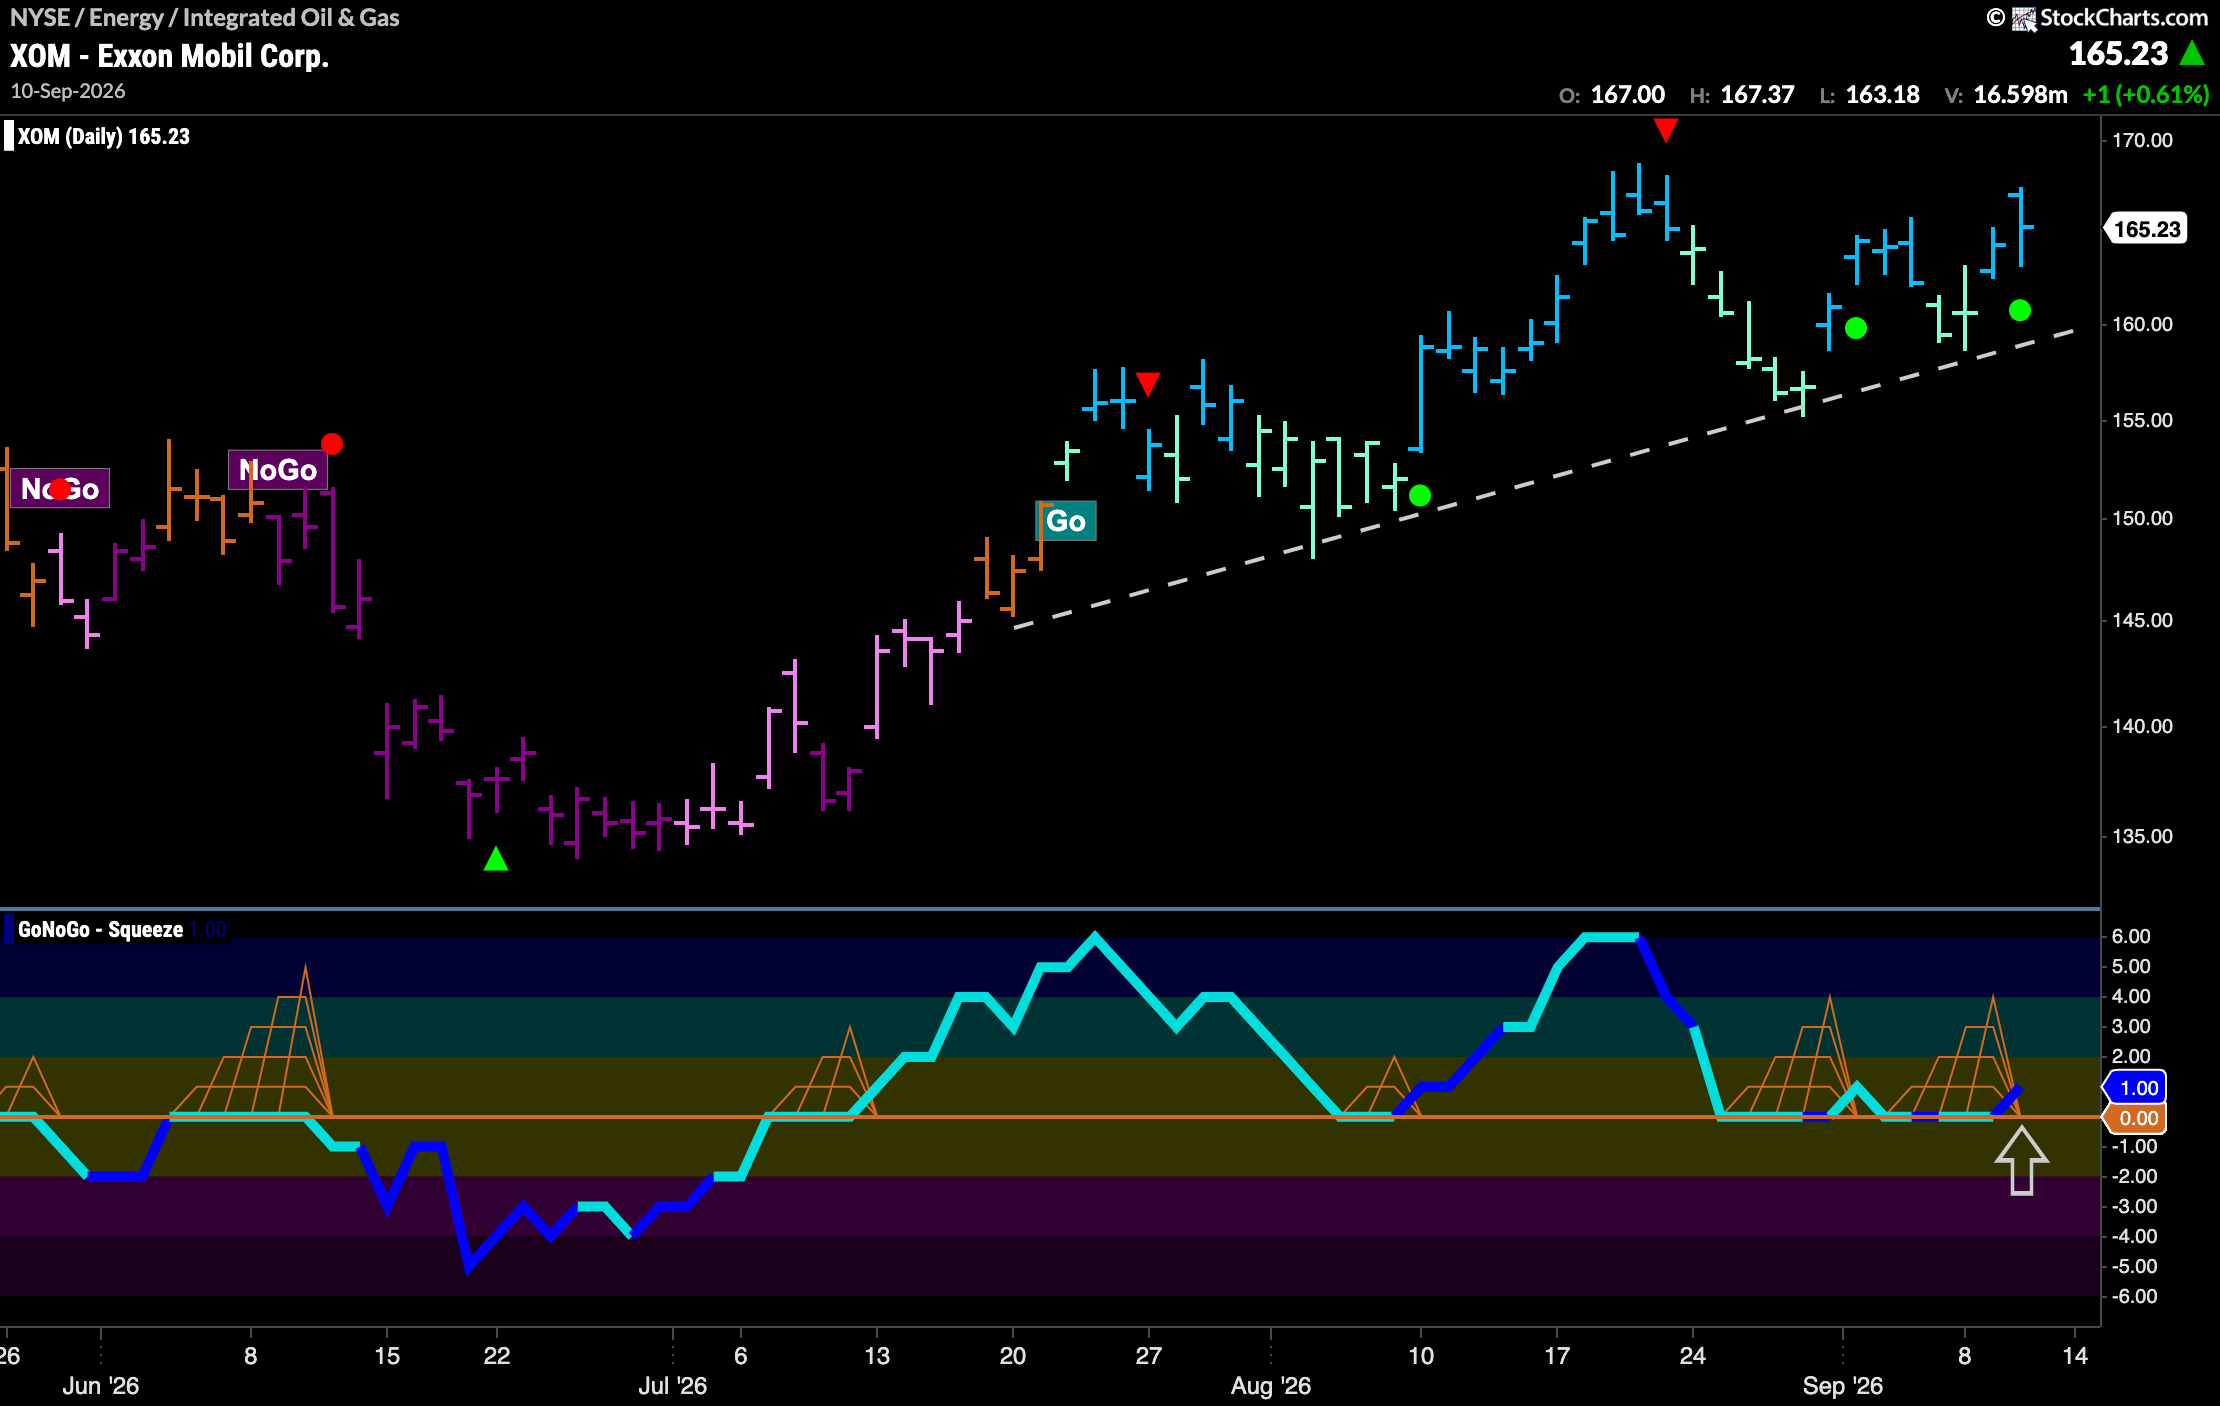

$XOM has been in a “Go” trend since July.
Since then we have seen new highs and lows that has taken price up over $168. After that last higher high, we saw a Go Countertrend Correction Icon (red arrow) indicating that price may struggle to move higher in the short term due to waning momentum. Indeed, we saw price fall from that high on mostly weaker aqua bars and GoNoGo Oscillator fell to test the zero line from above. As price has found support from the upward sloping trend line, GoNoGo Oscillator has found support at the zero line. We see that again, the oscillator is rallying back into positive territory and this has triggered a Go Trend Continuation Icon (green circle) under the price bar. With momentum therefore resurgent in the direction of the “Go” trend we will watch to see if this gives price the push it needs to move to a new higher high in the coming days.