
Can defensive and growth stocks move higher together? What do the charts say? Risky assets remain the place to park money and while we’ve seen rotation within risk assets there is no indication again this week that investors should move money to safe haven assets. Yes, Bitcoin has taken an intra-bar tumble but as of writing has recovered half of the drop back north of $55,000. Yes, a pause was put on the Johnson and Johnson vaccine but it seems this will be short lived as the powers that be determine the risk of blood clots. Let’s peruse the charts to see where the trends can be found. Welcome to your weekly Flight Path market review from GoNoGo Research.
"With a good perspective on history, we can have a better understanding of the past and present,
and thus a clear vision of the future." — Carlos Slim HeluIf
Cross Asset Comparison | GoNoGo HeatMap
In a top-down approach to market analysis, investors need to compare across asset classes. Below is a GoNoGo Heat Map® which highlights the trend conditions of equities, fixed income, commodities, currencies, and digital assets. Note below that the dollar index has fallen into a “NoGo” this week. A falling dollar is thought to be good for stock prices and commodities. This is a risk-on environment. Bullish.

Equity Sectors Relative Strength | GoNoGo RelMap
The S&P 500 has raced higher again this week, putting the psychological barrier of the round number, 4,000, in its rear view mirror. Last week, we were hopeful that more sectors would join the outperformance and we see that this week. Remember, the GoNoGo RelMap applies the GoNoGo Trend concept of blending foundational technical concepts to identify trend to relative ratios.
See the GoNoGo RelMap® below of the S&P sectors relative performance against the broader index:

- Materials ($XLB), Consumer Discretionary ($XLY), Technology ($XLK) and Utilities ($XLU) are in “Go” trends
- Energy’s ($XLE) trend reversal to “NoGo” continues this week painting strong purple bars relative to S&P to close the week
- Interesting to note the “Go” trends in technology, consumer discretionary and utilities thriving together
Information technology, $XLK and consumer discretionary, $XLY both rose out of NoGo into amber last week and followed through to “Go” trends this week. Are we seeing a resurgence in the sectors that drove the rally from the pandemic lows last year? And will we see broad participation in the general equity Go trend as sectors ready for the reopening ($XLI and $XLB for example) and even utilities ($XLU) jump into the fray?
Tech Sector $XLK Furthers Breakout Above All-time Highs
Below is the daily chart of the technology sector ETF $XLK with the GoNoGo Trend, Oscillator and Squeeze applied.
- As noted last week, $XLK has broken out above resistance to new highs. This week that breakout was solidified
- The move came out of an extended squeeze which helped suggest price would surmount resistance from February
- The GoNoGo Oscillator is in positive territory but not overbought at these levels and volume is not excessive

Zooming out to a weekly chart of the $XLK we can see that as we saw on the daily chart the break above all0-time highs has been confirmed and that price moves higher unobstructed.
- GoNoGo Trend continues to paint strong “Go” bars
- GoNoGo Oscillator bounced nicely off the zero line on heavy volume
- The Go Trend continuation icon was timely a few weeks ago

Cisco Systems Triggering Trend Continuation
If the technology sector is back, showing leadership in performance relative to the S&P 500, let’s take a look at a tech name showing “Go” trend tendencies. Below is a daily GoNoGo Chart of Cisco Systems $CSCO.
- The GoNoGo Trend strengthened on the last day of the week painting a strong blue “Go” bar after having consolidated with aqua bars
- There is resistance overhead from prior highs
- The green Go Trend continuation icon suggests that momentum is present in the direction of the trend
- The GoNoGo Oscillator has rallied off zero after having ridden the zero line for several bars

If we zoom out we can see that there is much upside potential for Cisco Systems as shown on the weekly GoNoGo Chart.
- The Go trend has been identified and confirmed with strong blue bars
- The recent green Go trend continuation icon shows that momentum has come back in the direction of the trend
- The GoNoGo Oscillator bounced quickly after finding support at the zero line

Vaccine Scare for Johnson and Johnson
The J&J vaccine was paused for an investigation into the extremely rare cases of blood clots. Let’s take a look at the GoNoGo chart below to see what the technicals say.
- Price action has been corrective since the high at the end of January
- GoNoGo Trend managed to reverse out of the NoGo at the end of March and although has painted several “Go Fish” bars has not reverted back to “NoGo” colors
- This week, a fresh “Go” flag was identified and the week ended with a strong blue bar
- The GoNoGo Oscillator is back at zero and we will look to see it rally into positive territory if it is to confirm the “Go” trend
- If the bad news has been priced in, and the pause in vaccine distribution is temporary, then the “Go” trend may persist

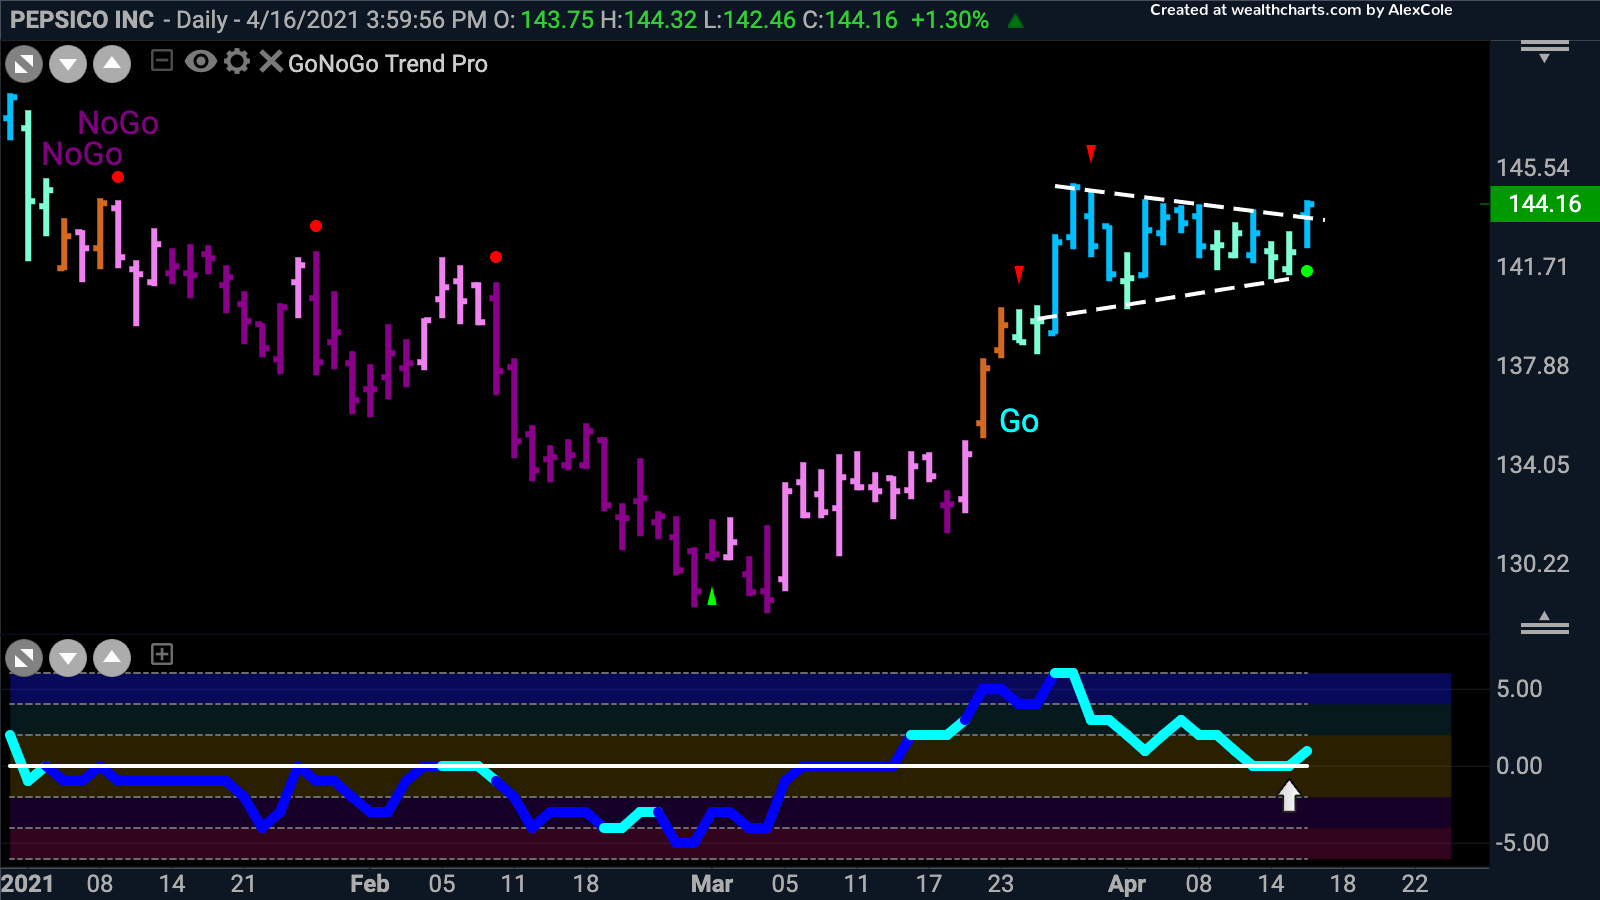
A Pep in the Step of PepsiCo Inc
Let’s close with a look at an American staple in the food and beverage industry. Below is the daily GoNoGo chart of PepsiCo Inc.
- After the lows in March, the GoNoGo Oscillator was not rejected by the zero line and instead broke into positive territory on heavy volume
- The GoNoGo Trend followed soon after by changing to amber “Go Fish” bars indicating that the “NoGo” trend was over
- This rally continued and the GoNoGo Trend has been painting “Go” colors since
- There now has been a consolidation after the quick rally in the shape of a pennant/triangle
- This is a favorite GoNoGo setup as the consolidation has caused the GoNoGo Oscillator to fall to zero where it seems to have found support
- This price action has triggered a low risk Go Trend continuation icon to appear under price (green circle) as price tries to break above resistance


