
Stocks were lower last week, with the broad market averages recording modest declines of less than 1% for the week ending March 19, 2021. Recent leaders such as small & mid-cap stocks were hit the hardest, as was the energy sector. Despite large moves in individual names and uniform downside direction of stocks on Thursday, “Go” trends remain in place for risk assets as they have for many weeks. Equities trend conditions weakened into the end of the week after briefly touching new record highs. The “Go” in commodities is still holding despite a nearly 8% drawdown in oil. Digital assets continue to push higher as the cryptocurrency market expands. The US dollar continues to show more constructive price action as it holds its recent Go trend.

The GoNoGo Heat Map® above shows us the daily trend performance of five asset classes: Equities, Bonds, Commodities, Currencies, and Digital Assets from the US perspective. The takeaway remains the same as it has been for several weeks. Equities, commodities, and the cryptocurrency markets are now in established “Go” trends.
Panel 1 – Stocks continue to paint “Go” bars as the trend persists, but weakened into the close this week. SPDR® S&P 500® ETF Trust seeks to provide investment results that, before expenses, correspond generally to the price and yield performance of the S&P.
Panel 2 – Government bonds, continue to paint “NoGo” bars, as the downtrend remains strong. $IEF tracks a market-value-weighted index of debt issued by the US Treasury with 7-10 years to maturity remaining.
Panel 3 – Commodities are a “Go” and painting weaker aqua bars again this week. $USCI tracks an equal-weighted index of 14 commodity futures contracts and holds at least one precious metal, industrial metal, energy, livestock, soft, and grain commodity.
Panel 4 – The US Dollar is now in an established “Go” trend and has strengthened this week. $DXY is an index of the value of the United States Dollar relative to a basket of foreign currencies.
Panel 5 – Bitcoin’s “Go” trend continues with strength this week as it climbs ever higher on strong blue bars.
SECTOR STRENGTH
The GoNoGo RelMap® below shows the trend performance of each sector relative to the index.
- Materials continue to paint Go bars as the industrial economy comes back online and commodities climb to new all-time highs
- Despite the strong correction in Oil this week, the Energy sector retained a weak hold on the “Go” trend
- Financials, Industrials, and Communications continue to outperform
- Notice that Consumer Staples – a defensive sector – painted an amber band to close the week

TROUBLE WITH TREASURIES?
The daily chart below shows the trend of 10 yr treasury yield, as many discuss the impact this will have on equities. To be clear, rates are higher, not high. But relative to the pandemic low of 40 basis points, a quick move to 1.73% causes many investors to question stretched valuations of many growth stocks.
- Price has made consecutive higher highs and higher lows as GoNoGo Trend® paints a surging uptrend with blue and aqua bars
- GoNoGo Oscillator® is currently overbought as the strength of the trend continues

The rapid rate of change in treasury yields has spooked some investors. A larger timeframe will bring some perspective to where the markets are in the primary trend. See the same 10 yr US Government Treasury yields on the weekly chart below.
- GoNoGo Trend is painting bright blue bars indicating that the trend conditions are strong
- The $TNX has entered an area that may present resistance to further upside moves

EXTRA ENERGY?
The energy trade has been a fantastic “Go” through the first quarter. The daily chart below shows GoNoGo Trend of the energy sector of the S&P 500, $XLE.
- Countertrend corrections in price last week show substantial profit-taking amongst investors, but the trend conditions for $XLE are still a “Go”
- GoNoGo Trend is painting aqua bars
- GoNoGo Oscillator is at the zero line, where we will watch to see it finds support
- If the GoNoGo Oscillator rallies back into positive territory, a trend continuation icon will signal another low-risk entry into the trend

SOLAR TO SOAR?
The chart below is a weekly GoNoGo Chart of Sunpower Corp, $SPWR
- Price saw a parabolic move higher that has since corrected
- GoNoGo Trend is painting aqua bars as the trend has weakened
- GoNoGo Oscillator is riding the zero line
- If the long term “Go” trend remains in place, look for GoNoGo Oscillator to rally into positive territory

The daily chart shows that the trend in the short term is a “NoGo.” Price action on the weekly chart will confirm if this is simply a countertred correction in the face of the larger uptrend.
- Daily price action for $SPWR is painting NoGo bars
- There is bullish divergence between price and GoNoGo Oscillator as price made a lower low and the oscillator did not
- GoNoGo Oscillator is now at the zero line, testing from below as the grid of the GoNoGo Squeeze® climbs. If it gets rejected here, price may make another leg down
- If the GoNoGo Oscillator can break into positive territory, the “Go” trend may return

FEARLESS FINANCIALS
Another sector that has been a runaway leader in both absolute and relative performance is the financial sector. The GoNoGo chart below shows daily price action of $XLF.
- Price made another higher high this week but ended the week painting an aqua bar
- GoNoGo Oscillator is testing the zero line from above, where it should find support
- If the oscillator can rally into positive territory, we will see a low-risk entry point signaled by a green trend continuation icon under the price bar

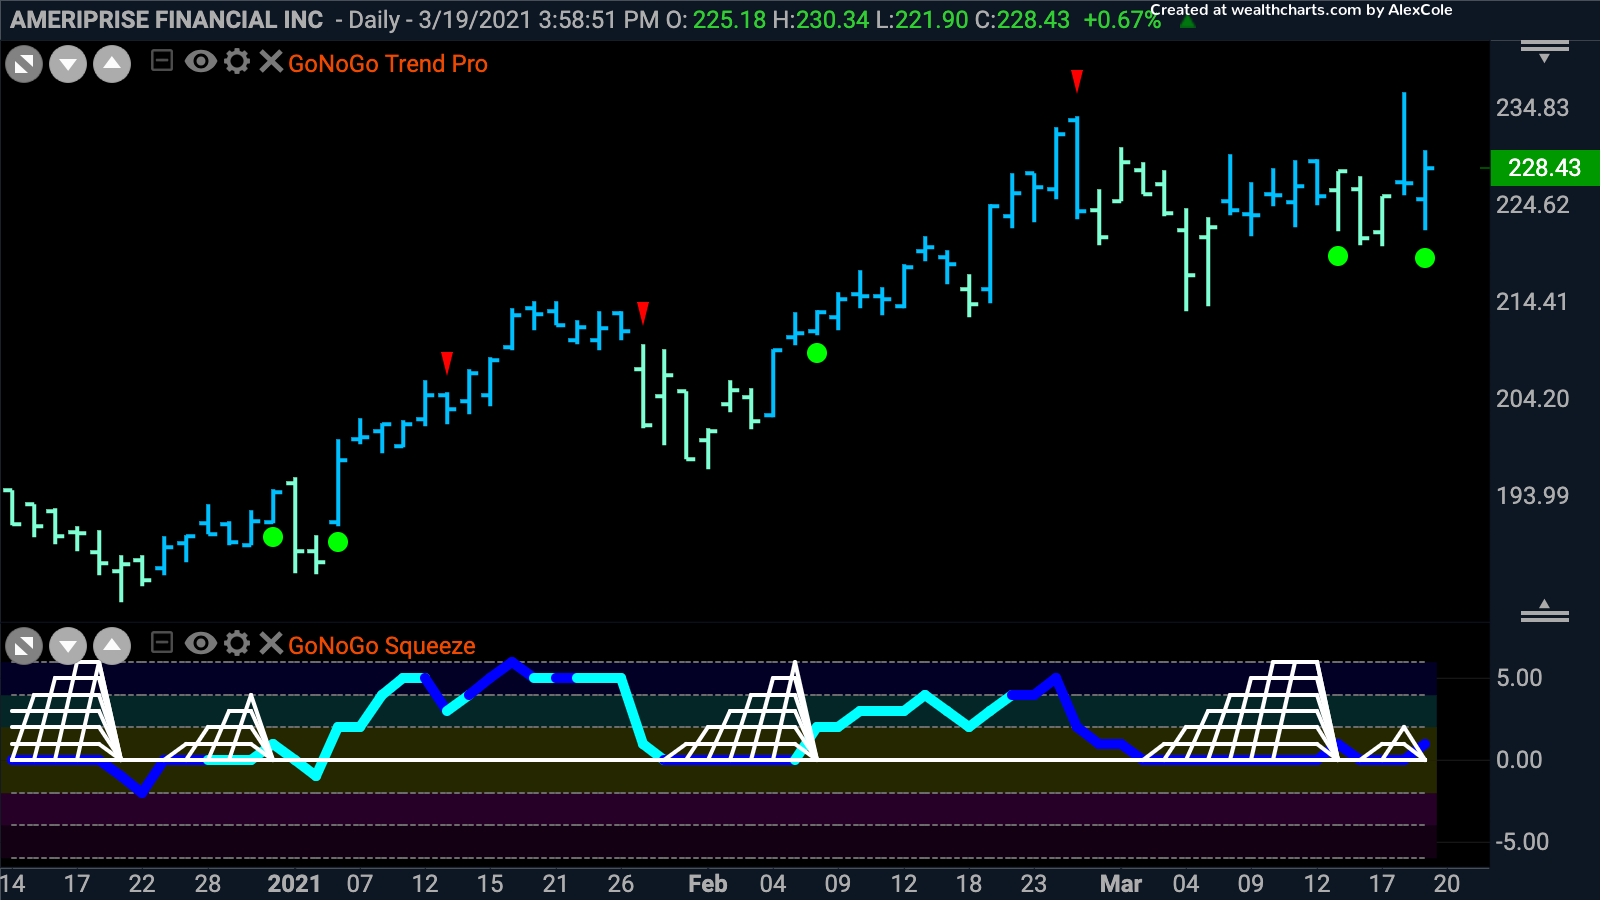
AMERIPRISE A GO!
Searching within the financial sector for individual names that have done well in the context of rising yields, the chart below shows daily prices for Ameriprise Financial ($AMP) with the GoNoGo Trend and Oscillator applied.
- After consolidating sideways for a few weeks, we have seen multiple trend continuation icons triggered as price tries to climb above prior highs
- GoNoGo Trend has strengthened toward the end of the week with bright blue bars being painted
- GoNoGo Oscillator has been riding the zero line resulting in the climbing grid of the squeeze
- A rally into positive territory and a breakout of the squeeze would likely result in a substantial move higher


