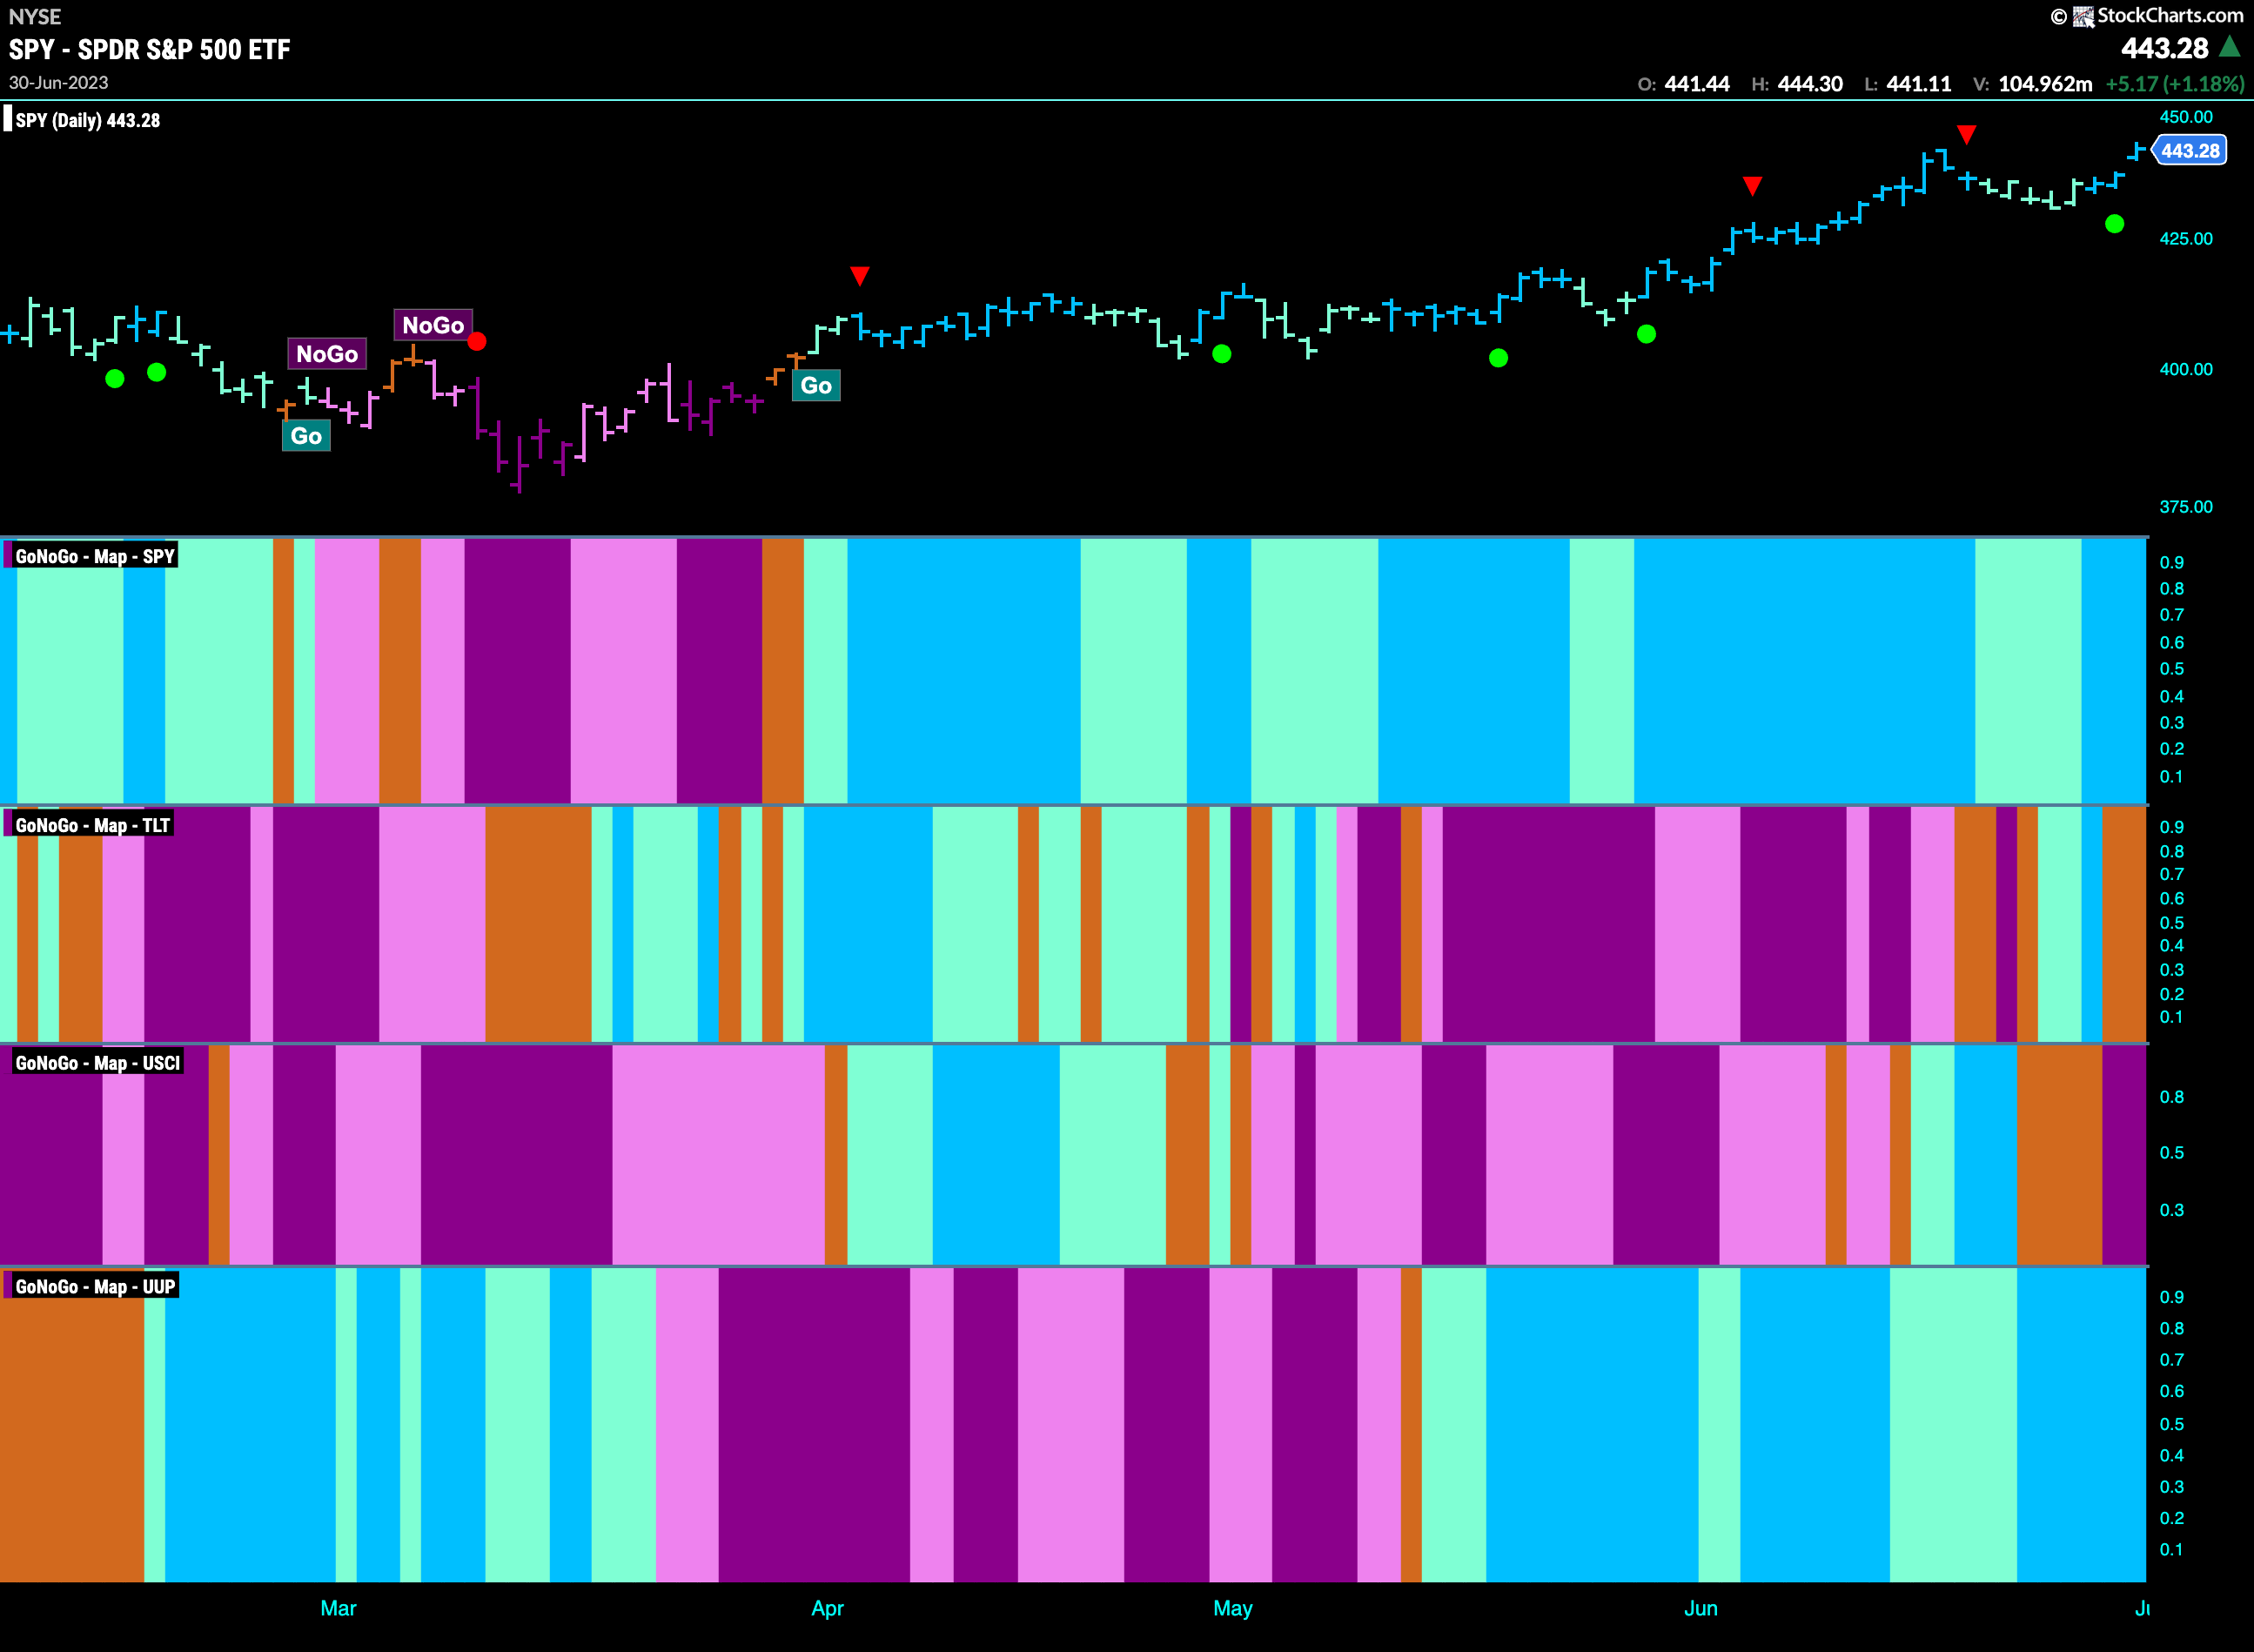
Good morning and welcome to this week’s Flight Path. The heat map shows that the “Go” trend in equities continued this week. We saw a return to bright blue “Go” bars as price attacked the prior high. Treasury bond prices experience some uncertainty this week as we see a couple of amber “Go Fish” bars return. Commodity prices saw some struggle this week as we see two “NoGo” bars to end the week. The dollar saw a return to strength as we see several bright blue “Go” bars.
Equity Prices Attack Prior High
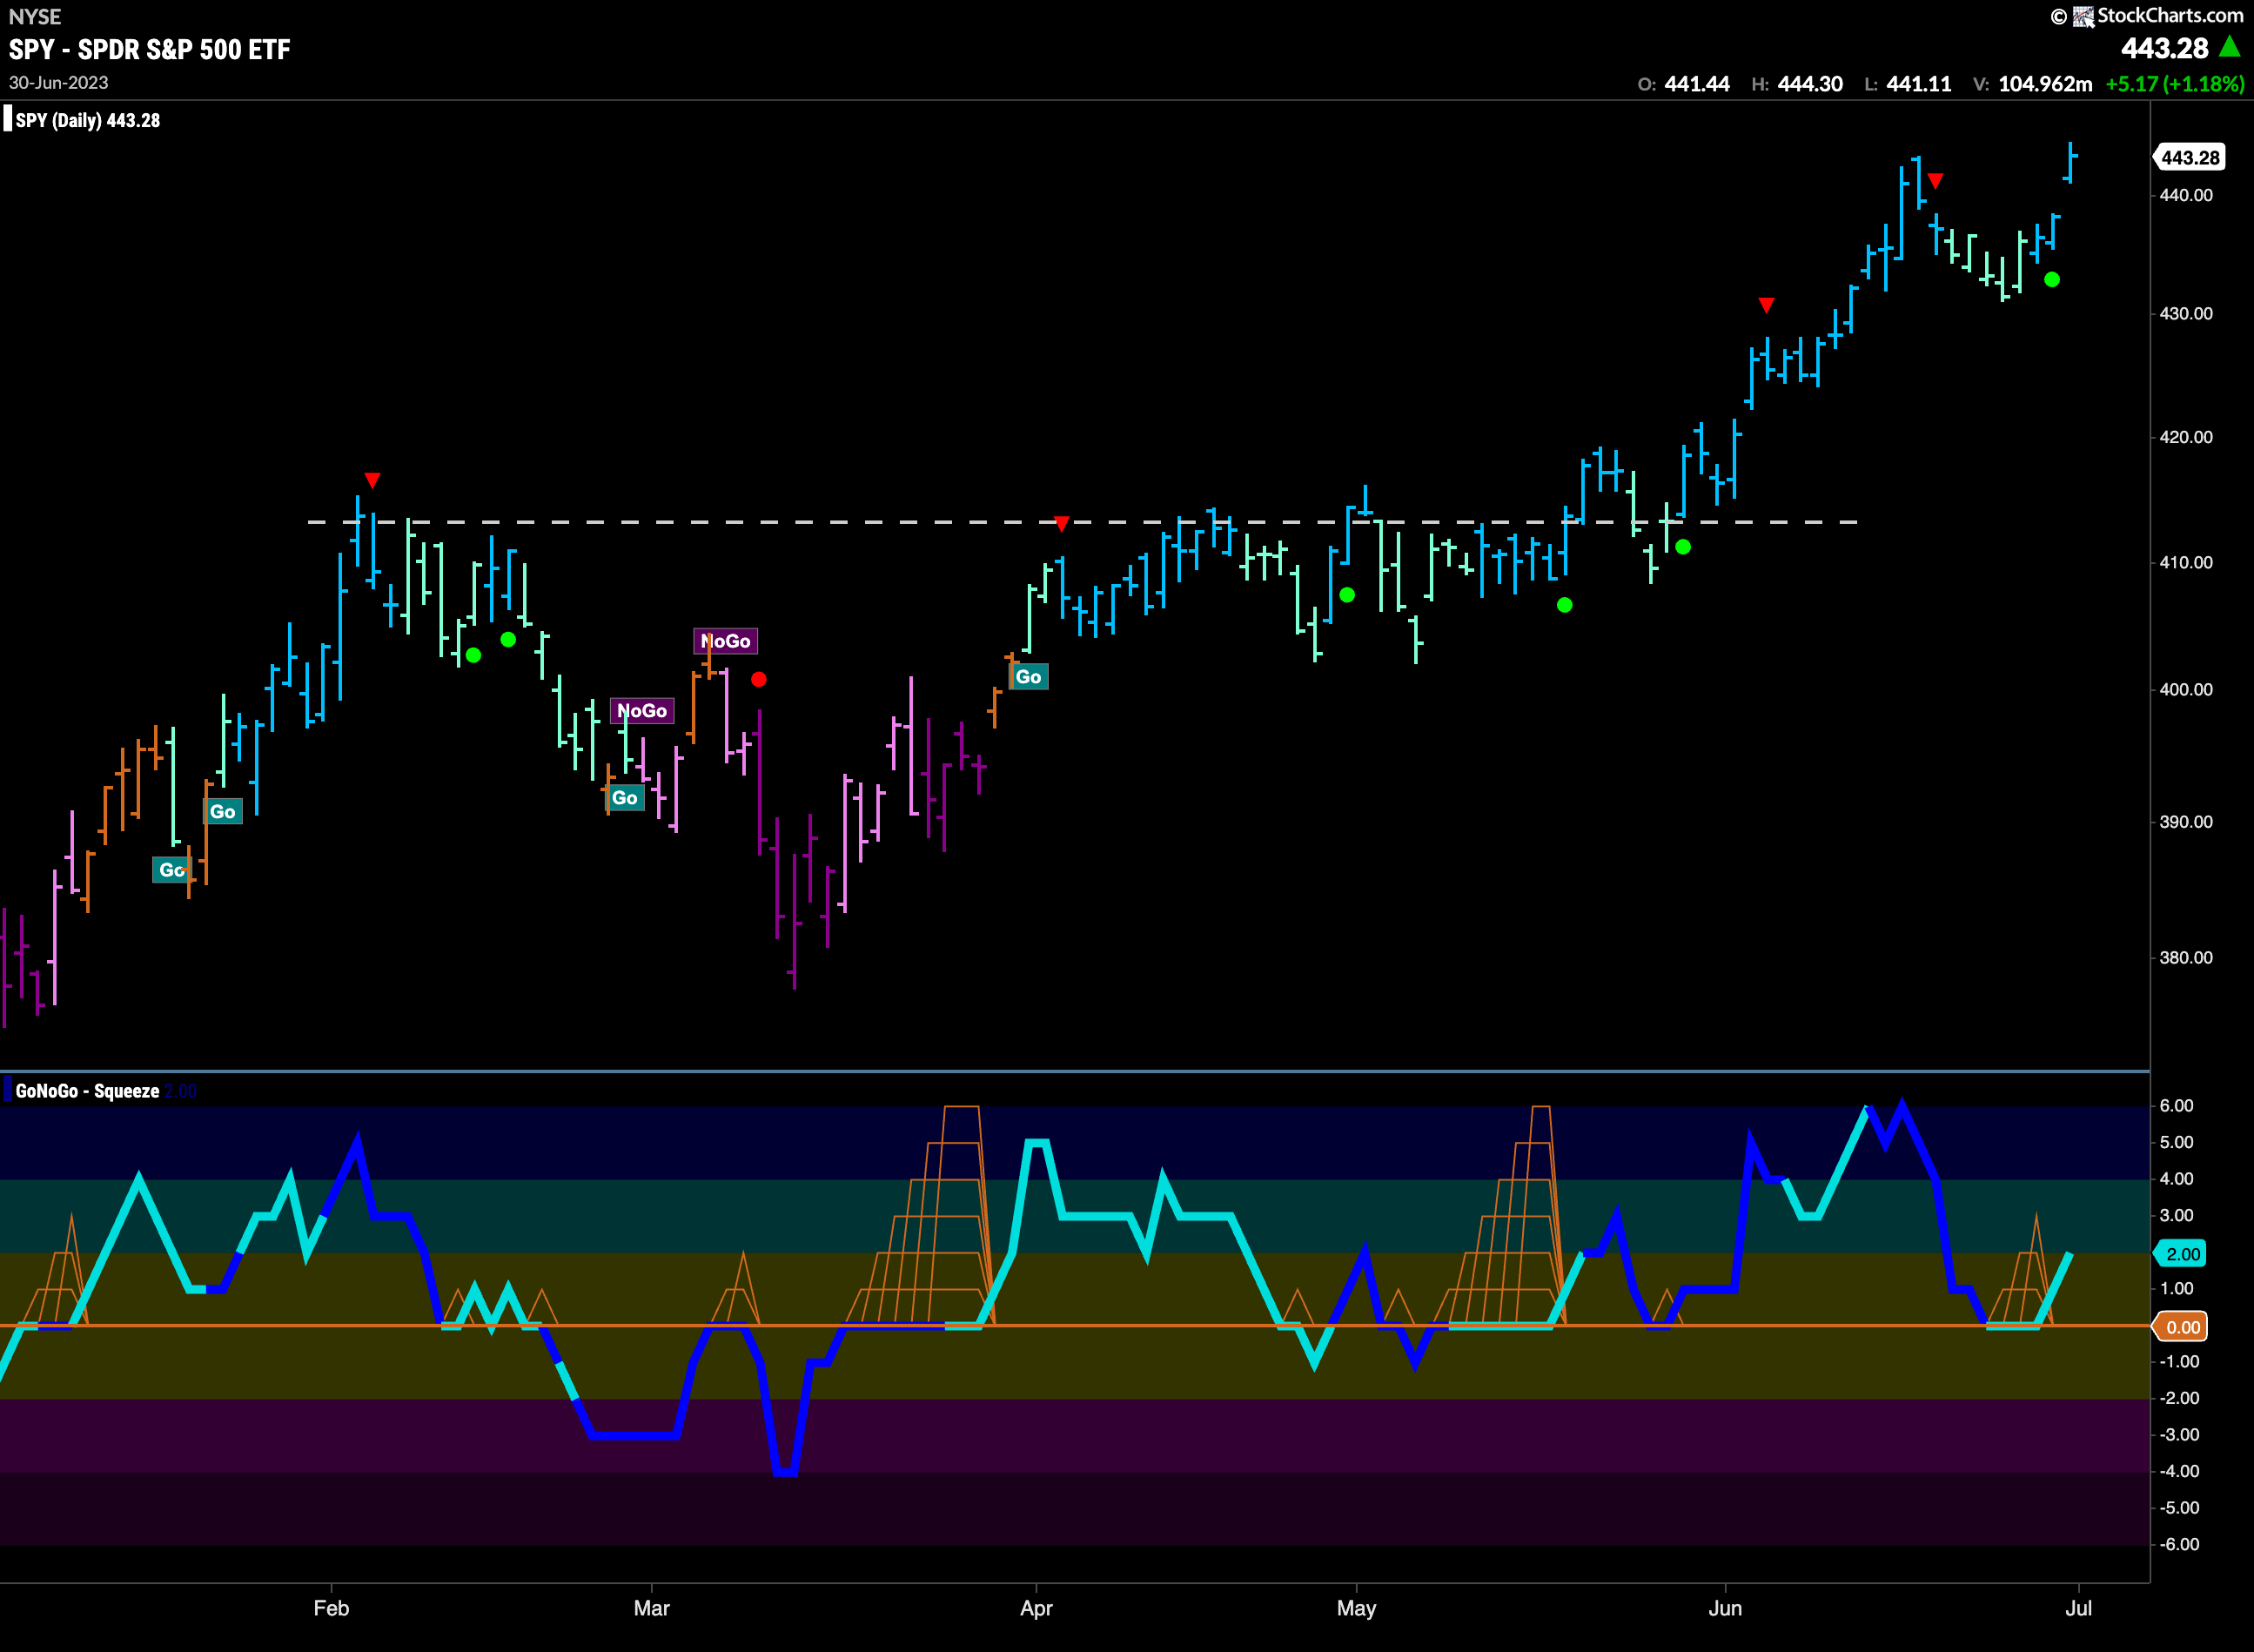
$SPY found the support it was looking for last week. After a correction from the high, identified by a Go Countertrend Correction Icon (red triangle) we saw GoNoGo Trend paint a string of weaker aqua bars as GoNoGo Oscillator fell to test the zero line from above. We saw that the oscillator found support at zero, suggesting that momentum was resurgent in the direction of the “Go” trend. That allowed price to move higher again, painting strong blue “Go” bars as we saw a new high.
The longer term weekly chart shows continued strength. Another strong blue “Go” bar this week as price ends the week higher. We have seen an incredible run of strong blue bars since we saw price break above downward sloping resistance. GoNoGo Oscillator has remained in positive territory finding support at the zero line as we see strong momentum in the direction of the trend. 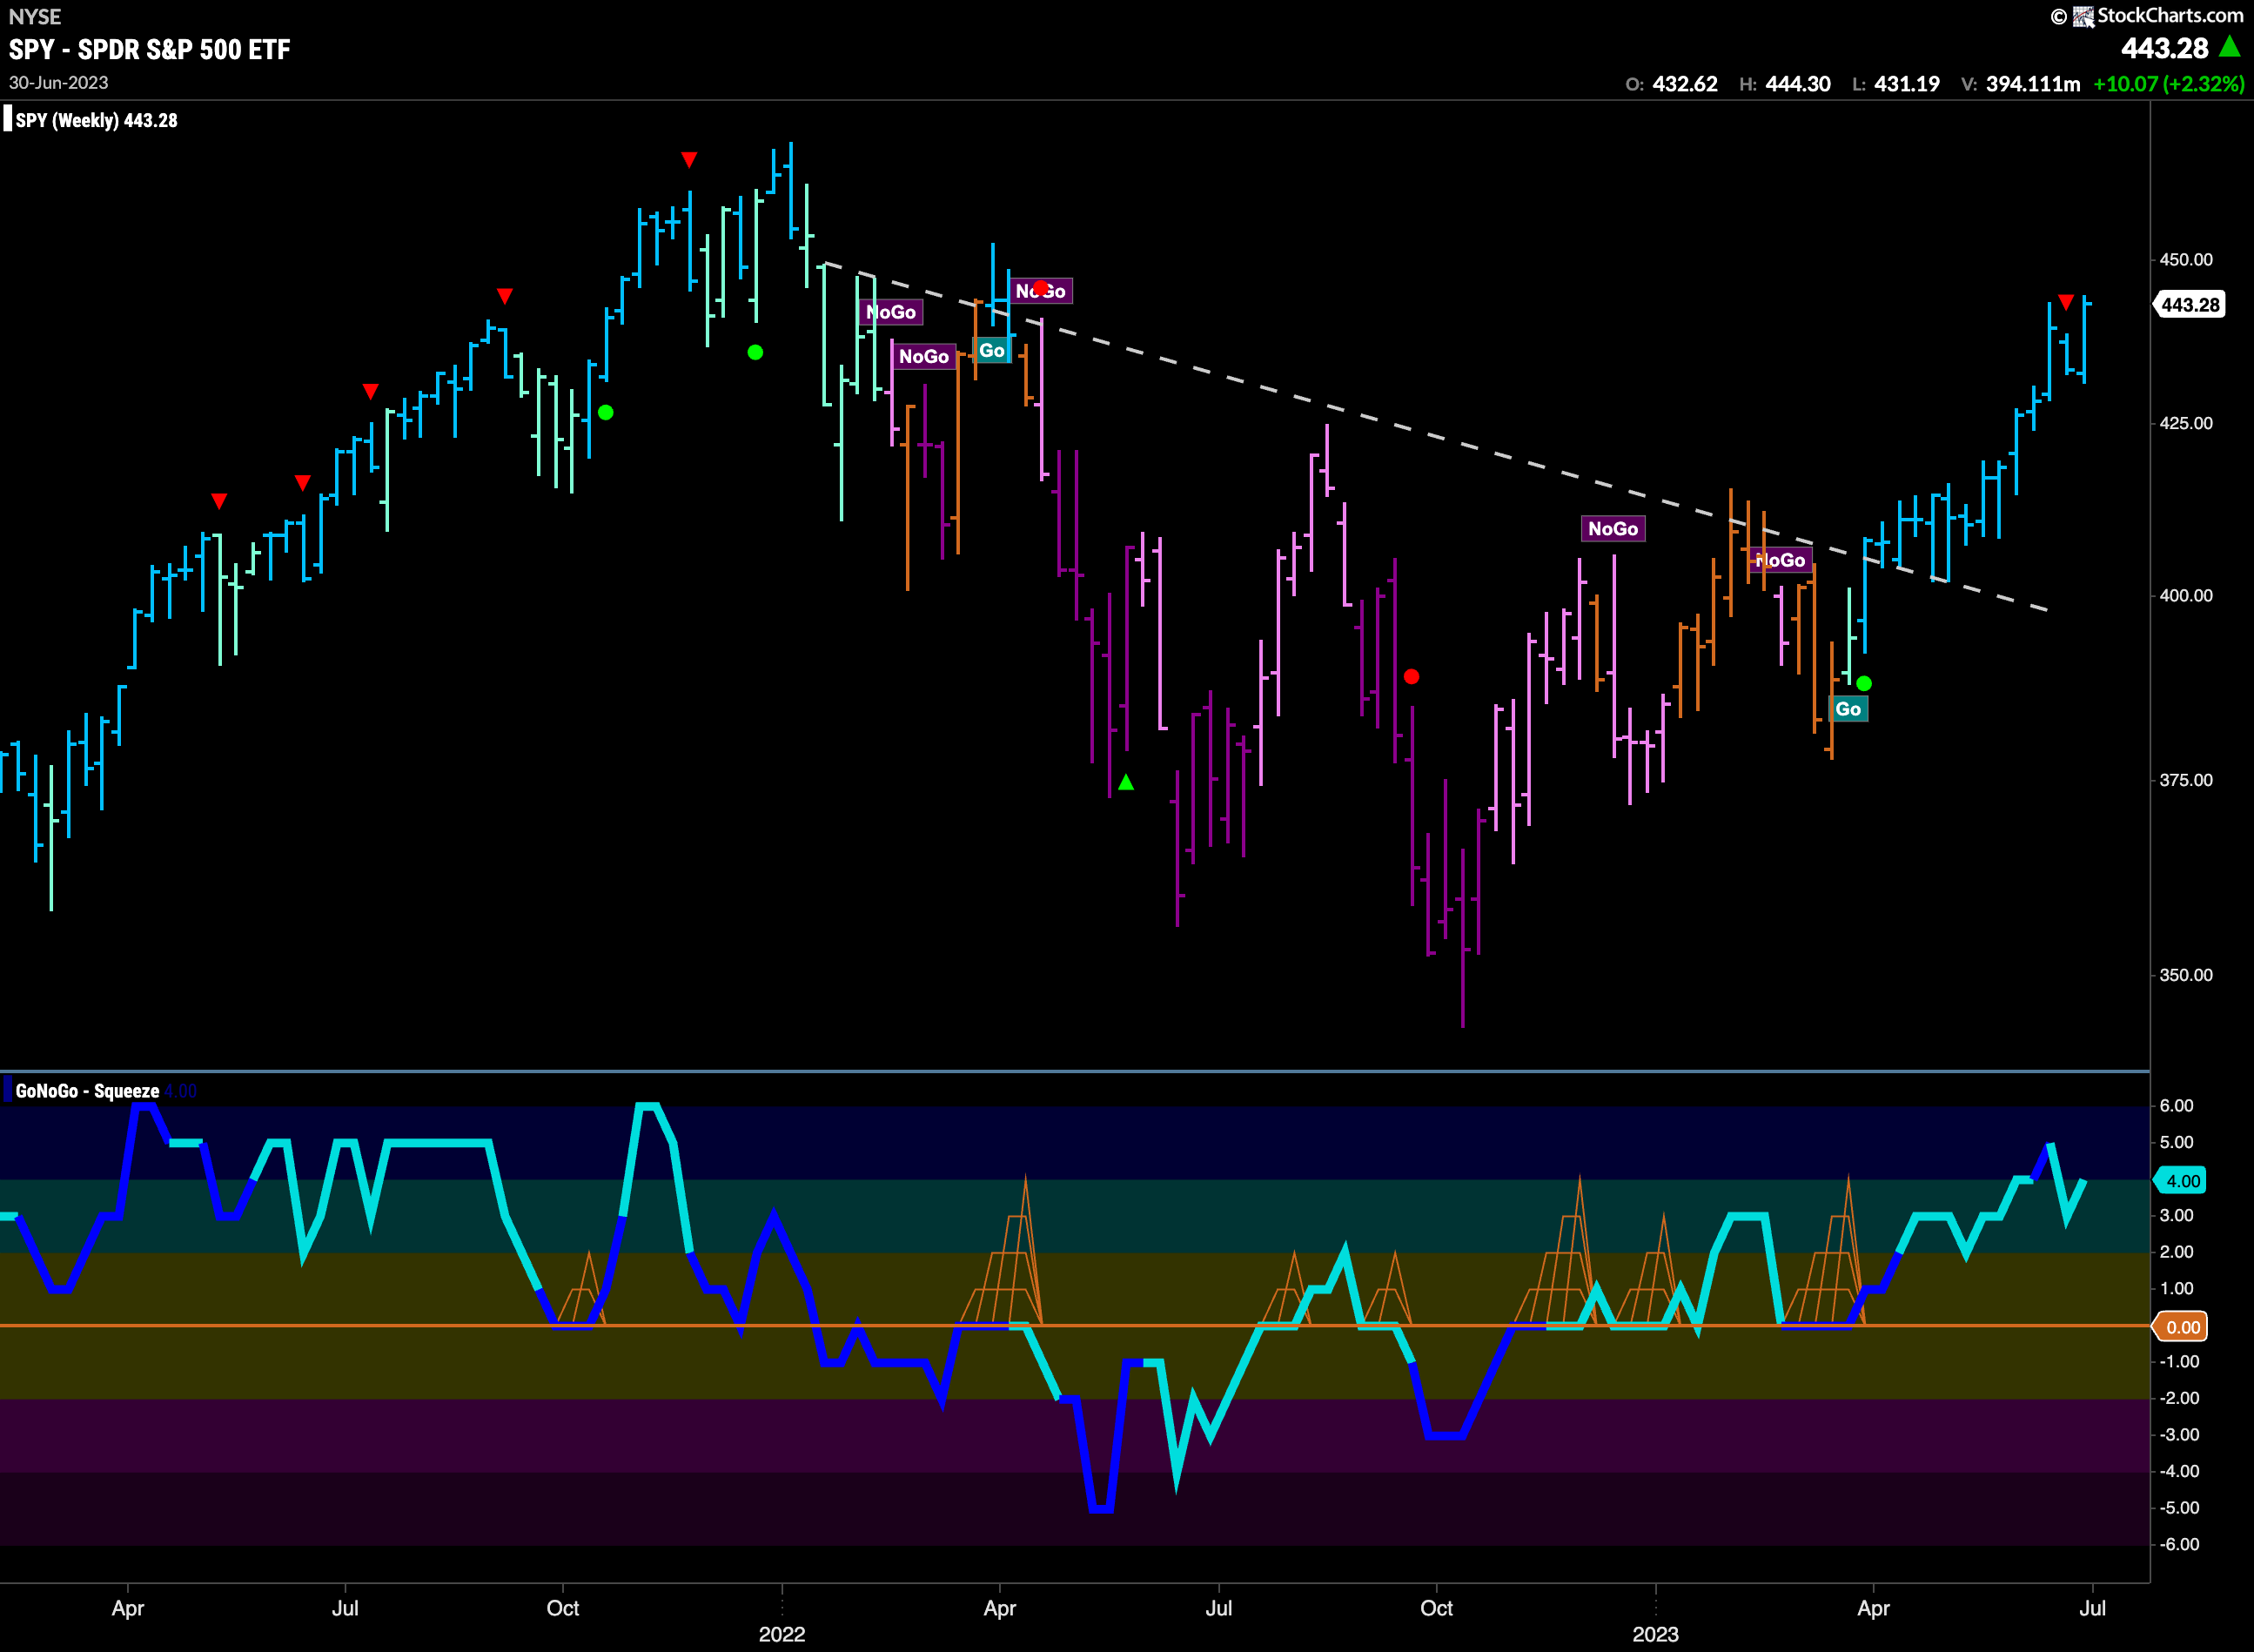
Treasury Bond Rates Remain in “Go” trend
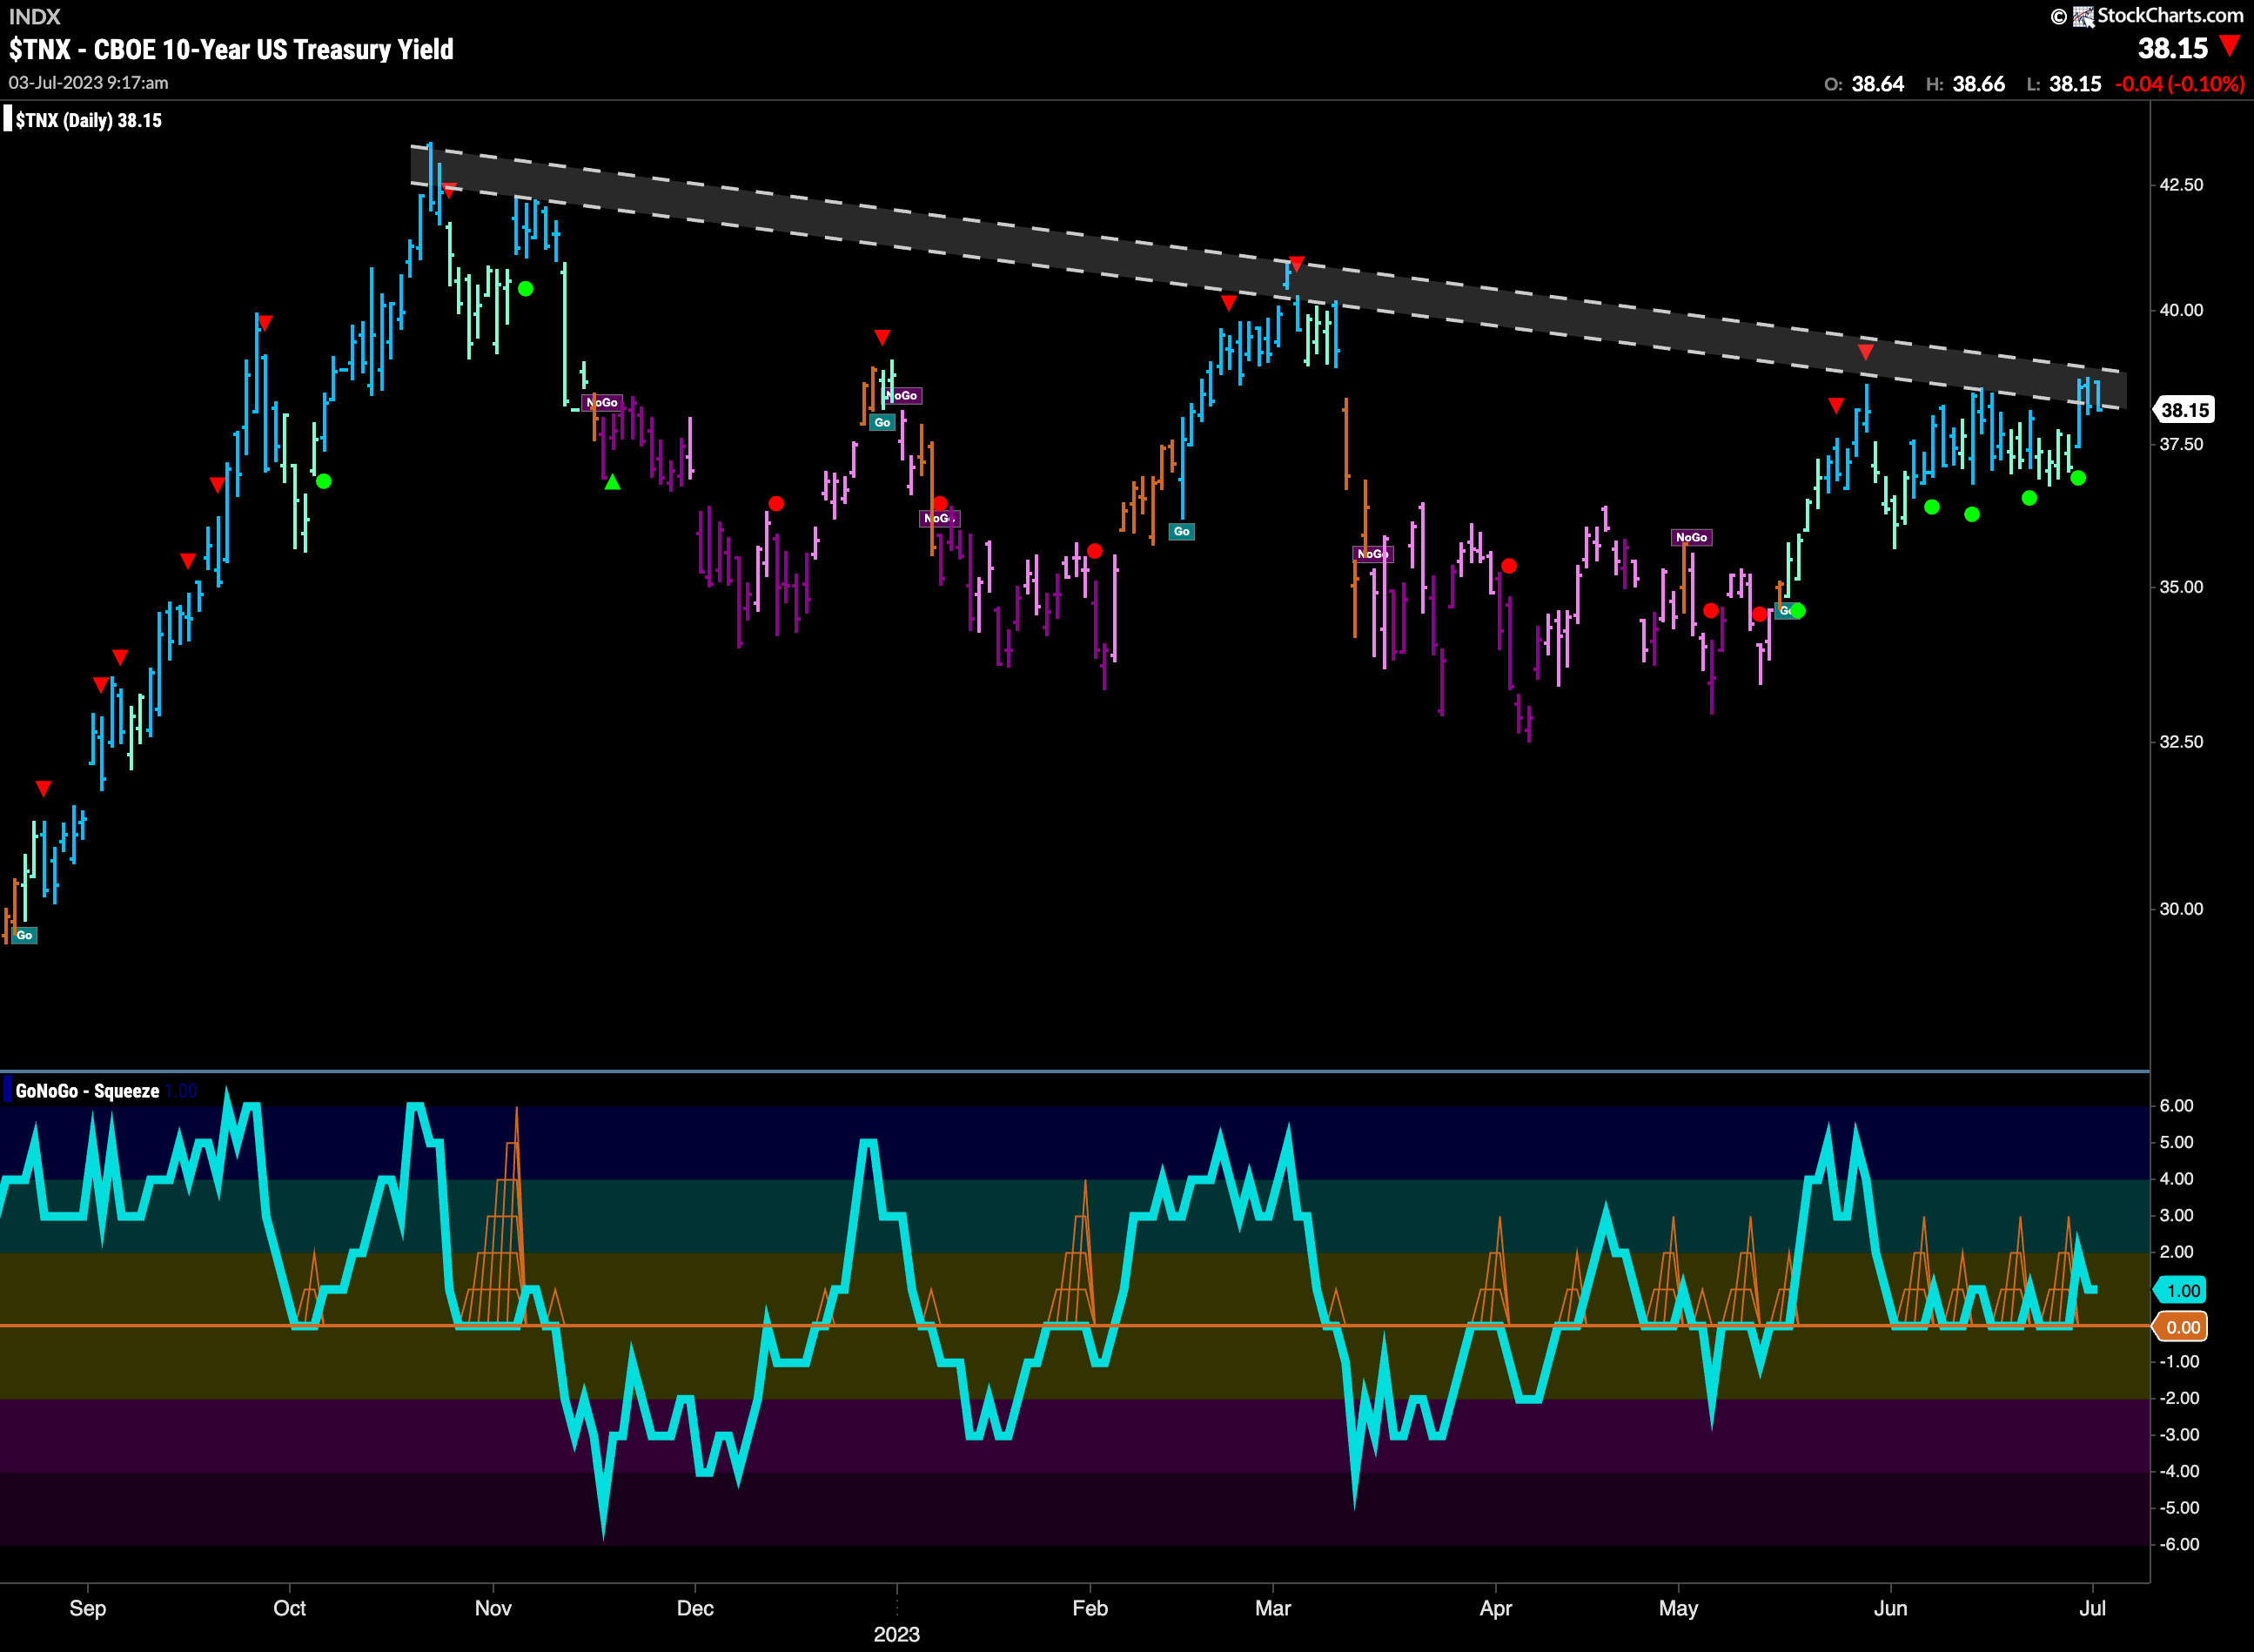
Treasury bond rates remain in the “Go” trend this week and indeed strengthen to end the week. We have seen sideways consolidation for several weeks as GoNoGo Oscillator bounced around on the zero line. We see that as price moved higher at the end of the week it has entered a zone of possible resistance from the downward sloping channel. We will watch closely here to see if price can make any further gains.
Dollar Showing Uncertainty on Weekly Chart
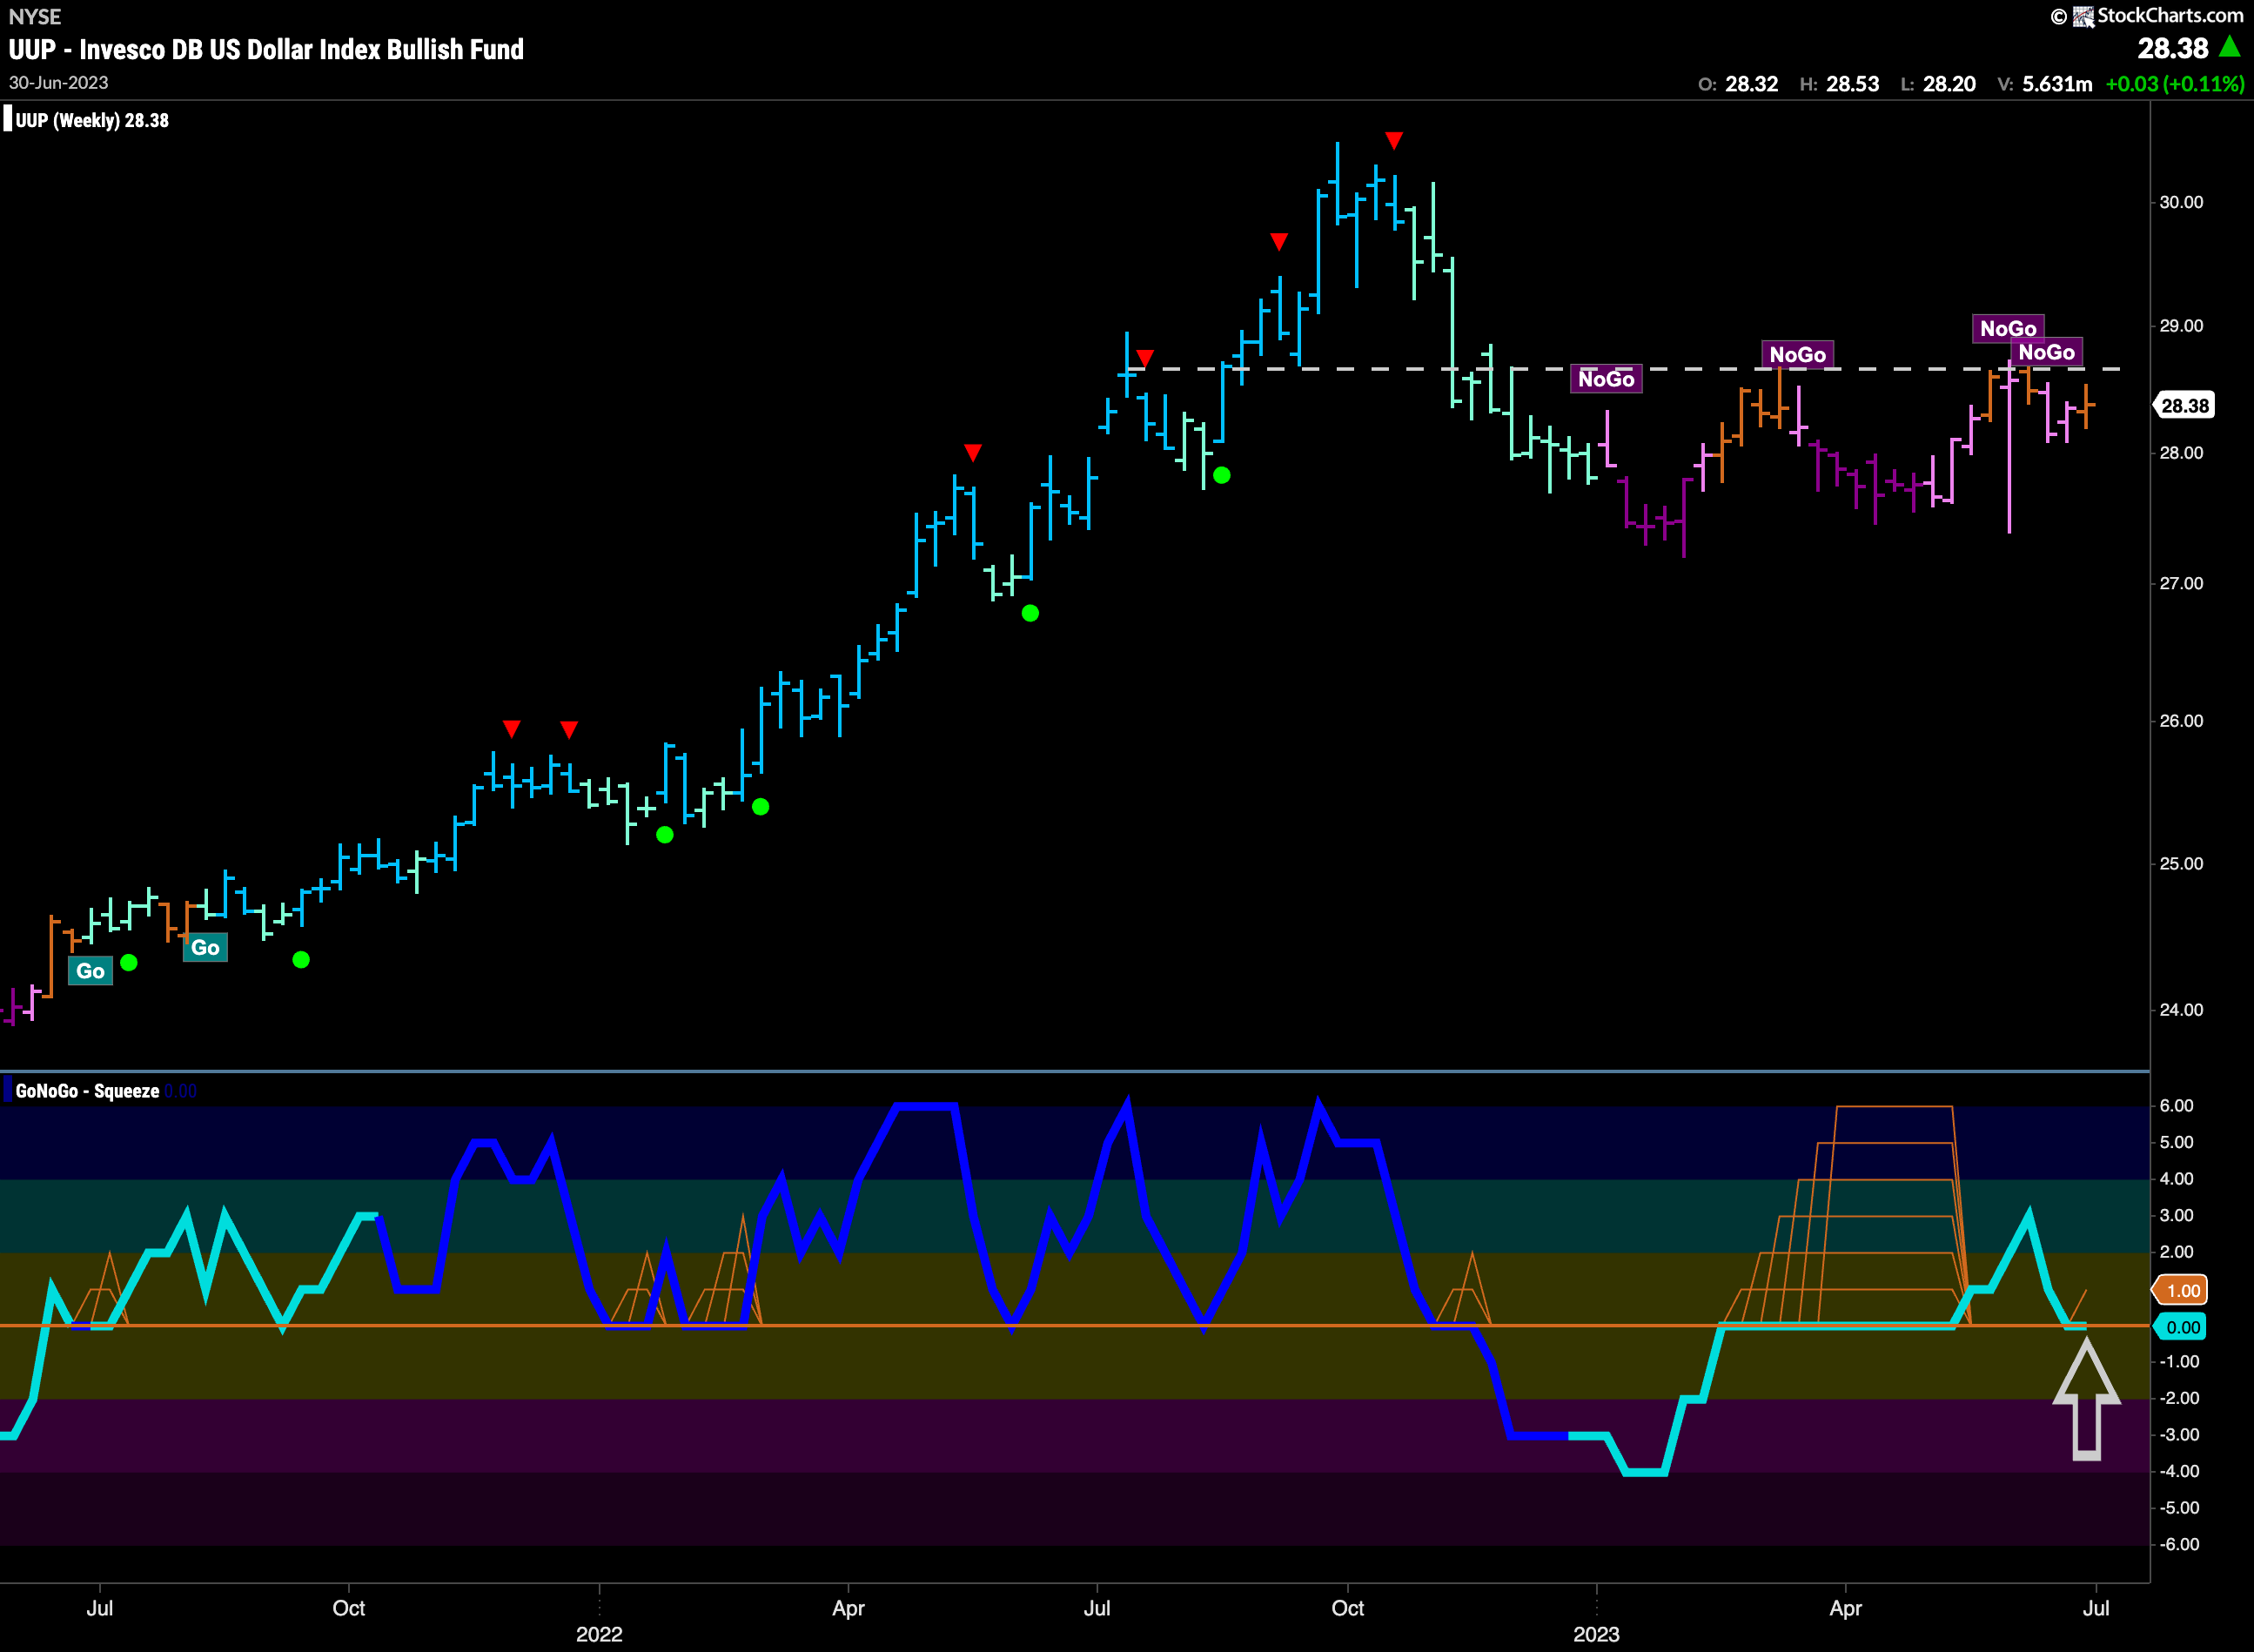
The longer term weekly chart below shows continued uncertainty as another amber “Go Fish” bar threatens the “NoGo” trend. This also comes after we see higher lows but horizontal resistance. GoNoGo Oscillator is testing the zero line from above after breaking out of a Max GoNoGo Squeeze into positive territory. We will watch to see if GoNoGo Oscillator finds support here. If it does, we can suggest that there is positive momentum which could give price the push it needs to make a new high.
Oil – Still Nothing to Report
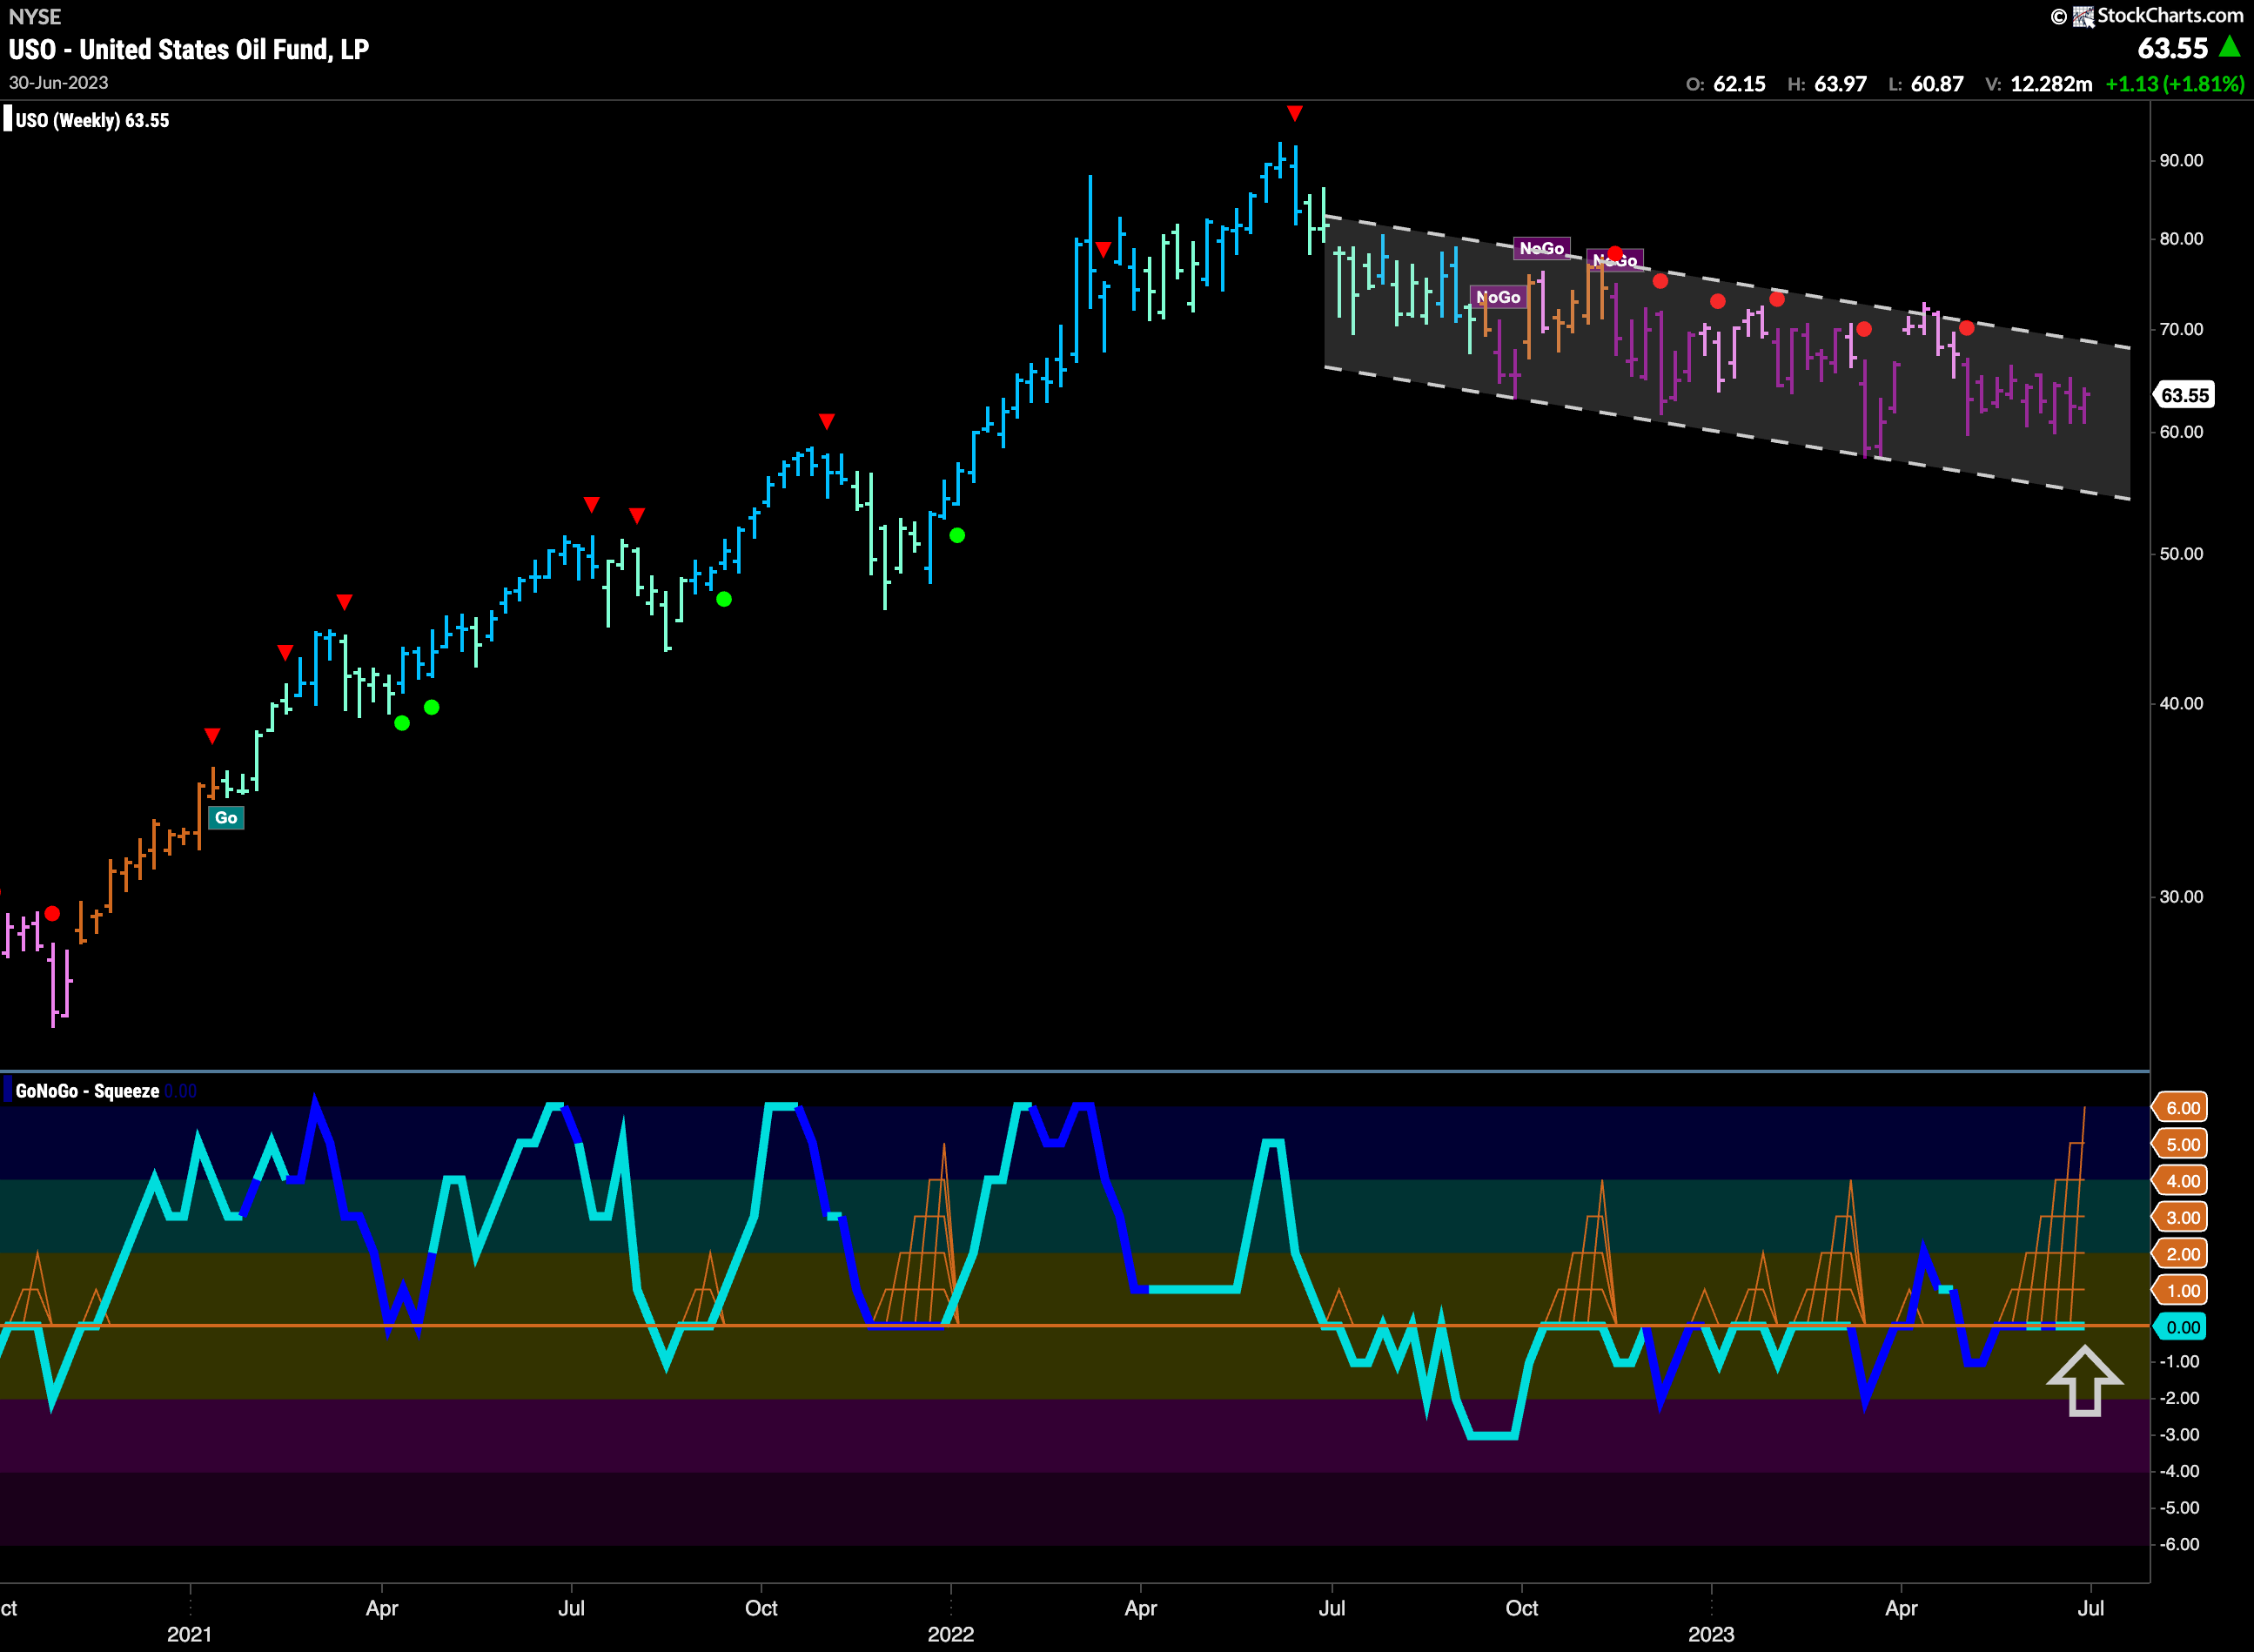
What can we say this week? Oil prices remain stuck in the middle of the downward sloping trend channel as momentum remains neutral. A Max GoNoGo Squeeze is in place. The break of the Squeeze will be important.
Gold Prices Continue to Struggle
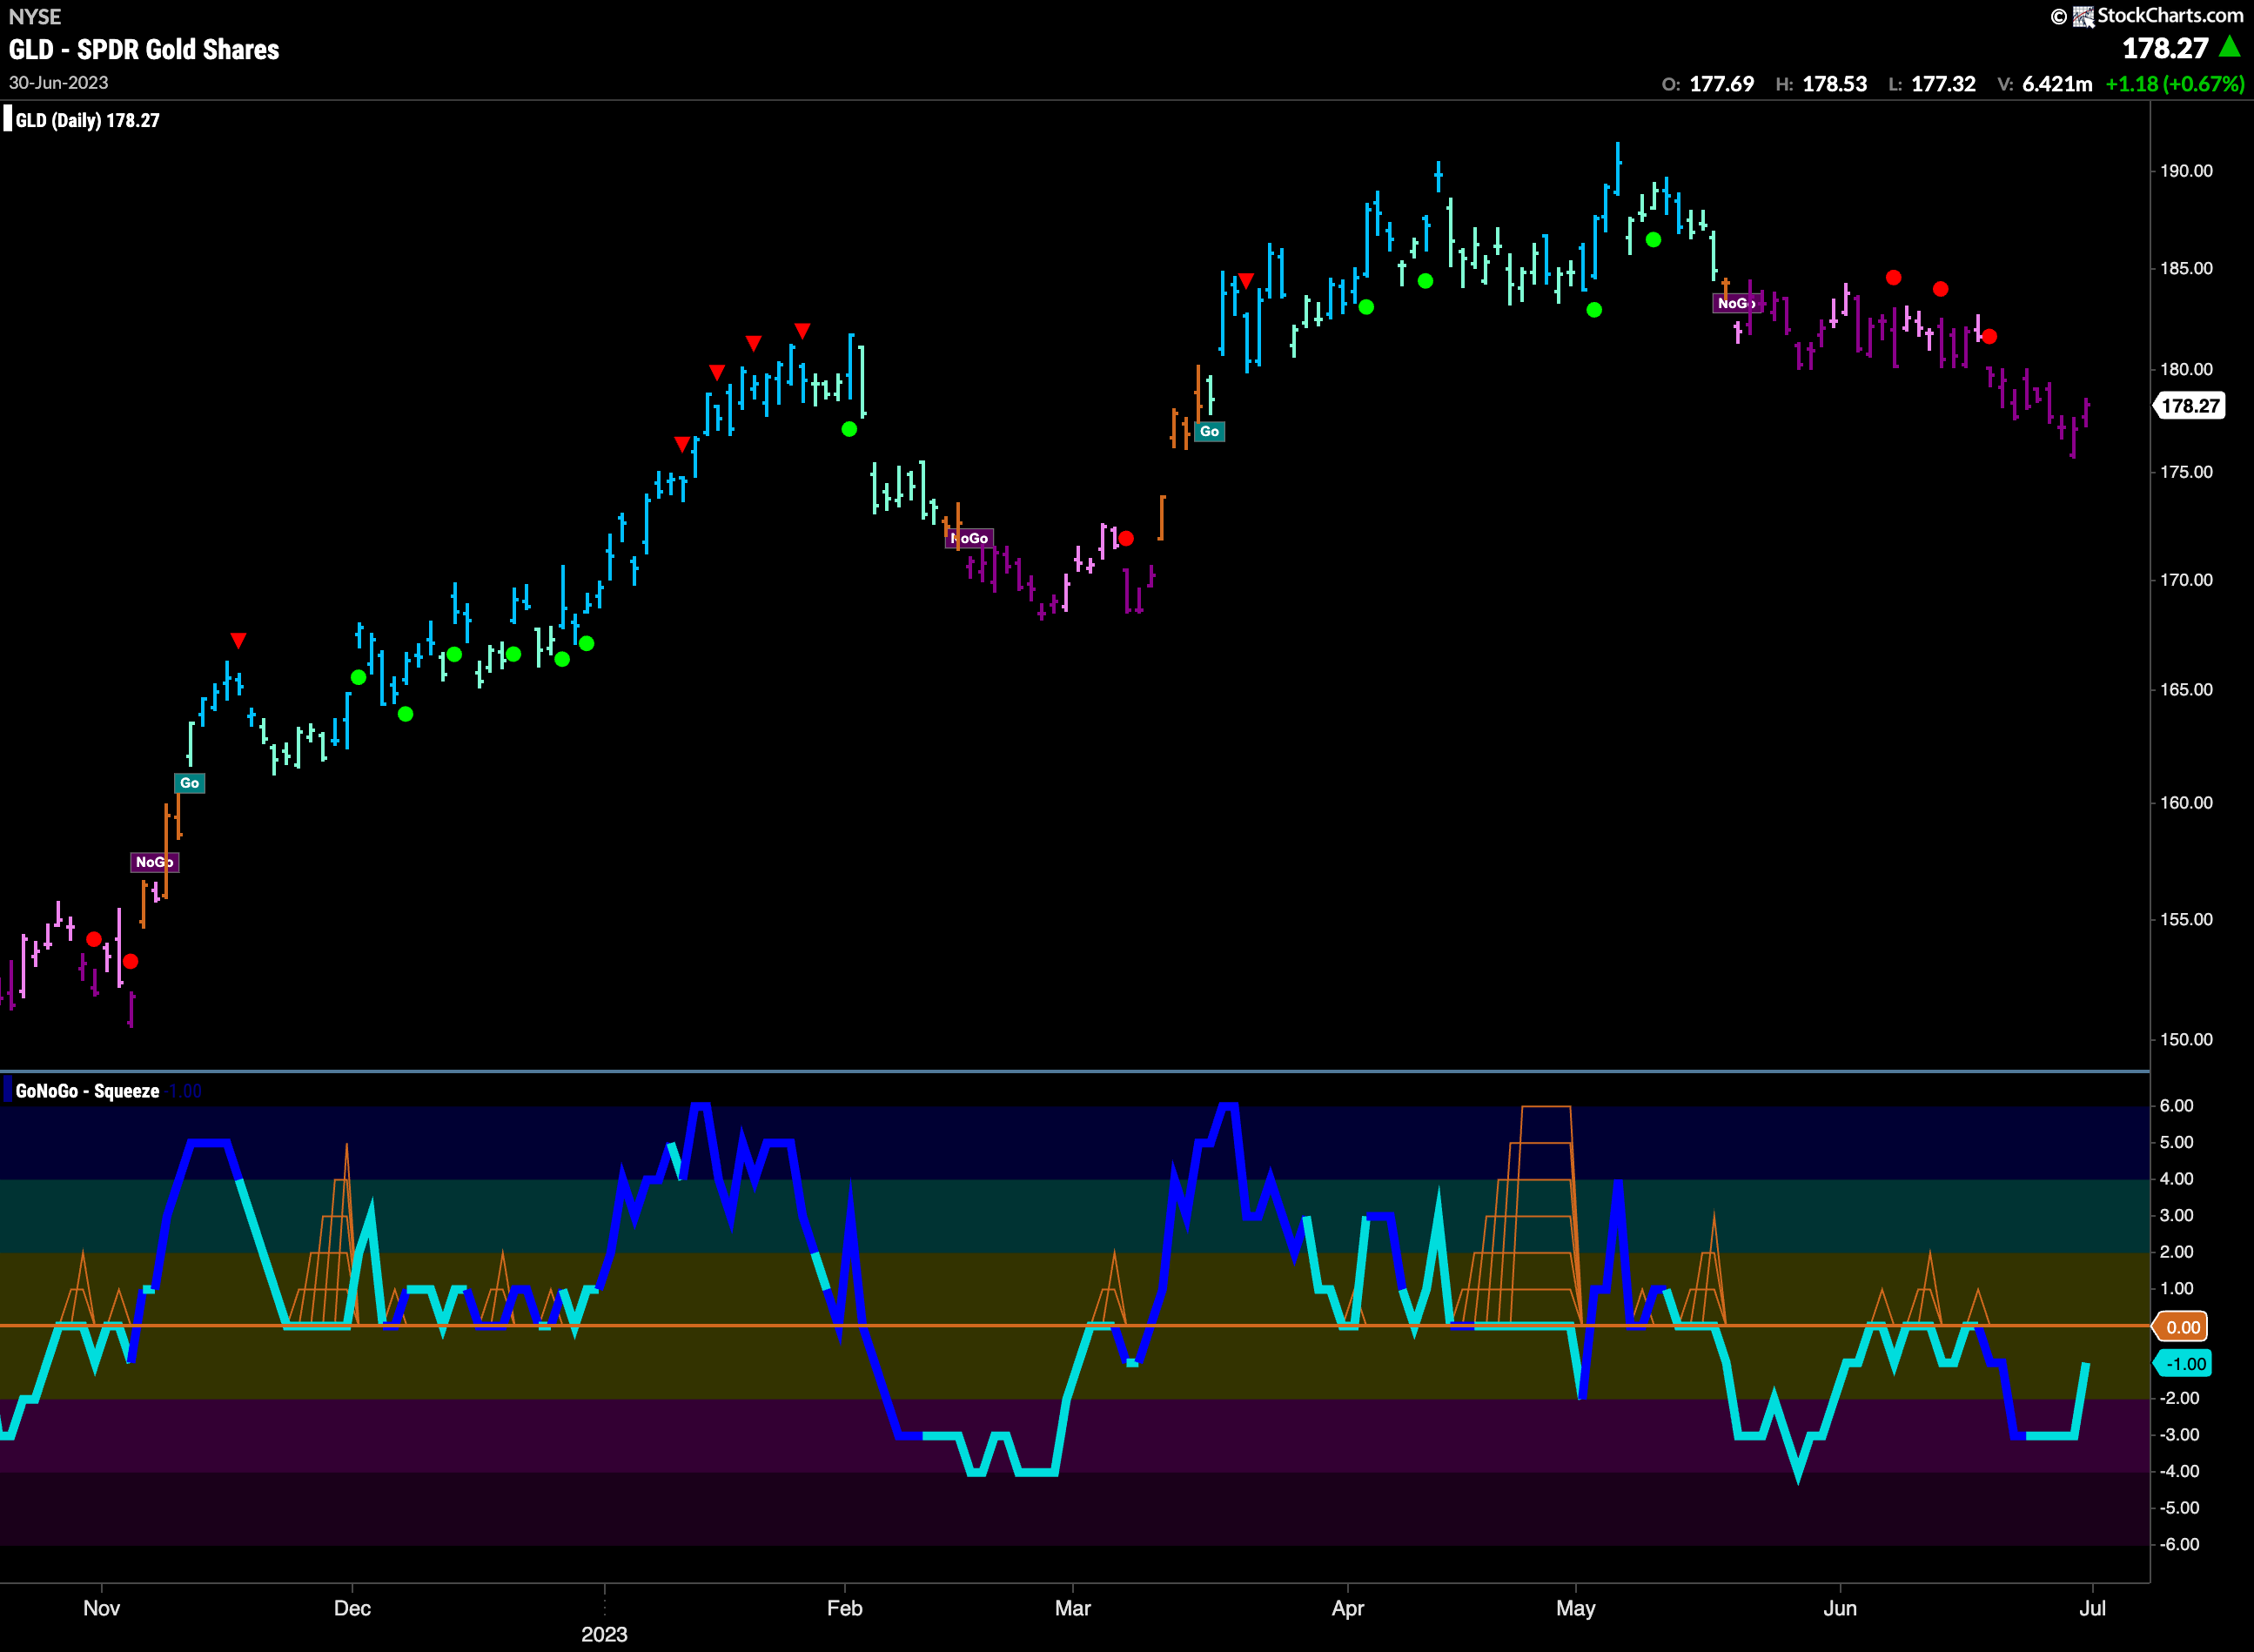
Price is in a “NoGo” trend and and continued to paint nothing but strong purple “NoGo” bars this week. As it hits new lows, we see that GoNoGo Oscillator is in negative territory but rising toward the zero line. As we get closer to this level, we will watch to see if the zero level acts as resistance yet again. It is a bearish picture for the precious metal again this week.
Sector RelMap
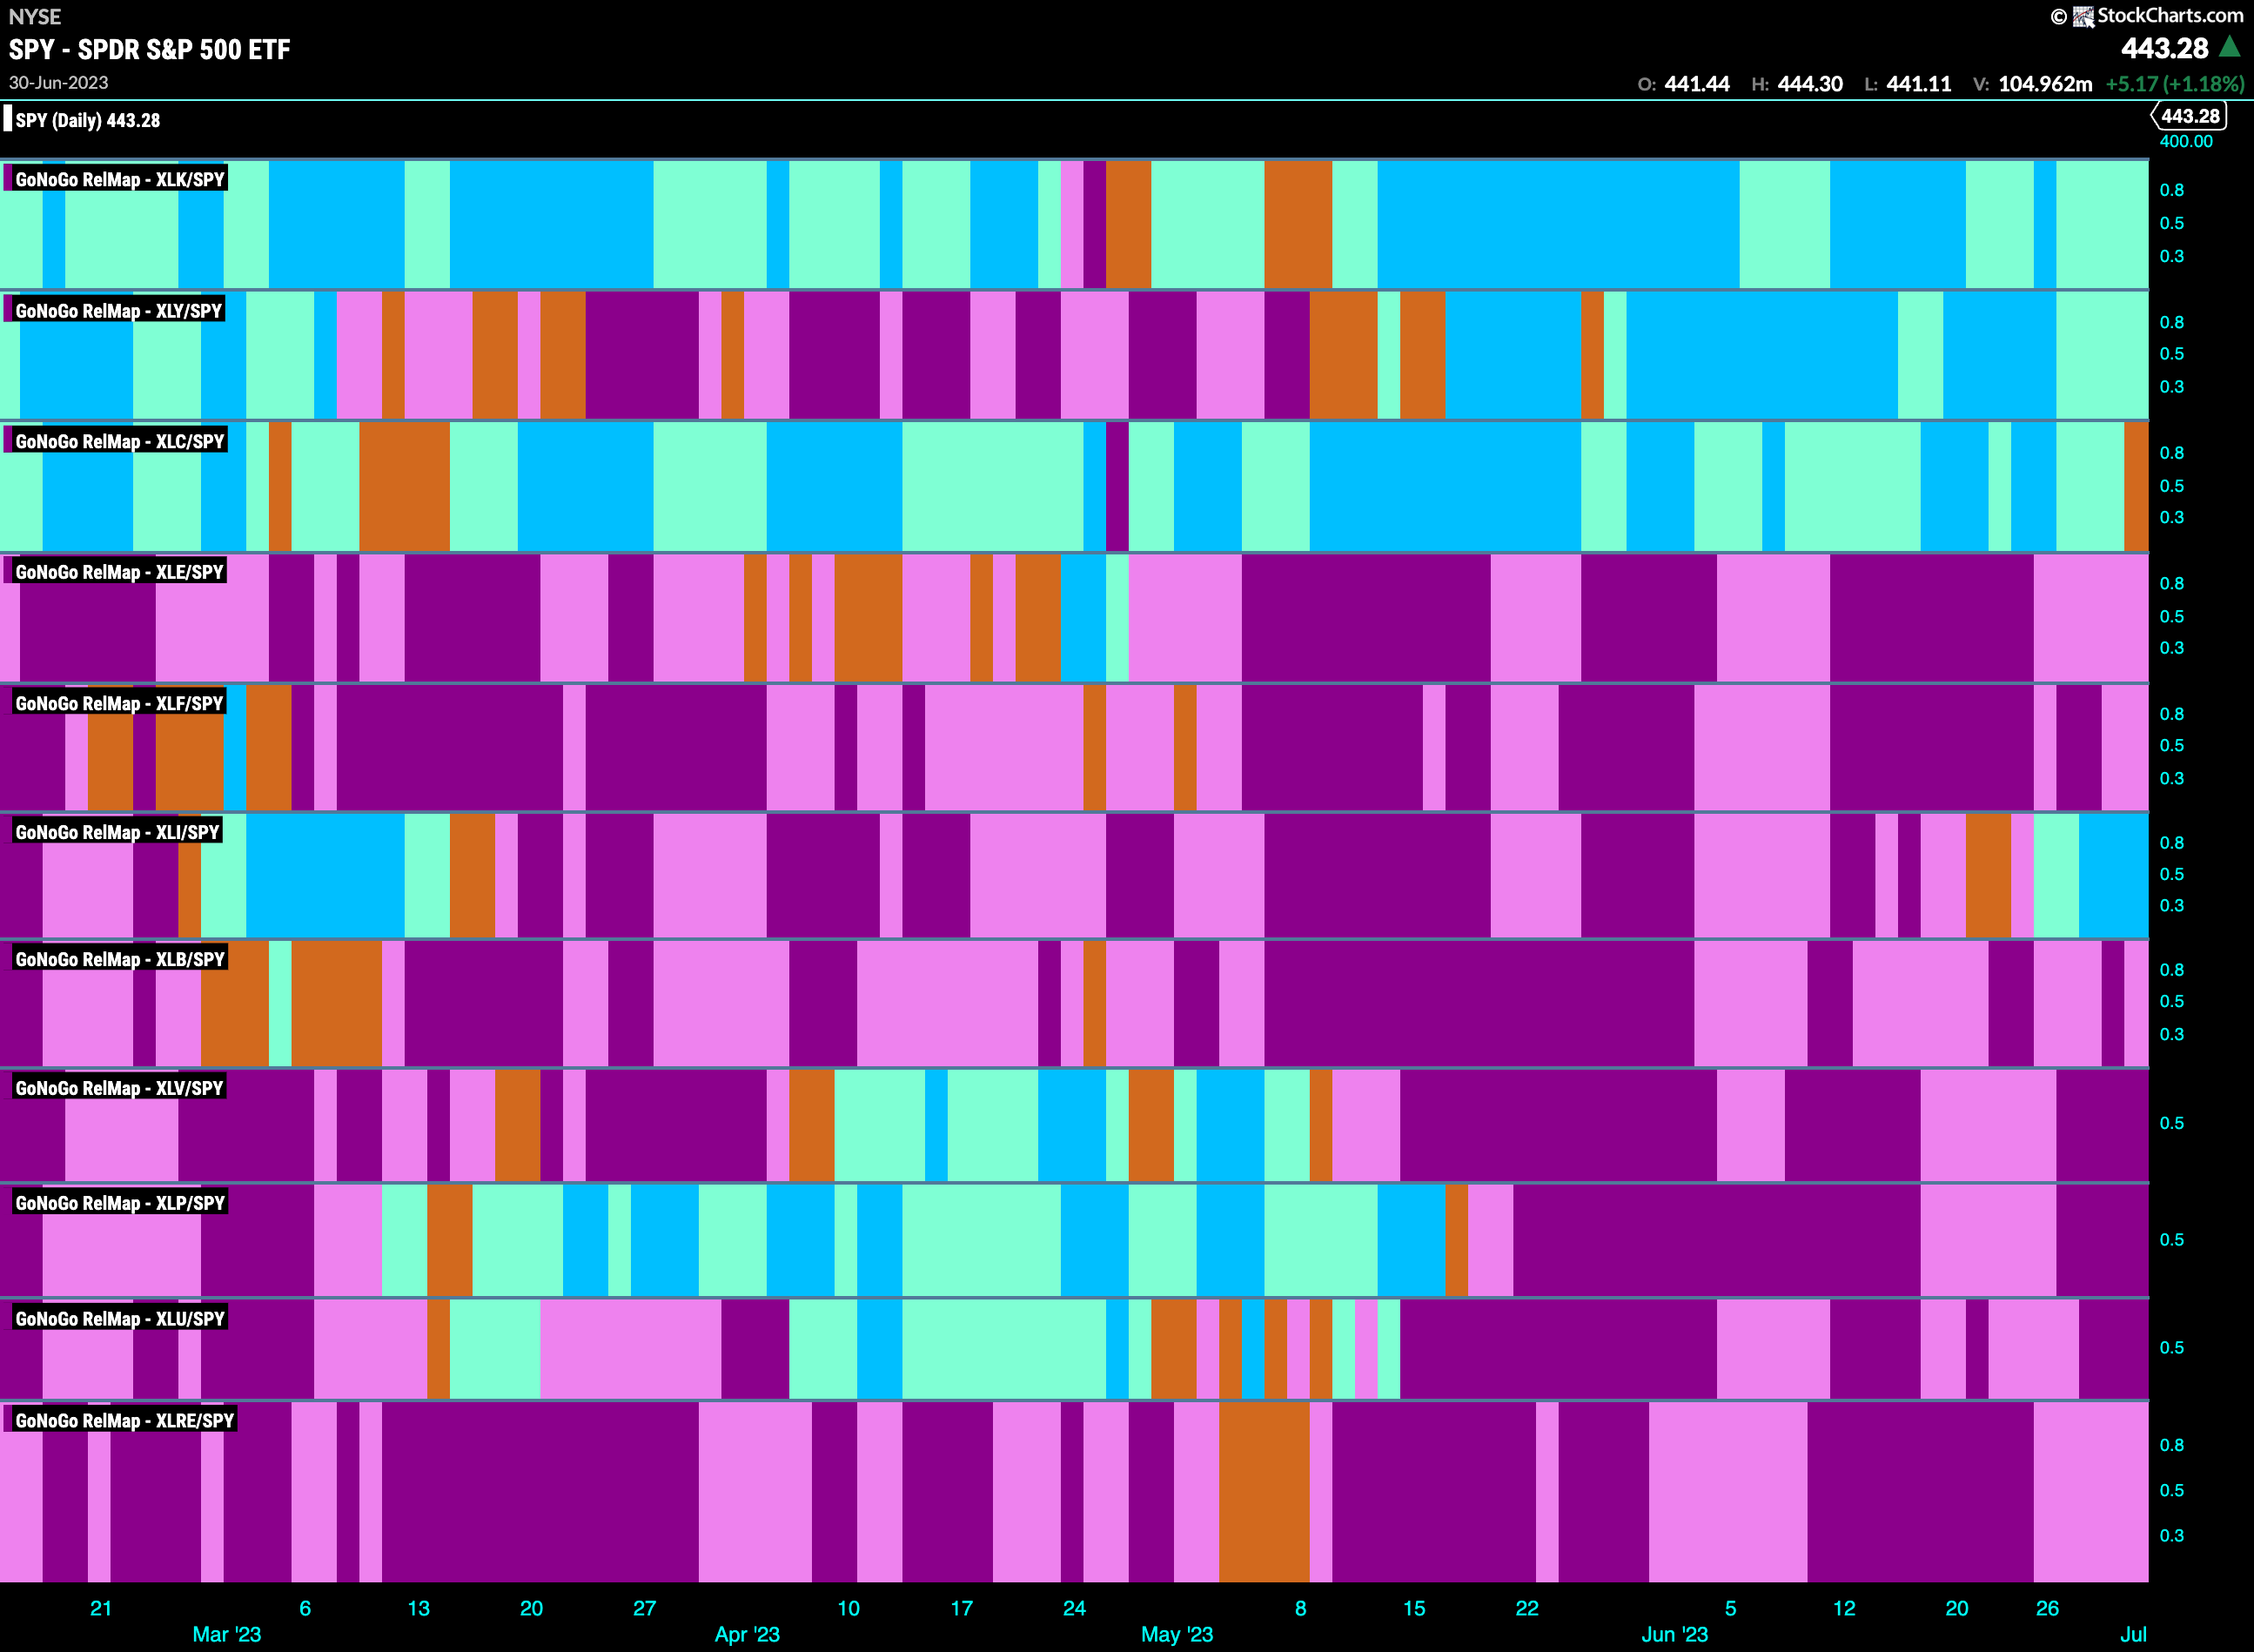
Below is the GoNoGo Sector RelMap. This GoNoGo RelMap applies the GoNoGo Trend to the relative strength ratios of the sectors to the base index. Looking at this map, we can quickly see where the relative outperformance is coming from as well as which sectors are lagging on a relative basis. 3 sectors are outperforming the base index this week. $XLK, $XLY, and $XLI are painting “Go” bars. $XLC has painted an amber “Go Fish” bar.
Industrials Getting Industrious
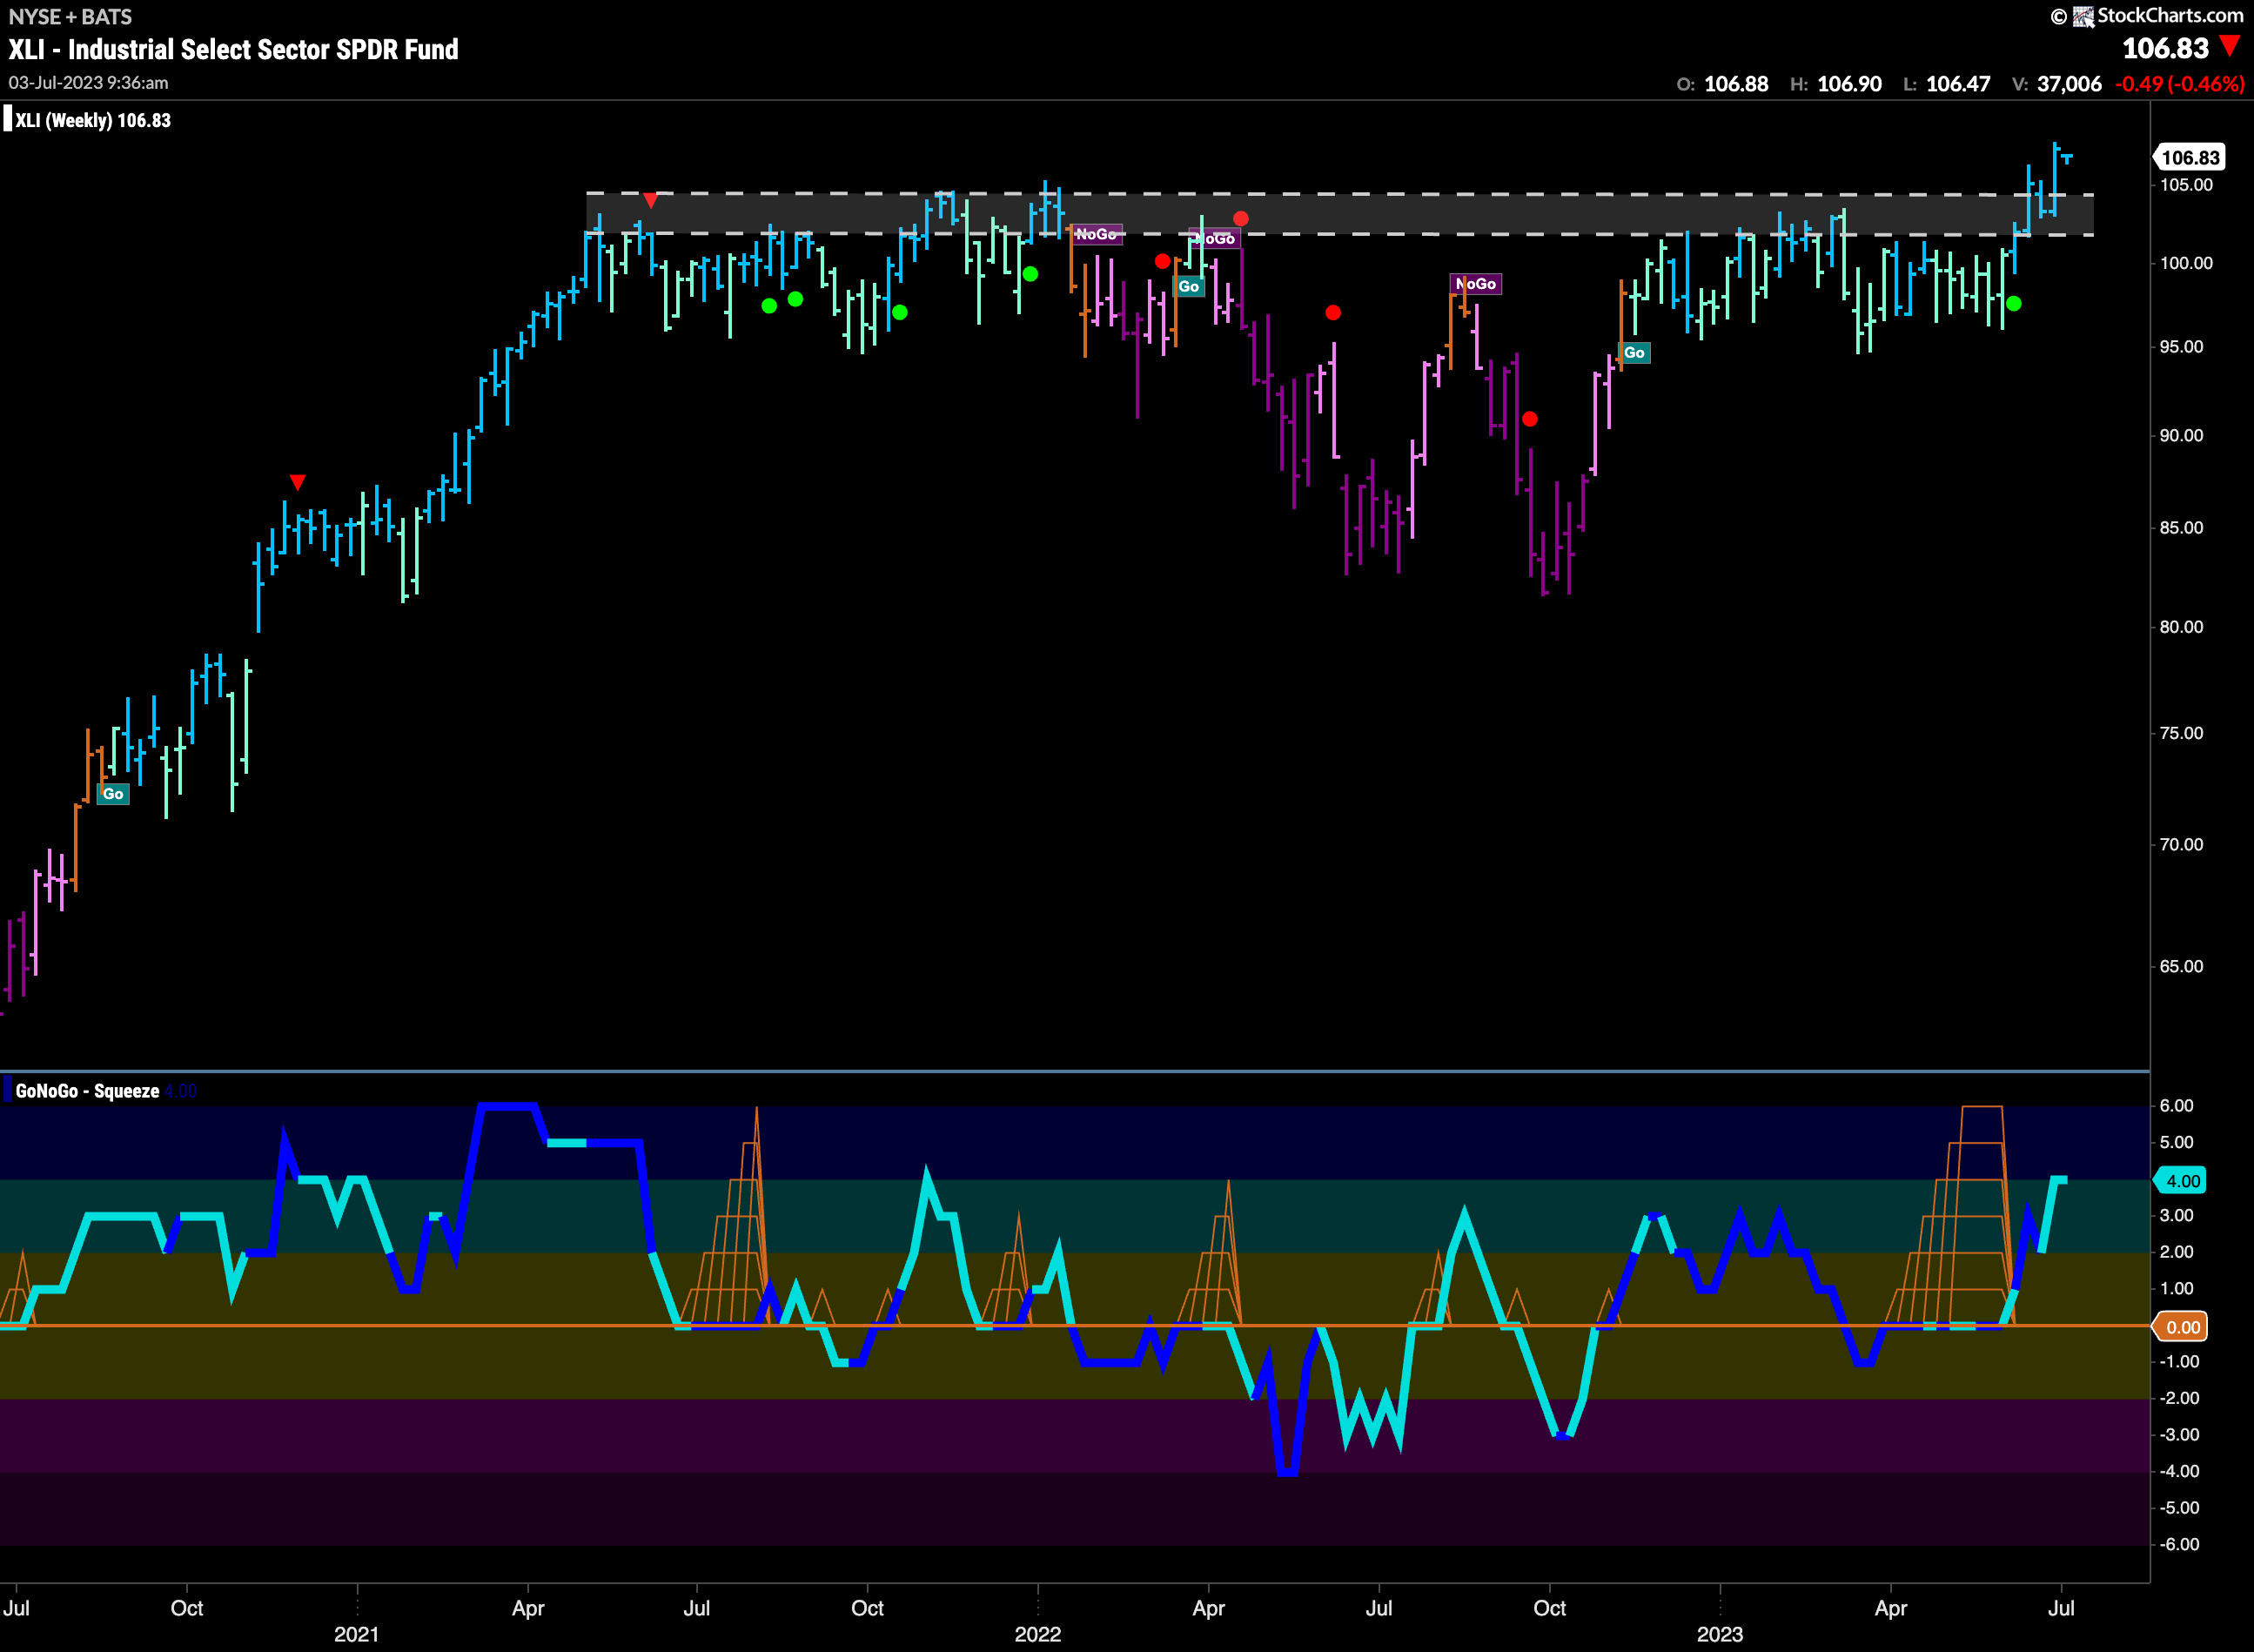
The weekly chart of $XLI shows that the industrials sector is putting in the work it needs to extend the “Go” trend. Price has broken out of the overhead resistance that we see on the chart. Price surged higher as GoNoGo Oscillator broke out of a Max GoNoGo Squeeze and this told us that momentum was resurgent in the direction of the “Go” trend. This seemed to push price higher. We will watch to see if price can consolidate at these levels making a foundation for further gains to build upon.
Relative Strength of Industrials Groups
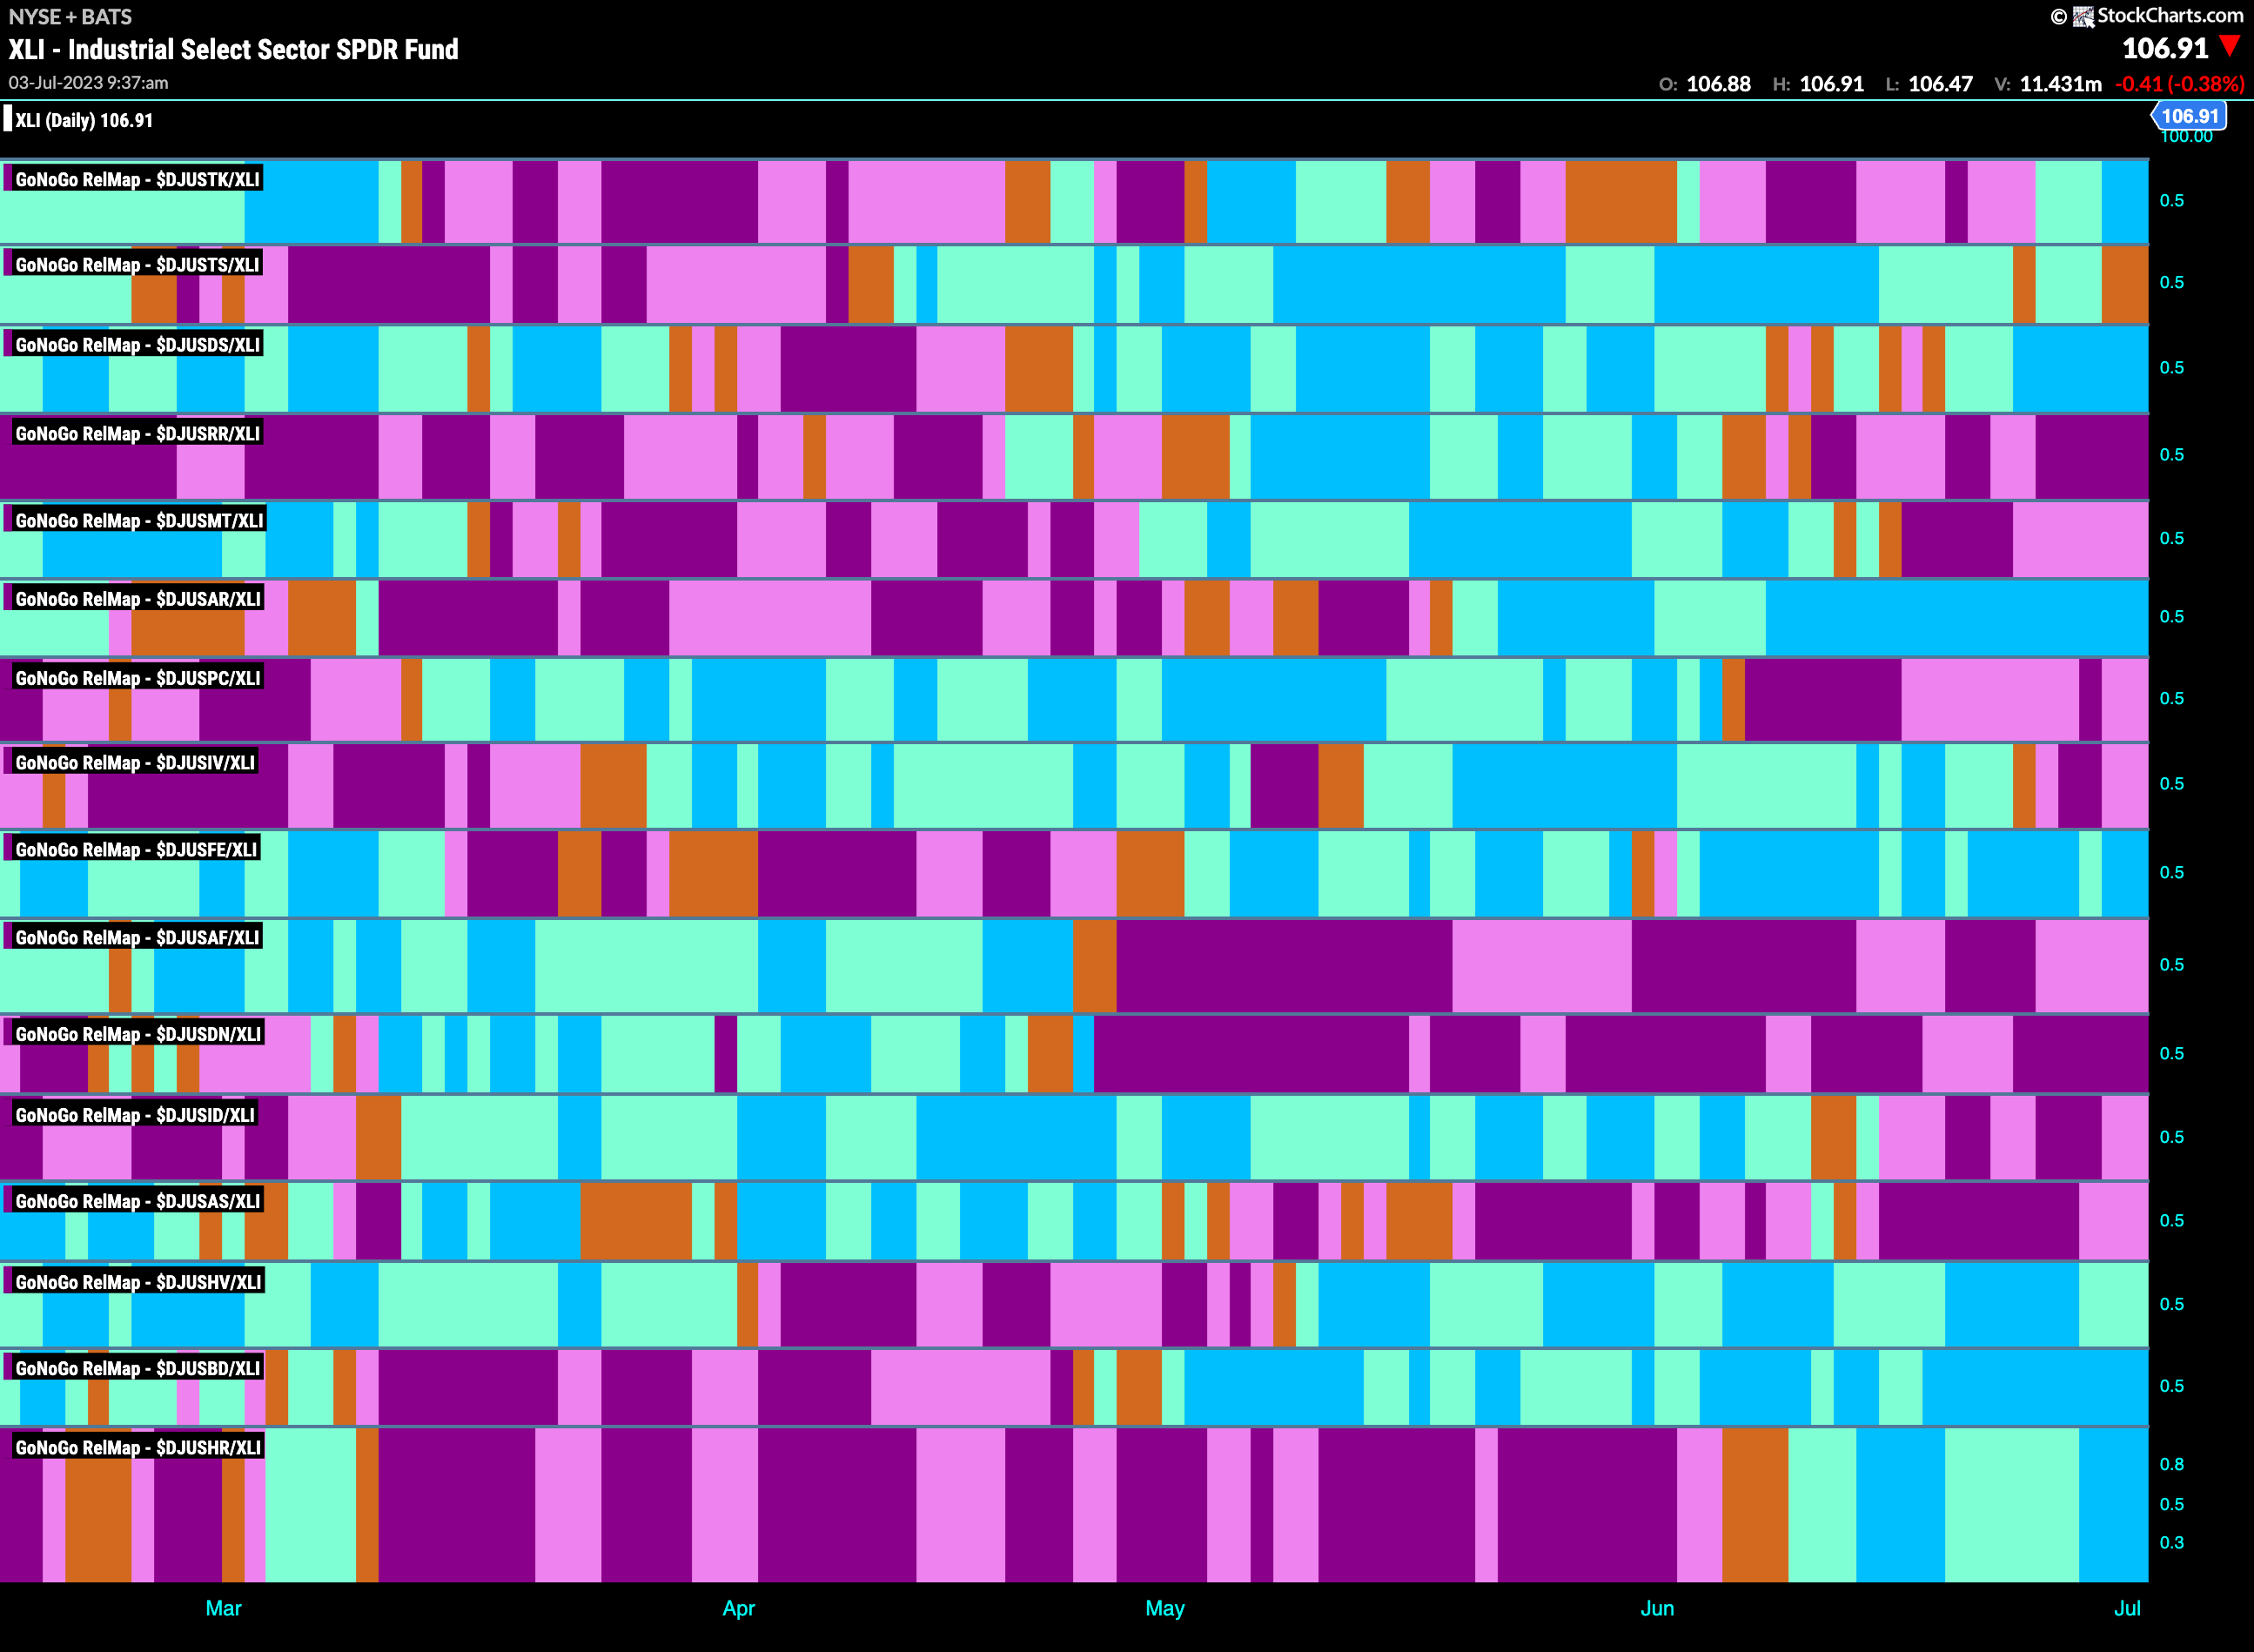
The RelMap below allows us to look for relative strength within the industrials sector. We have seen the strength of Industrials, and so looking at a chart like the one below shows us what is driving the outperformance. We can see that there are several industry groups that are in relative “Go” trends. The sixth panel below shows the relative trend of the airlines sub group to industrials. We can see that it has had an incredible run of uninterrupted strong blue “Go” bars.
SkyWest, Inc Shows Sky High “Go” Trend
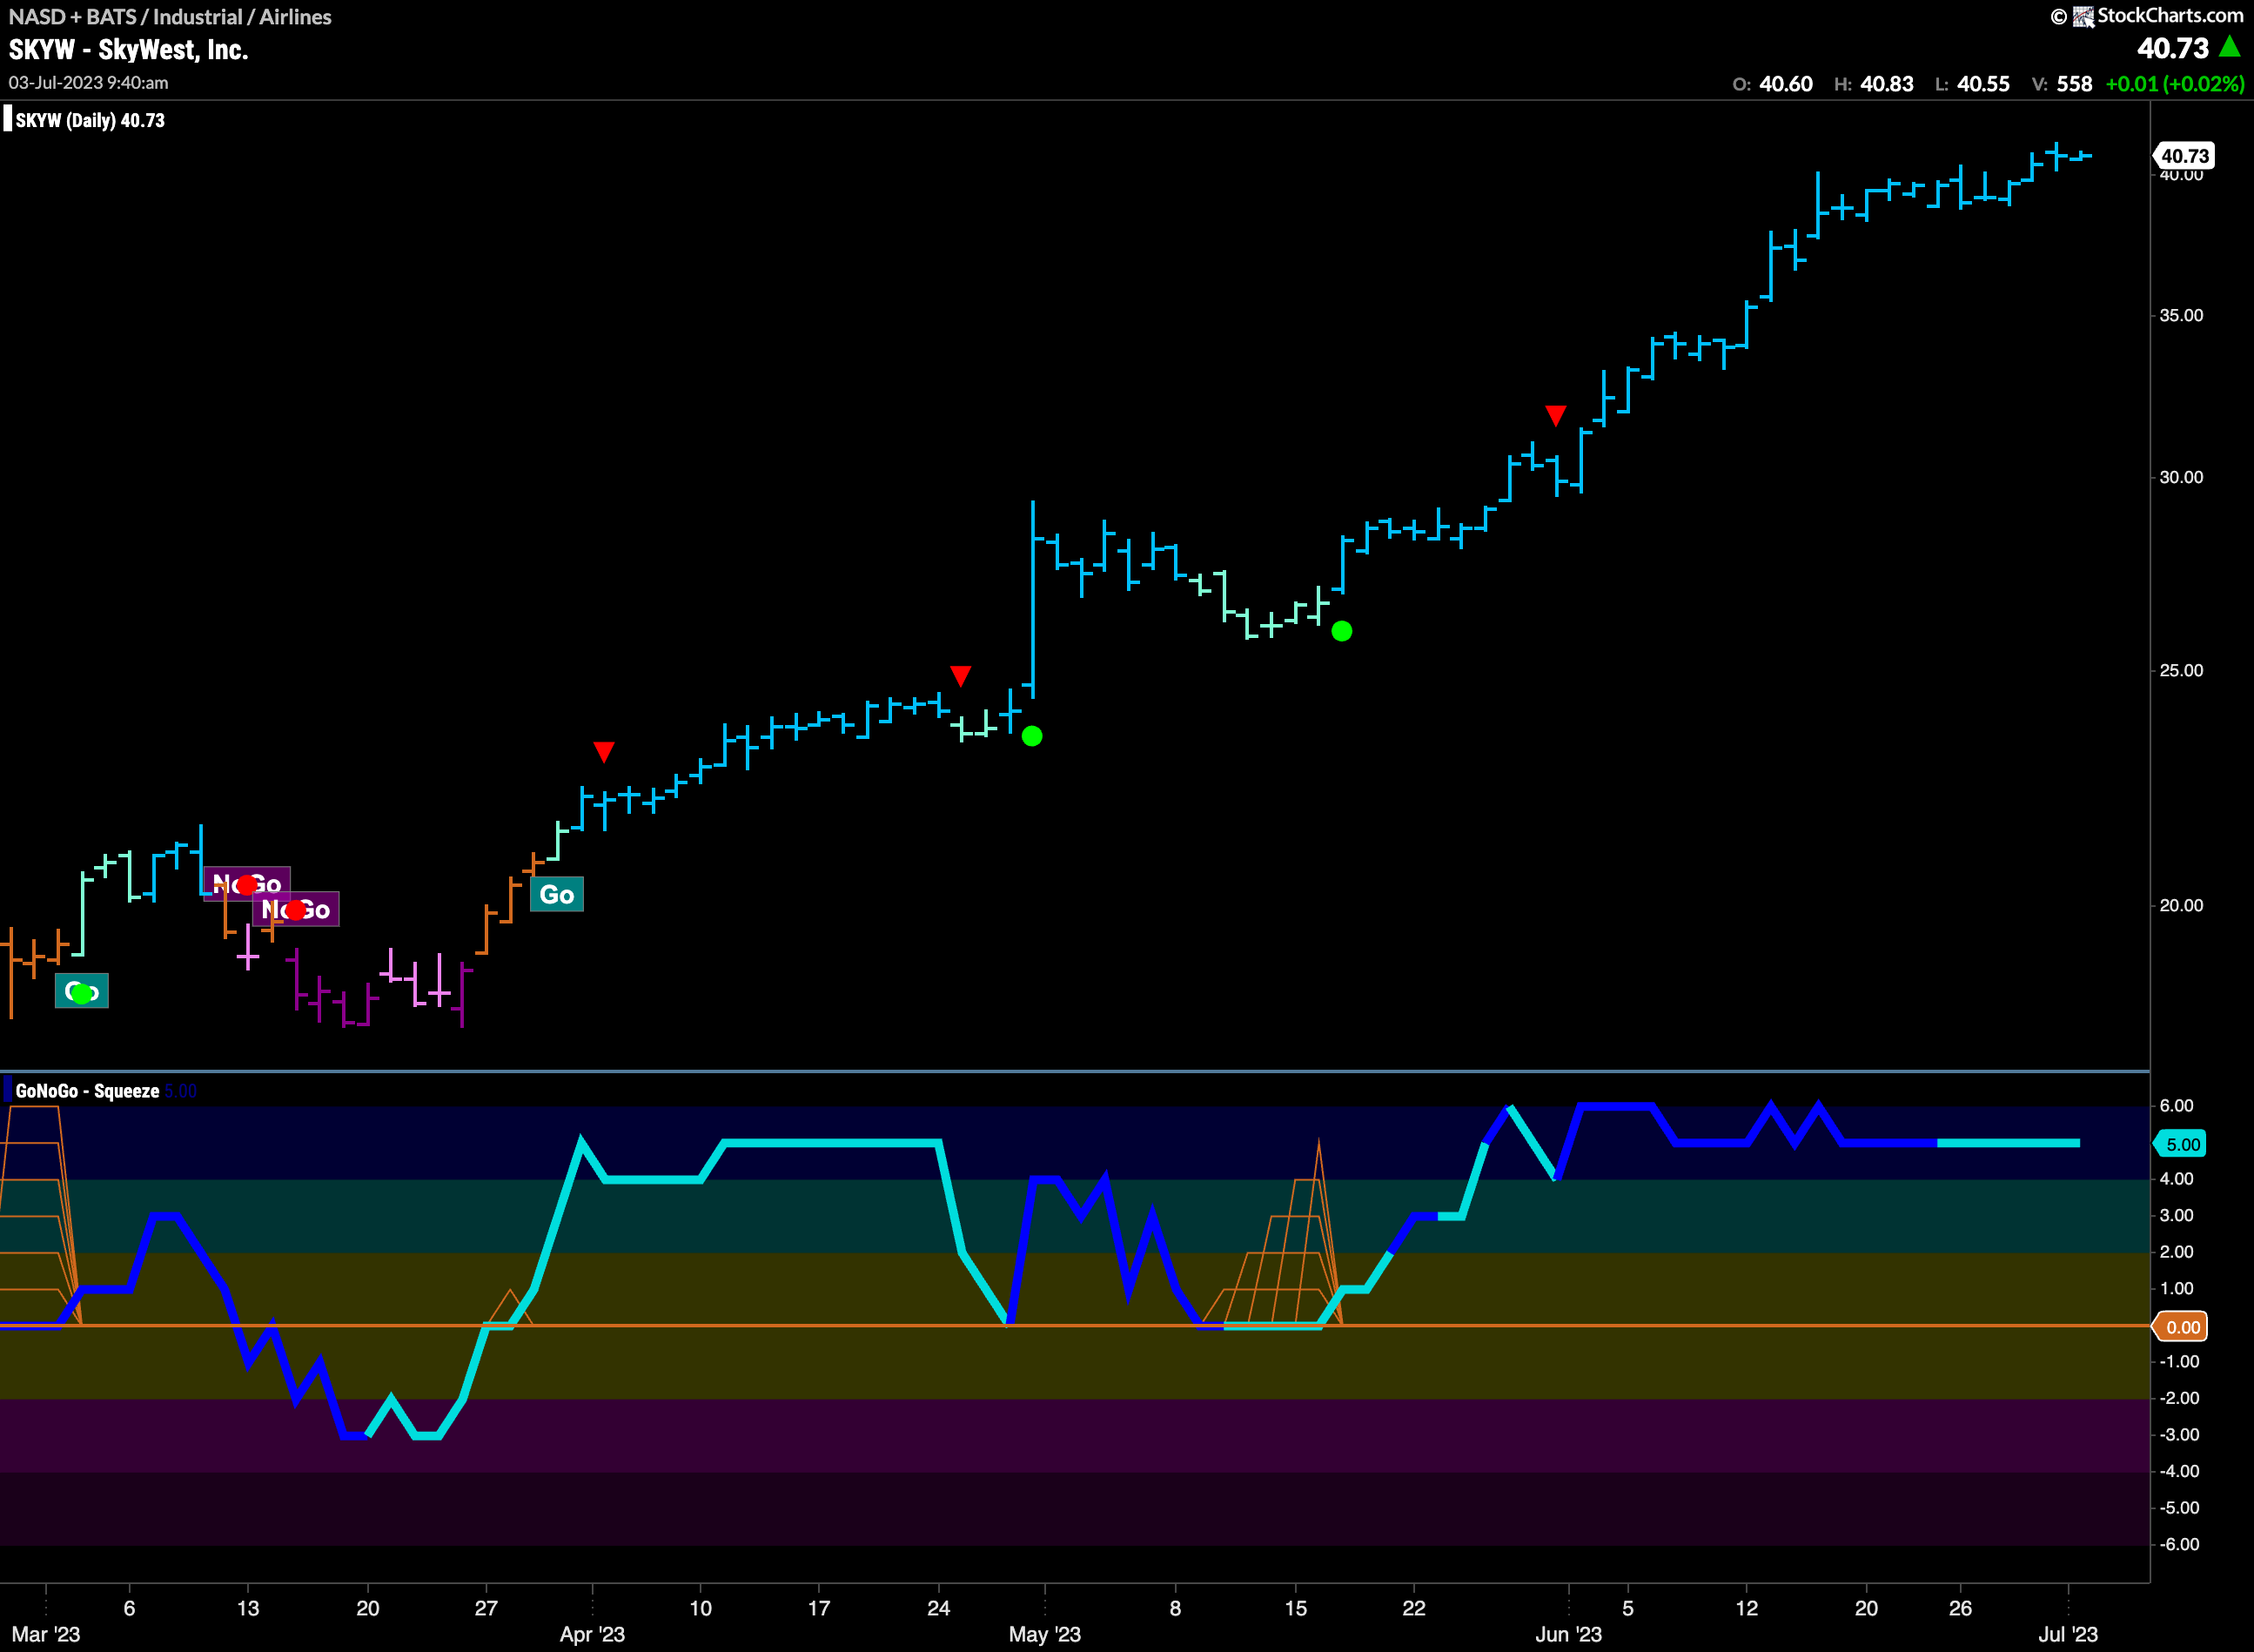
Below is the chart of $SKYW and we can see that this is a security that has helped drive the airlines industry sub group to new heights. Since the middle of May the only color GoNoGo Trend has painted has been strong blue. This shows the incredible strength of the company. Looking at the lower panel, we can see the outrageous oscillator activity. The oscillator has been in overbought territory for the entire month of June and into July. This reflects strong market enthusiasm for the stock.
Mesa Air Group Inc Ready to Take-Off?
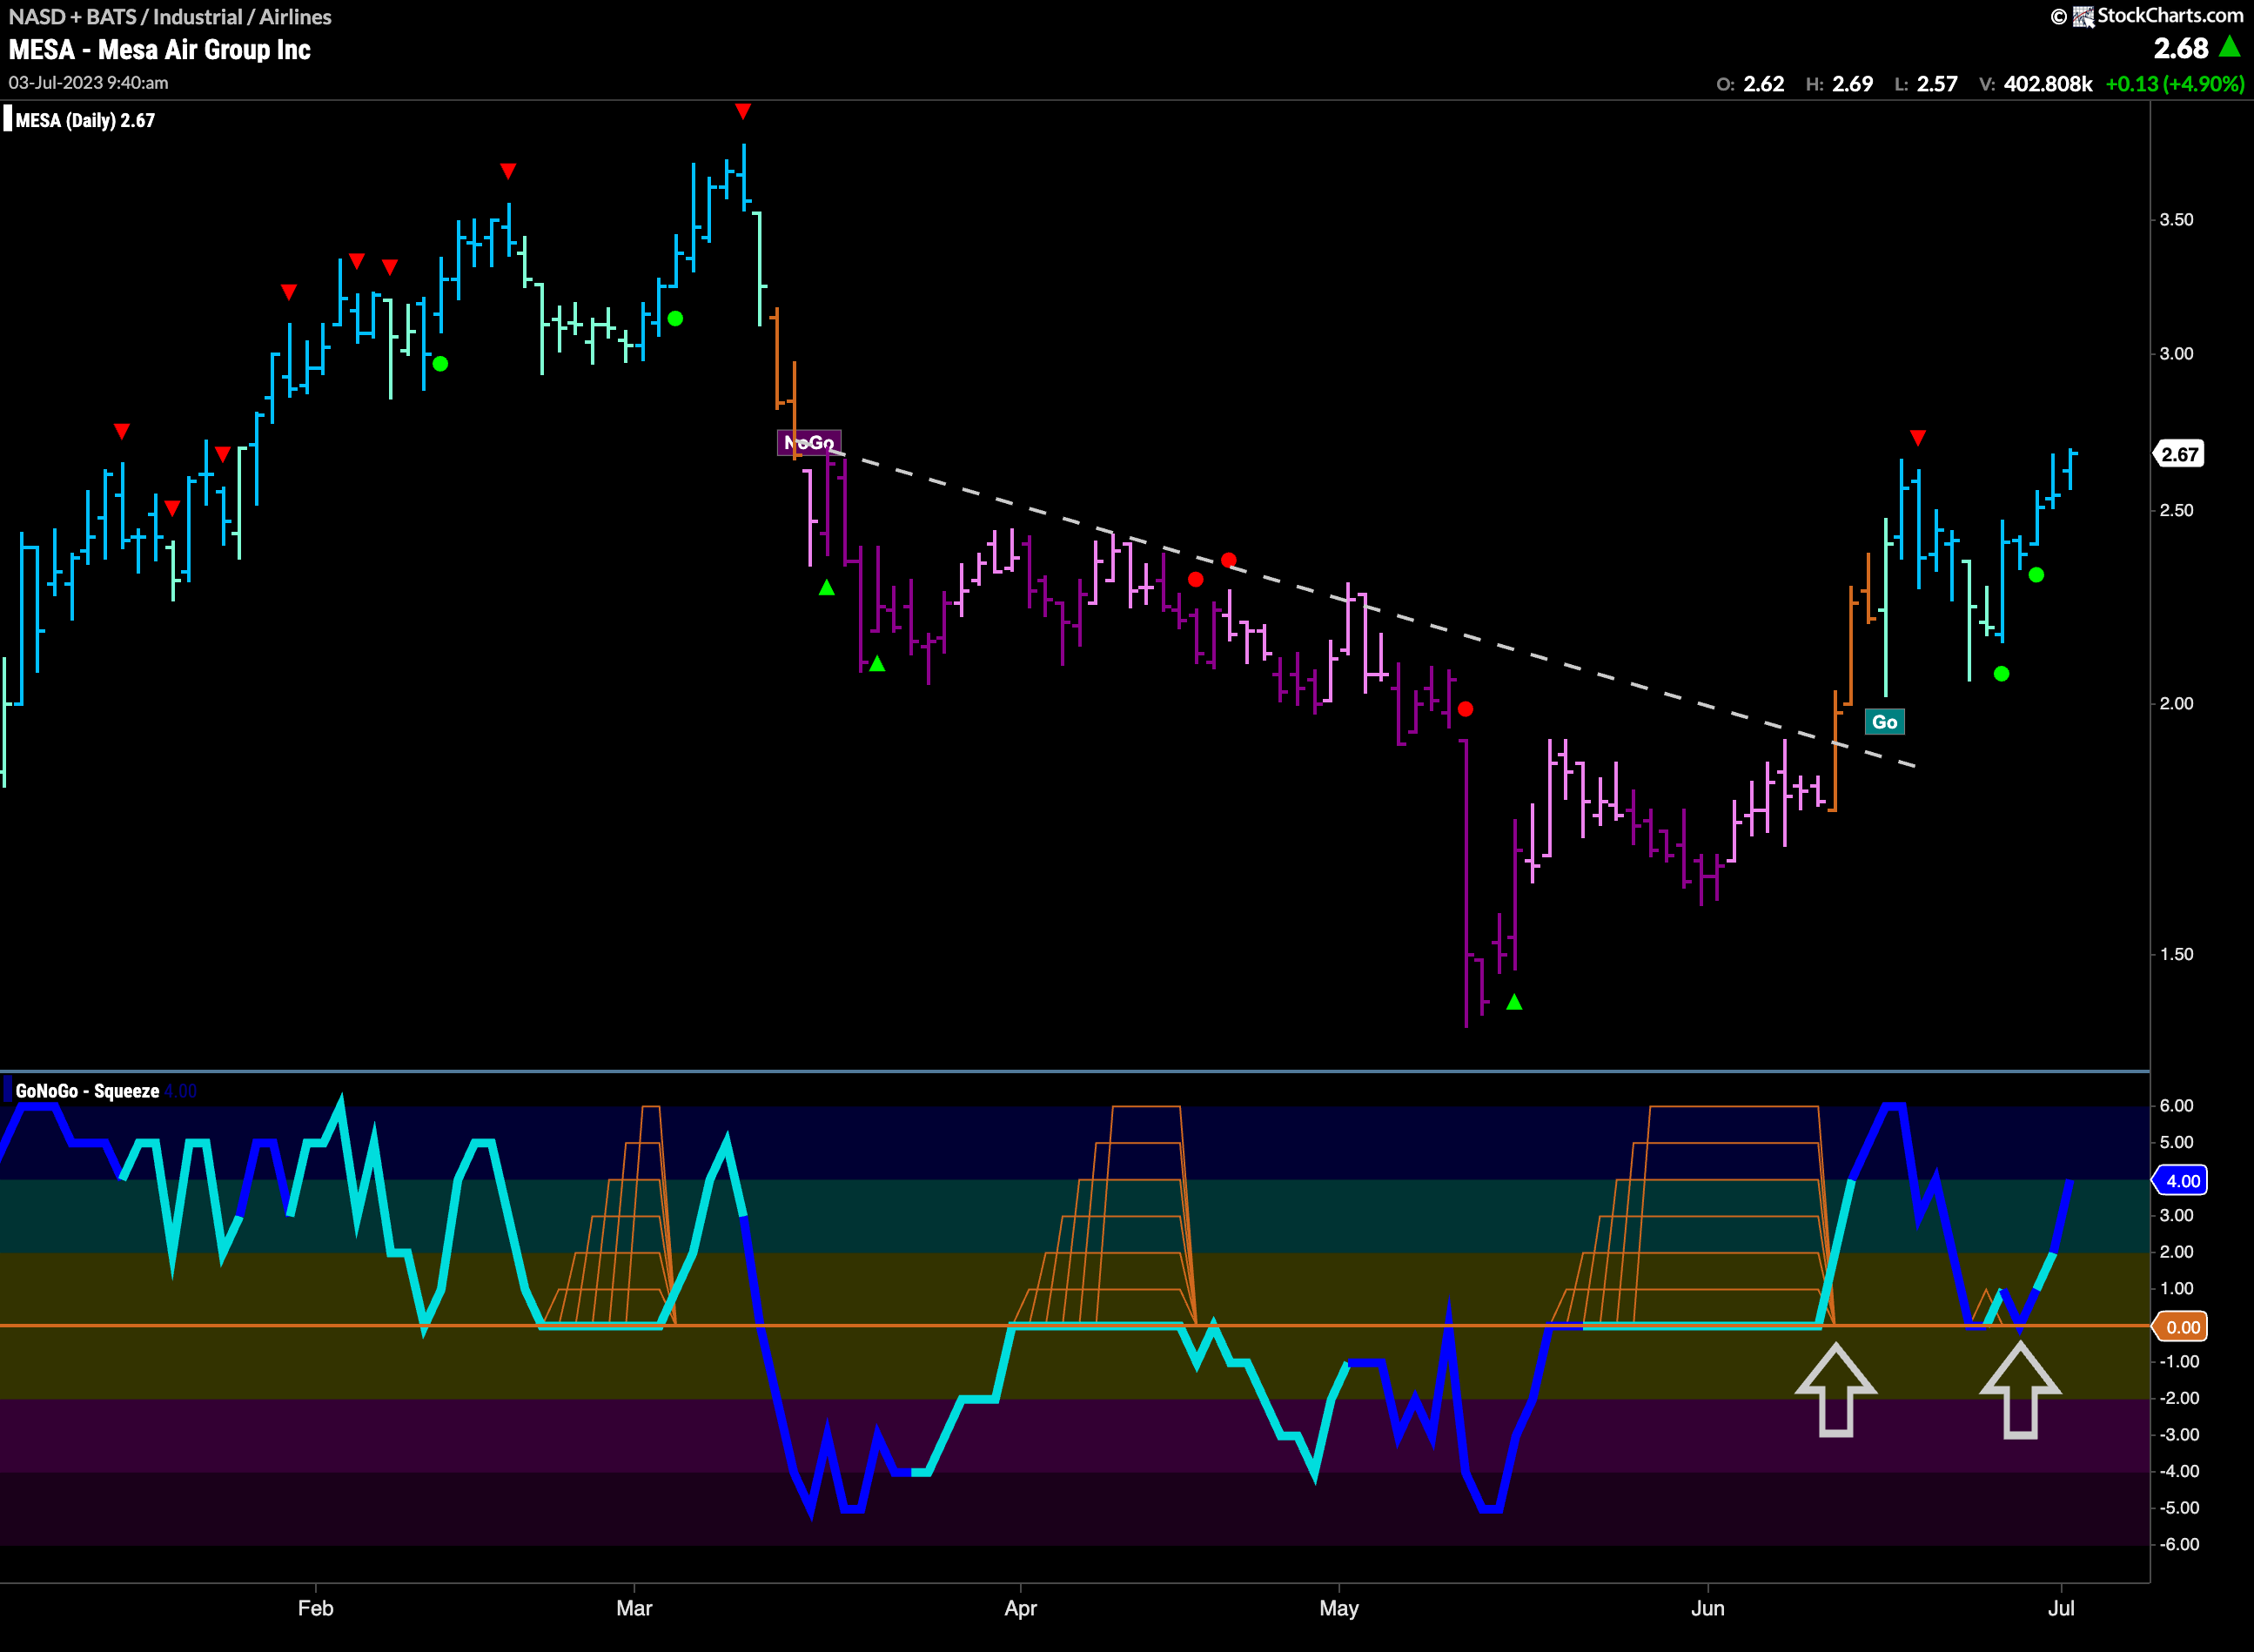
If the chart of $SKYW looks overextended to many, perhaps the chart of $MESA below is a more attractive chart for those looking for an opportunity to participate in the strength we are seeing in industrials and airlines. GoNoGo Trend shows that as price broke above downward sloping resistance the “NoGo” lost its grip and we saw a couple of amber “Go Fish” bars that then succumbed to bullish “Go” bars. Having encountered a Go Countertrend Correction Icon (red triangle) we saw a pull back. This sent the GoNoGo Oscillator crashing to the zero line where it quickly found support. During this new “Go” trend, we have seen heavy volume (dark blue oscillator line) and this resurgent momentum has taken price back to test the recent high.
