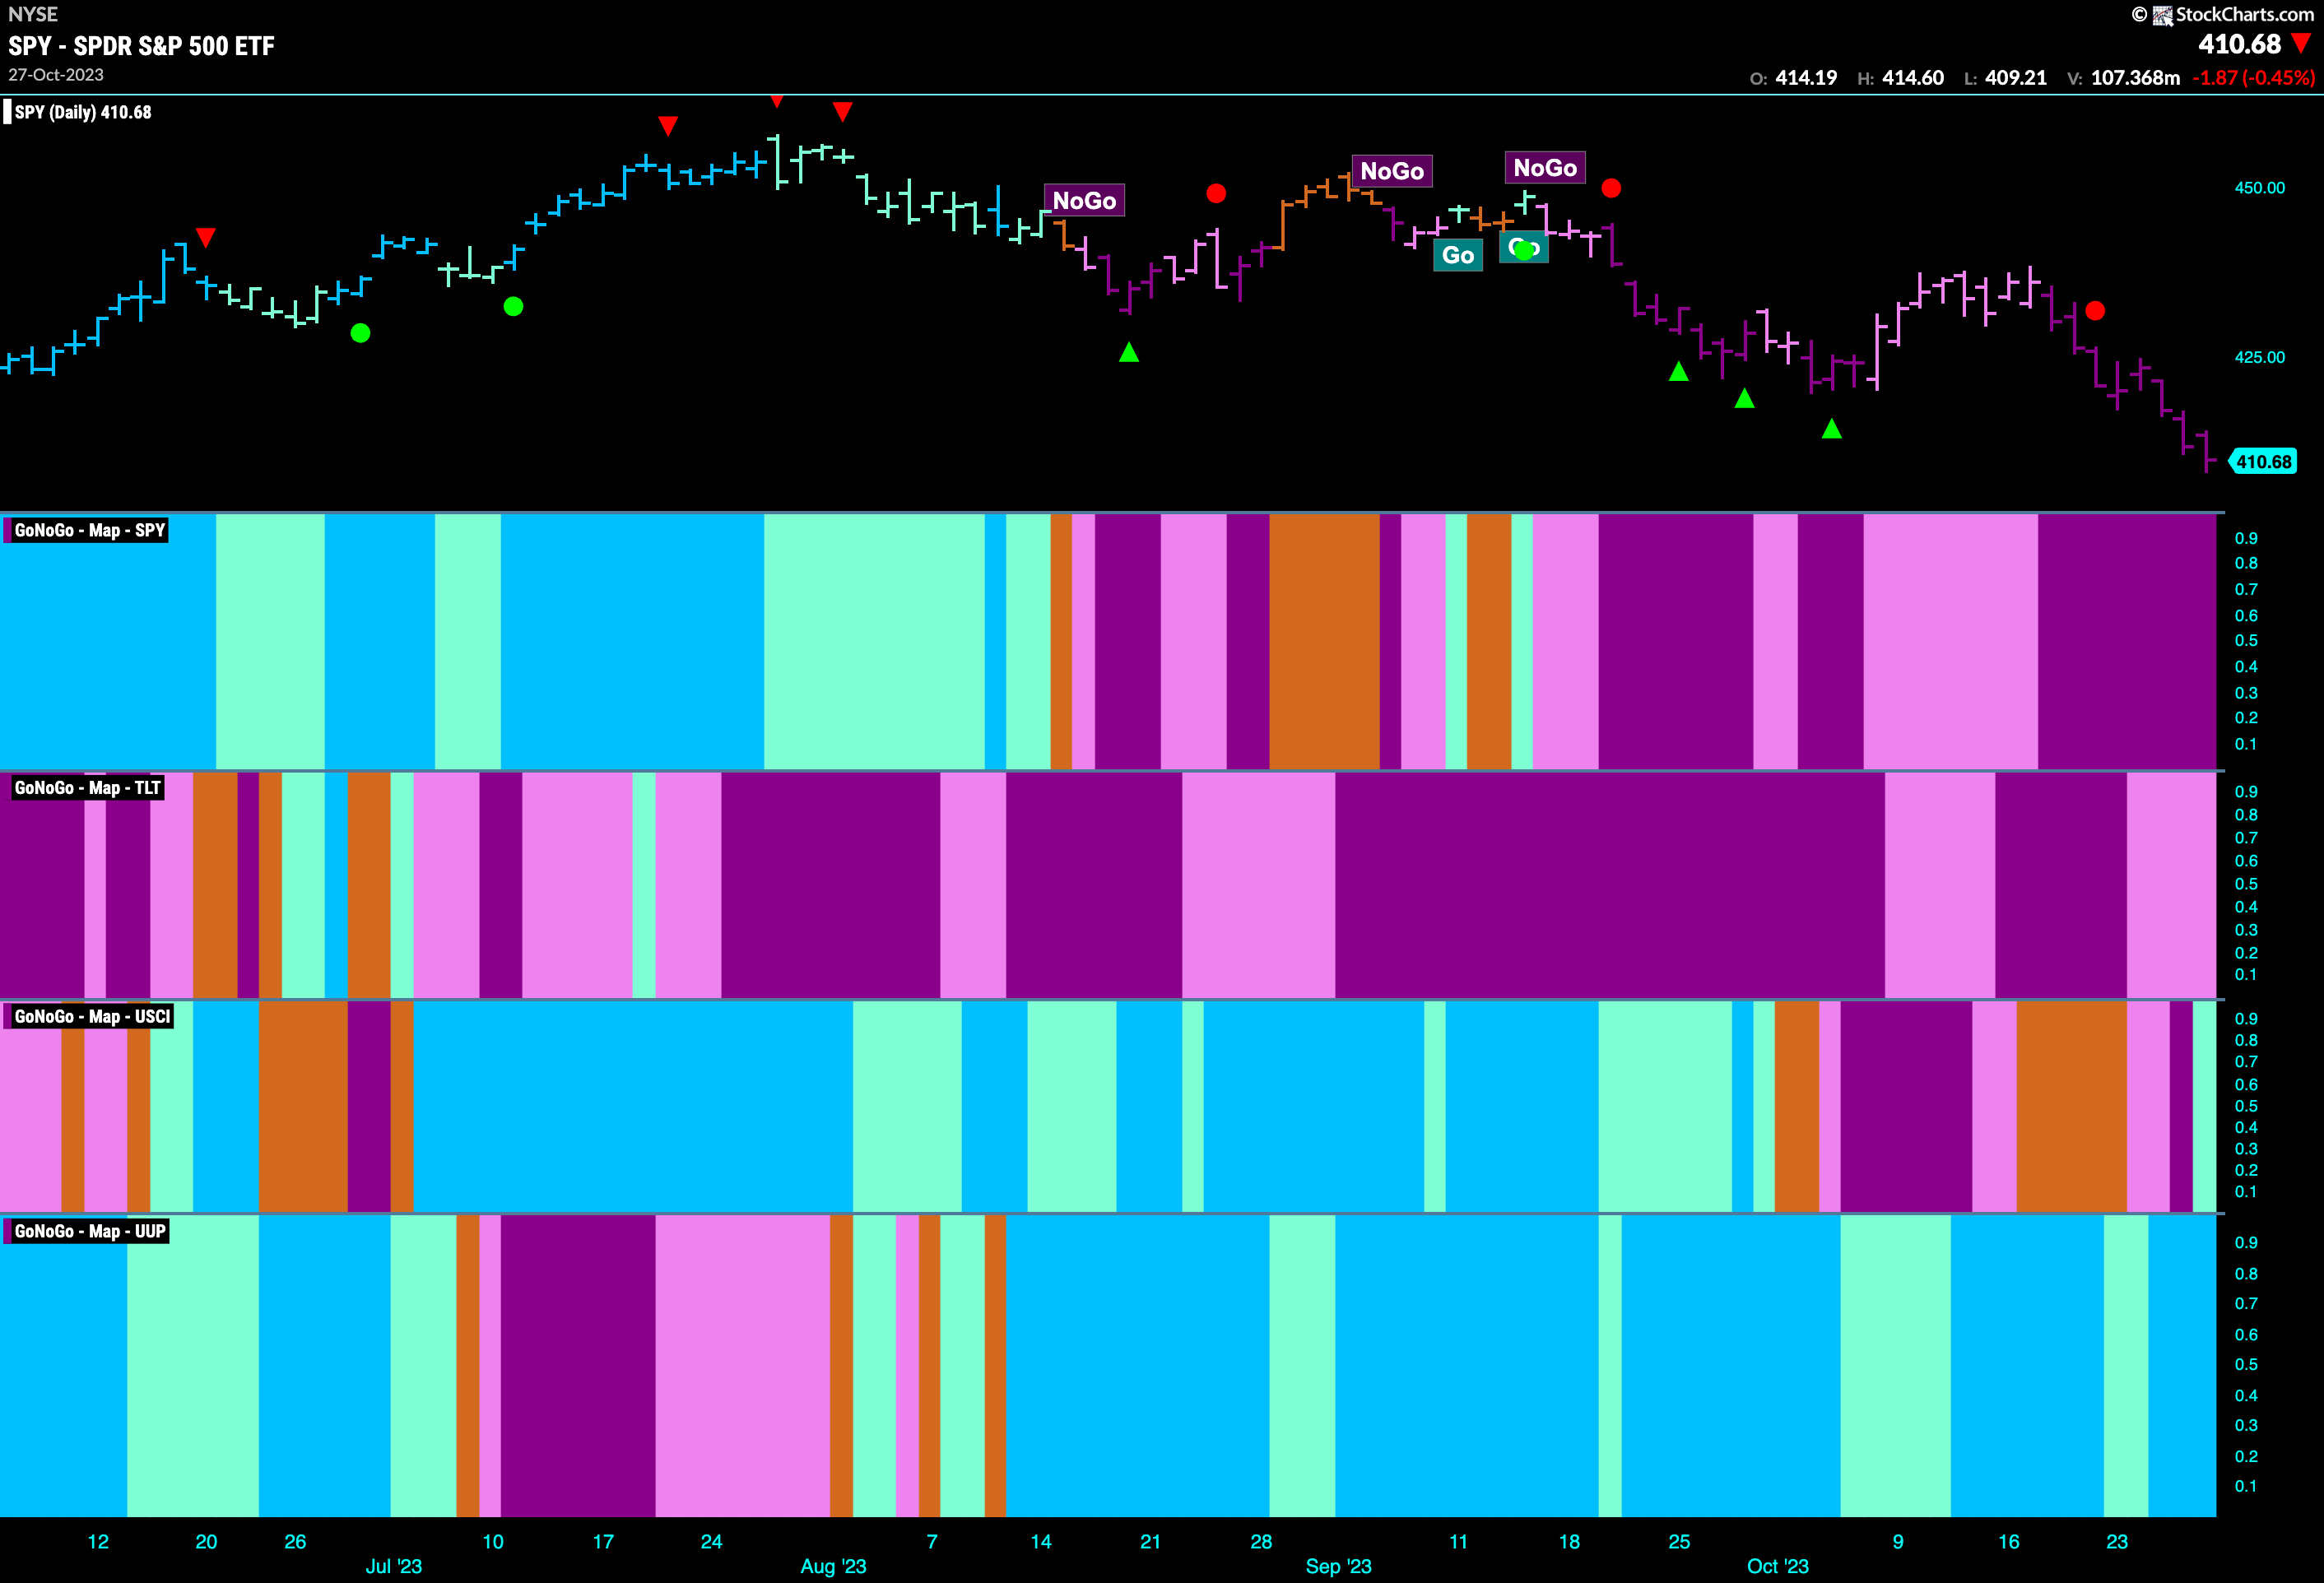
Good morning and welcome to this week’s Flight Path. Not a great week for U.S. equities. We saw price move lower this week to set a new low and an uninterrupted string of strong purple “NoGo” bars. Treasury bond prices remained in the “NoGo” but painted mostly weaker pink bars this week. Commodities have braved the storm and emerged to paint a first aqua “Go” bar. The dollar remains strong as price moves sideways but paints strong blue “Go” bars.
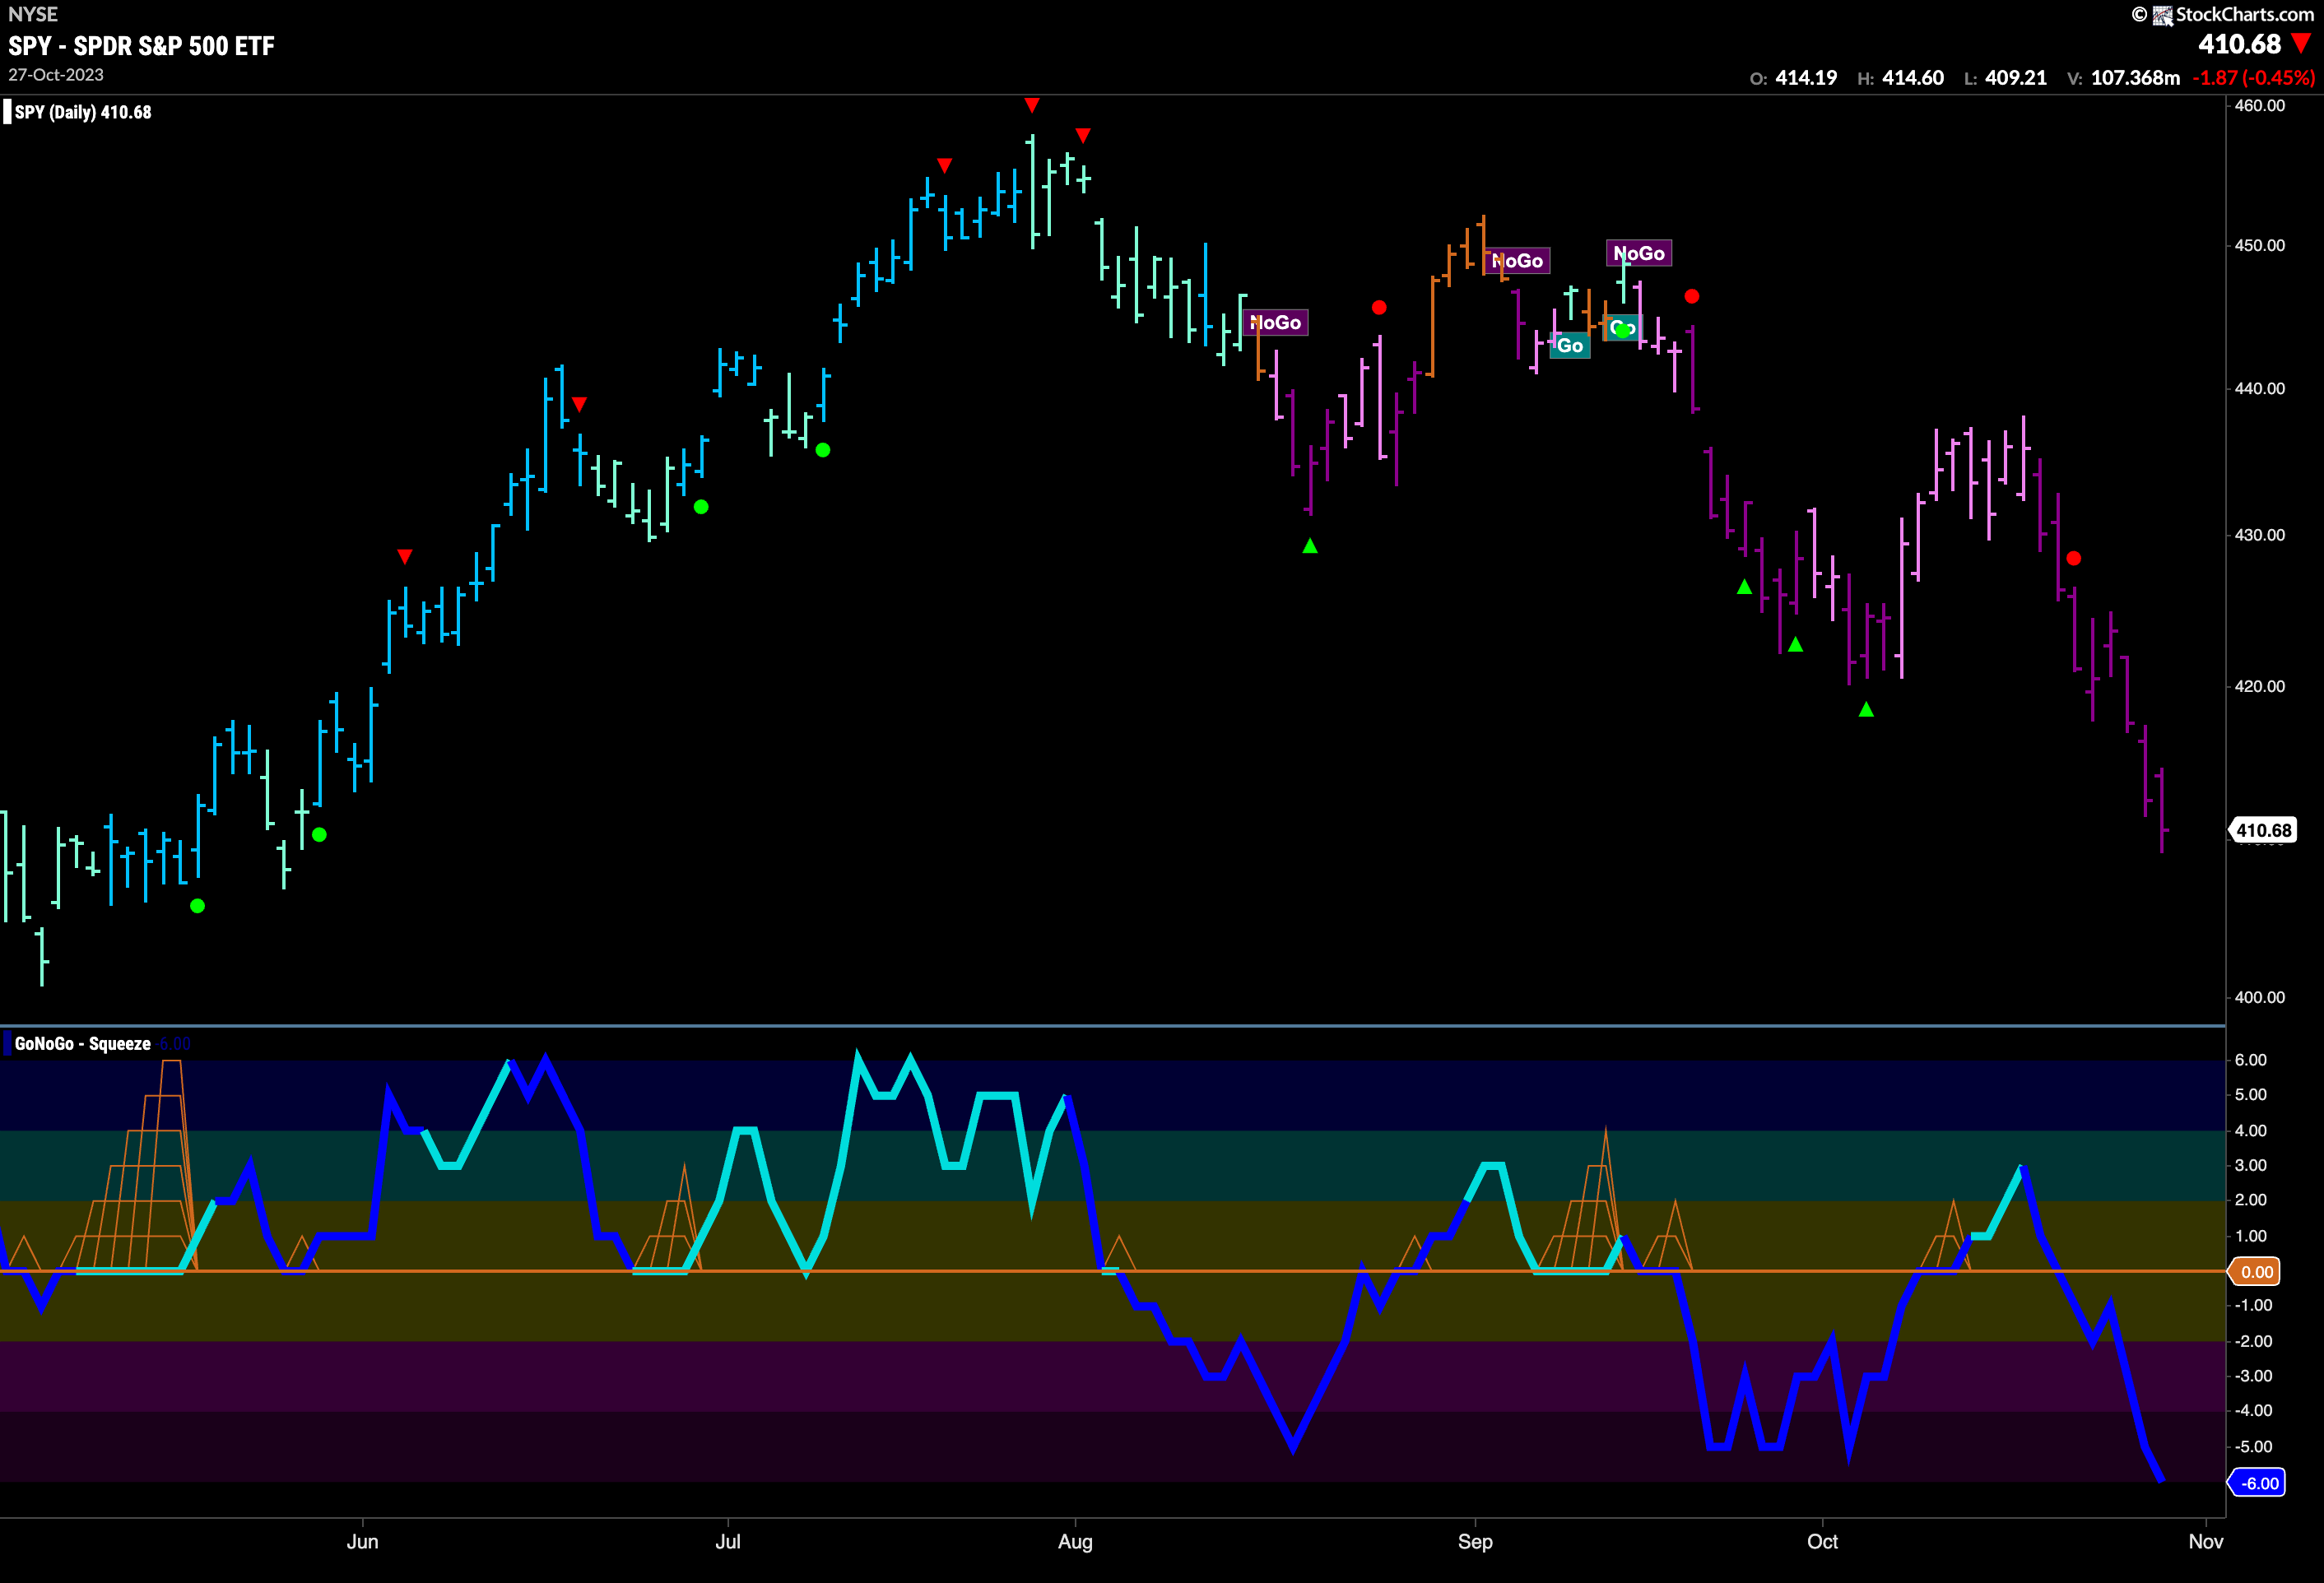
“NoGo” Sees Price Fall to New Low
Last week we noted that price was testing prior lows. This week price set new ones. The “NoGo” trend remains strong as we saw a string of uninterrupted purple bars this week as price continued to fall. GoNoGo Oscillator after falling back through the zero line has moved quickly to oversold extremes and volume remains heavy. We will watch to see if the oscillator remains oversold or if coming back into neutral territory will give price any relief.
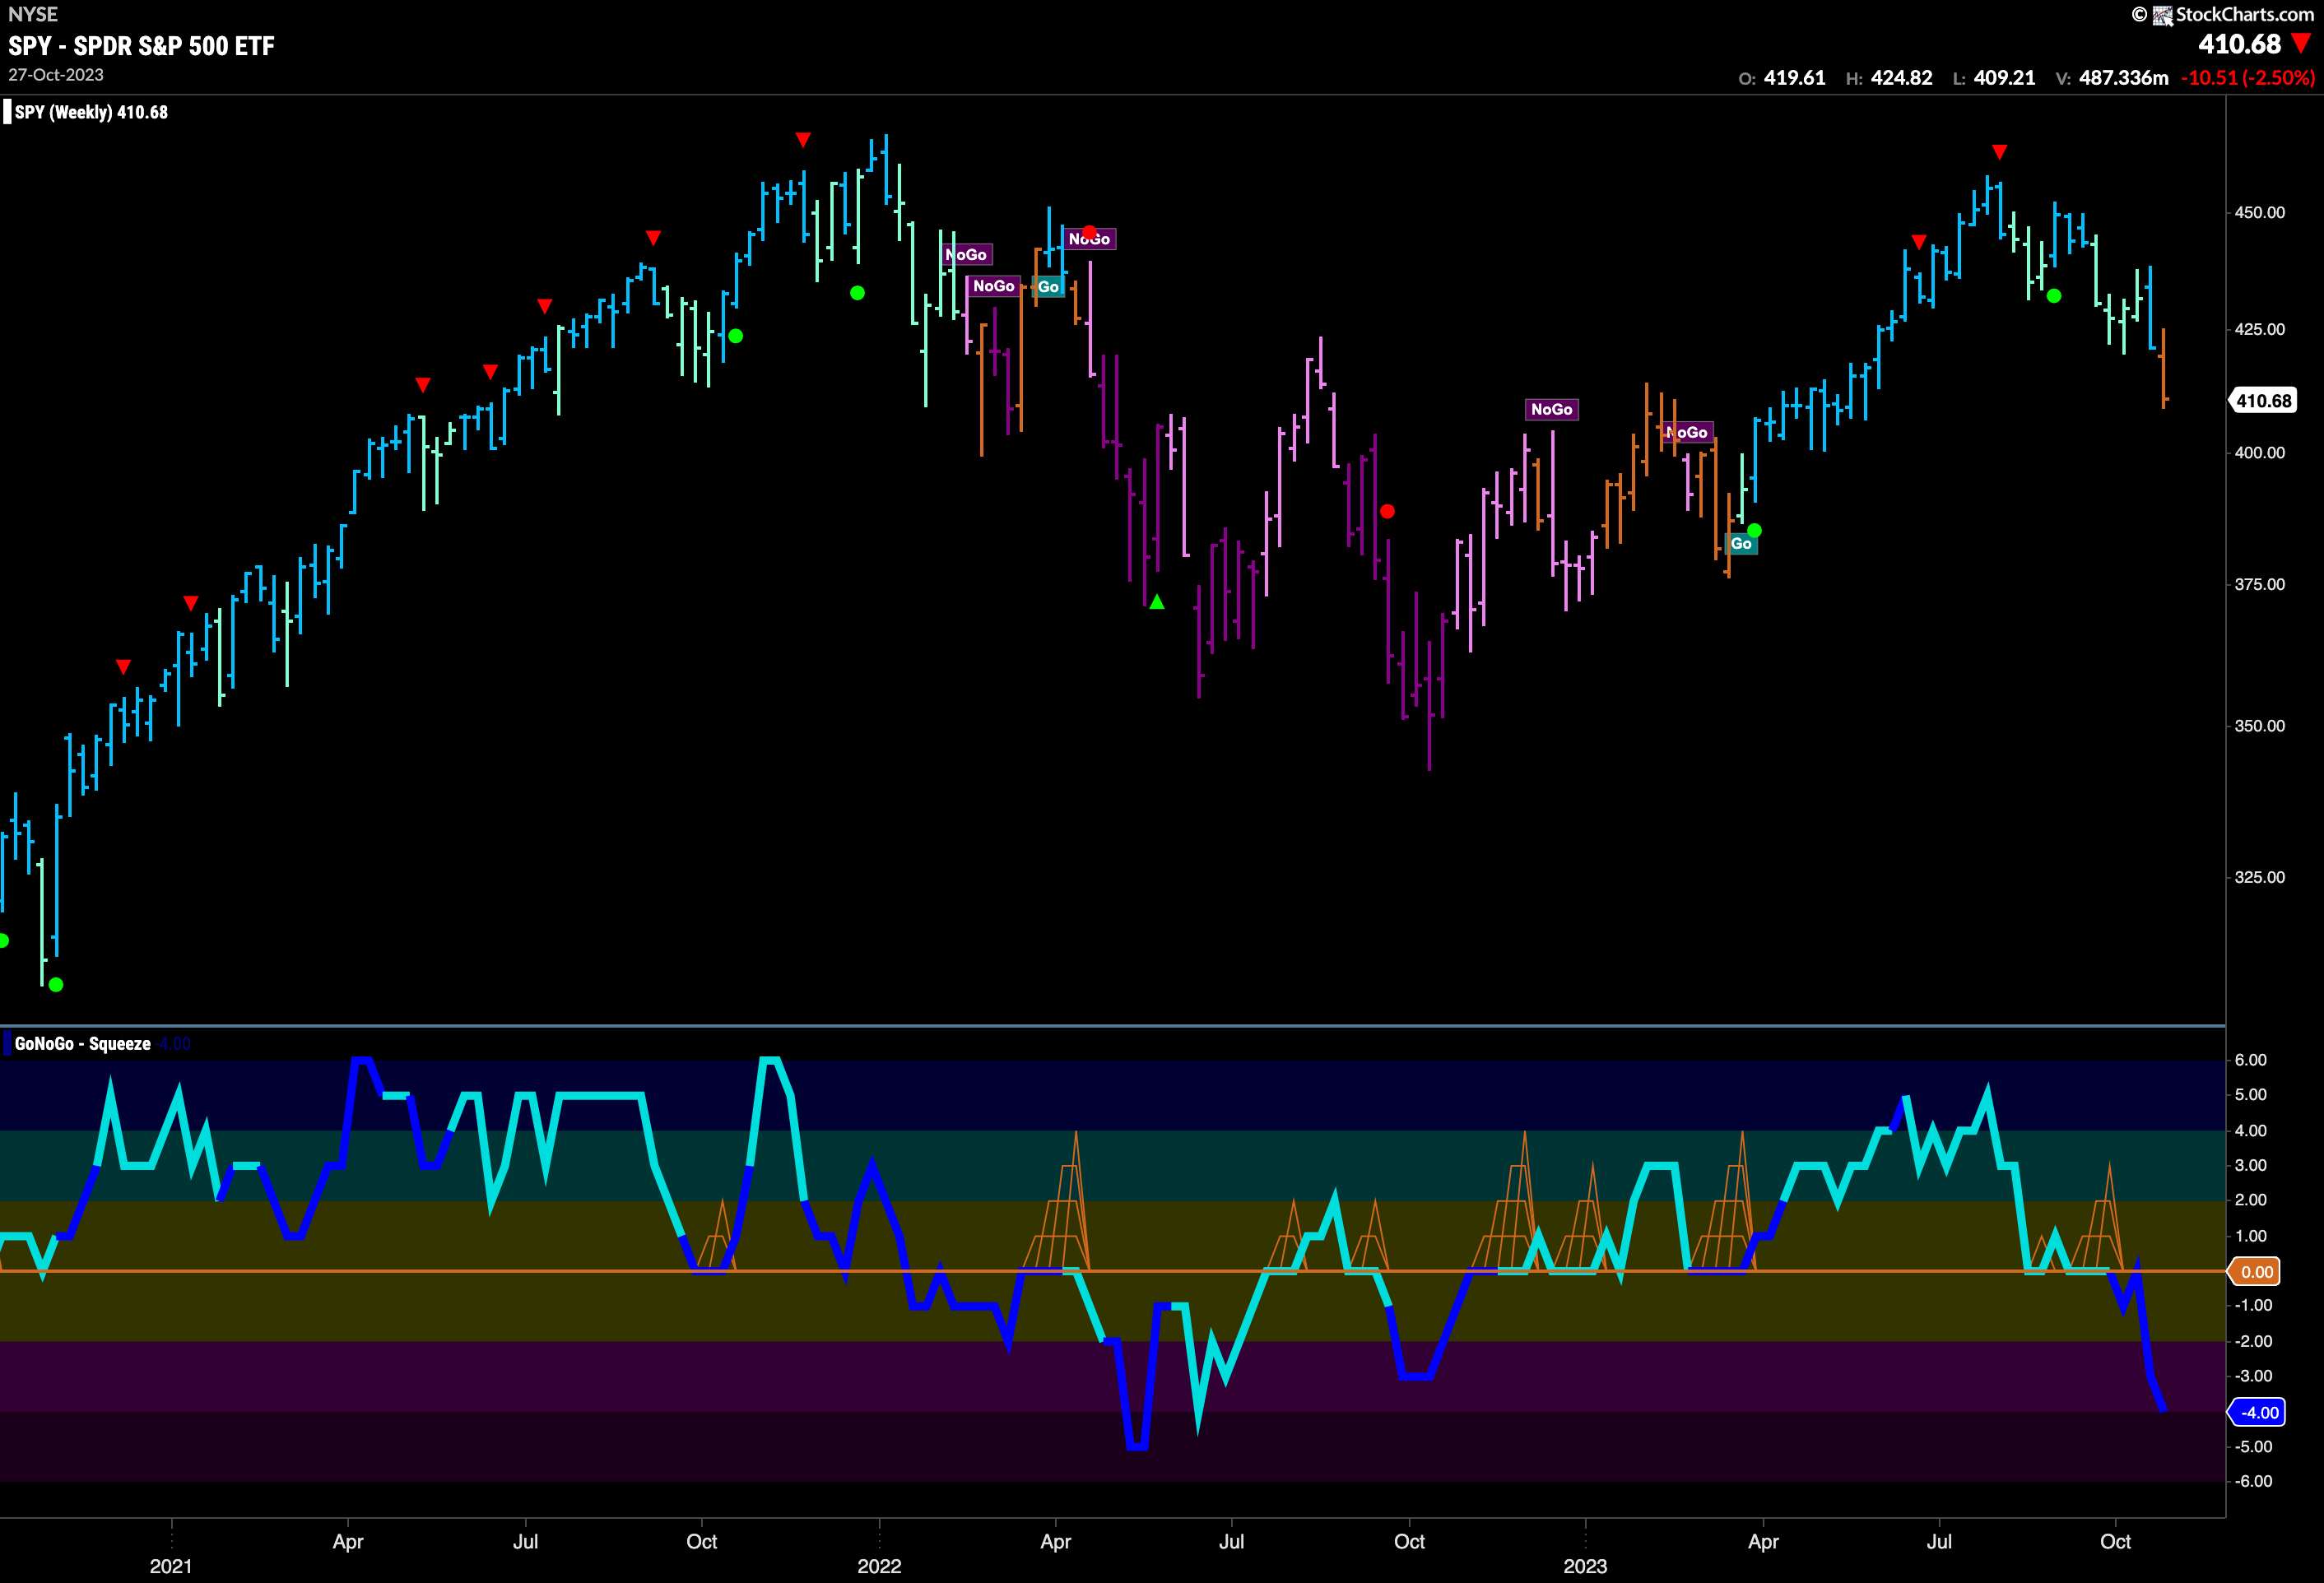
The longer term weekly chart shows just how damaging the price action of late has been. For the first time since entering into the “Go” trend in the spring of this year we see GoNoGo Trend paint an amber “Go Fish” bar. This happened after GoNoGo Oscillator failed to find support at the zero line a few weeks ago. The oscillator quickly retested that level and was rejected and now is dropping fast, deeper into negative territory on heavy volume. This is not a good sign for equities over the next weeks and months.
Treasury Rates Remain Elevated
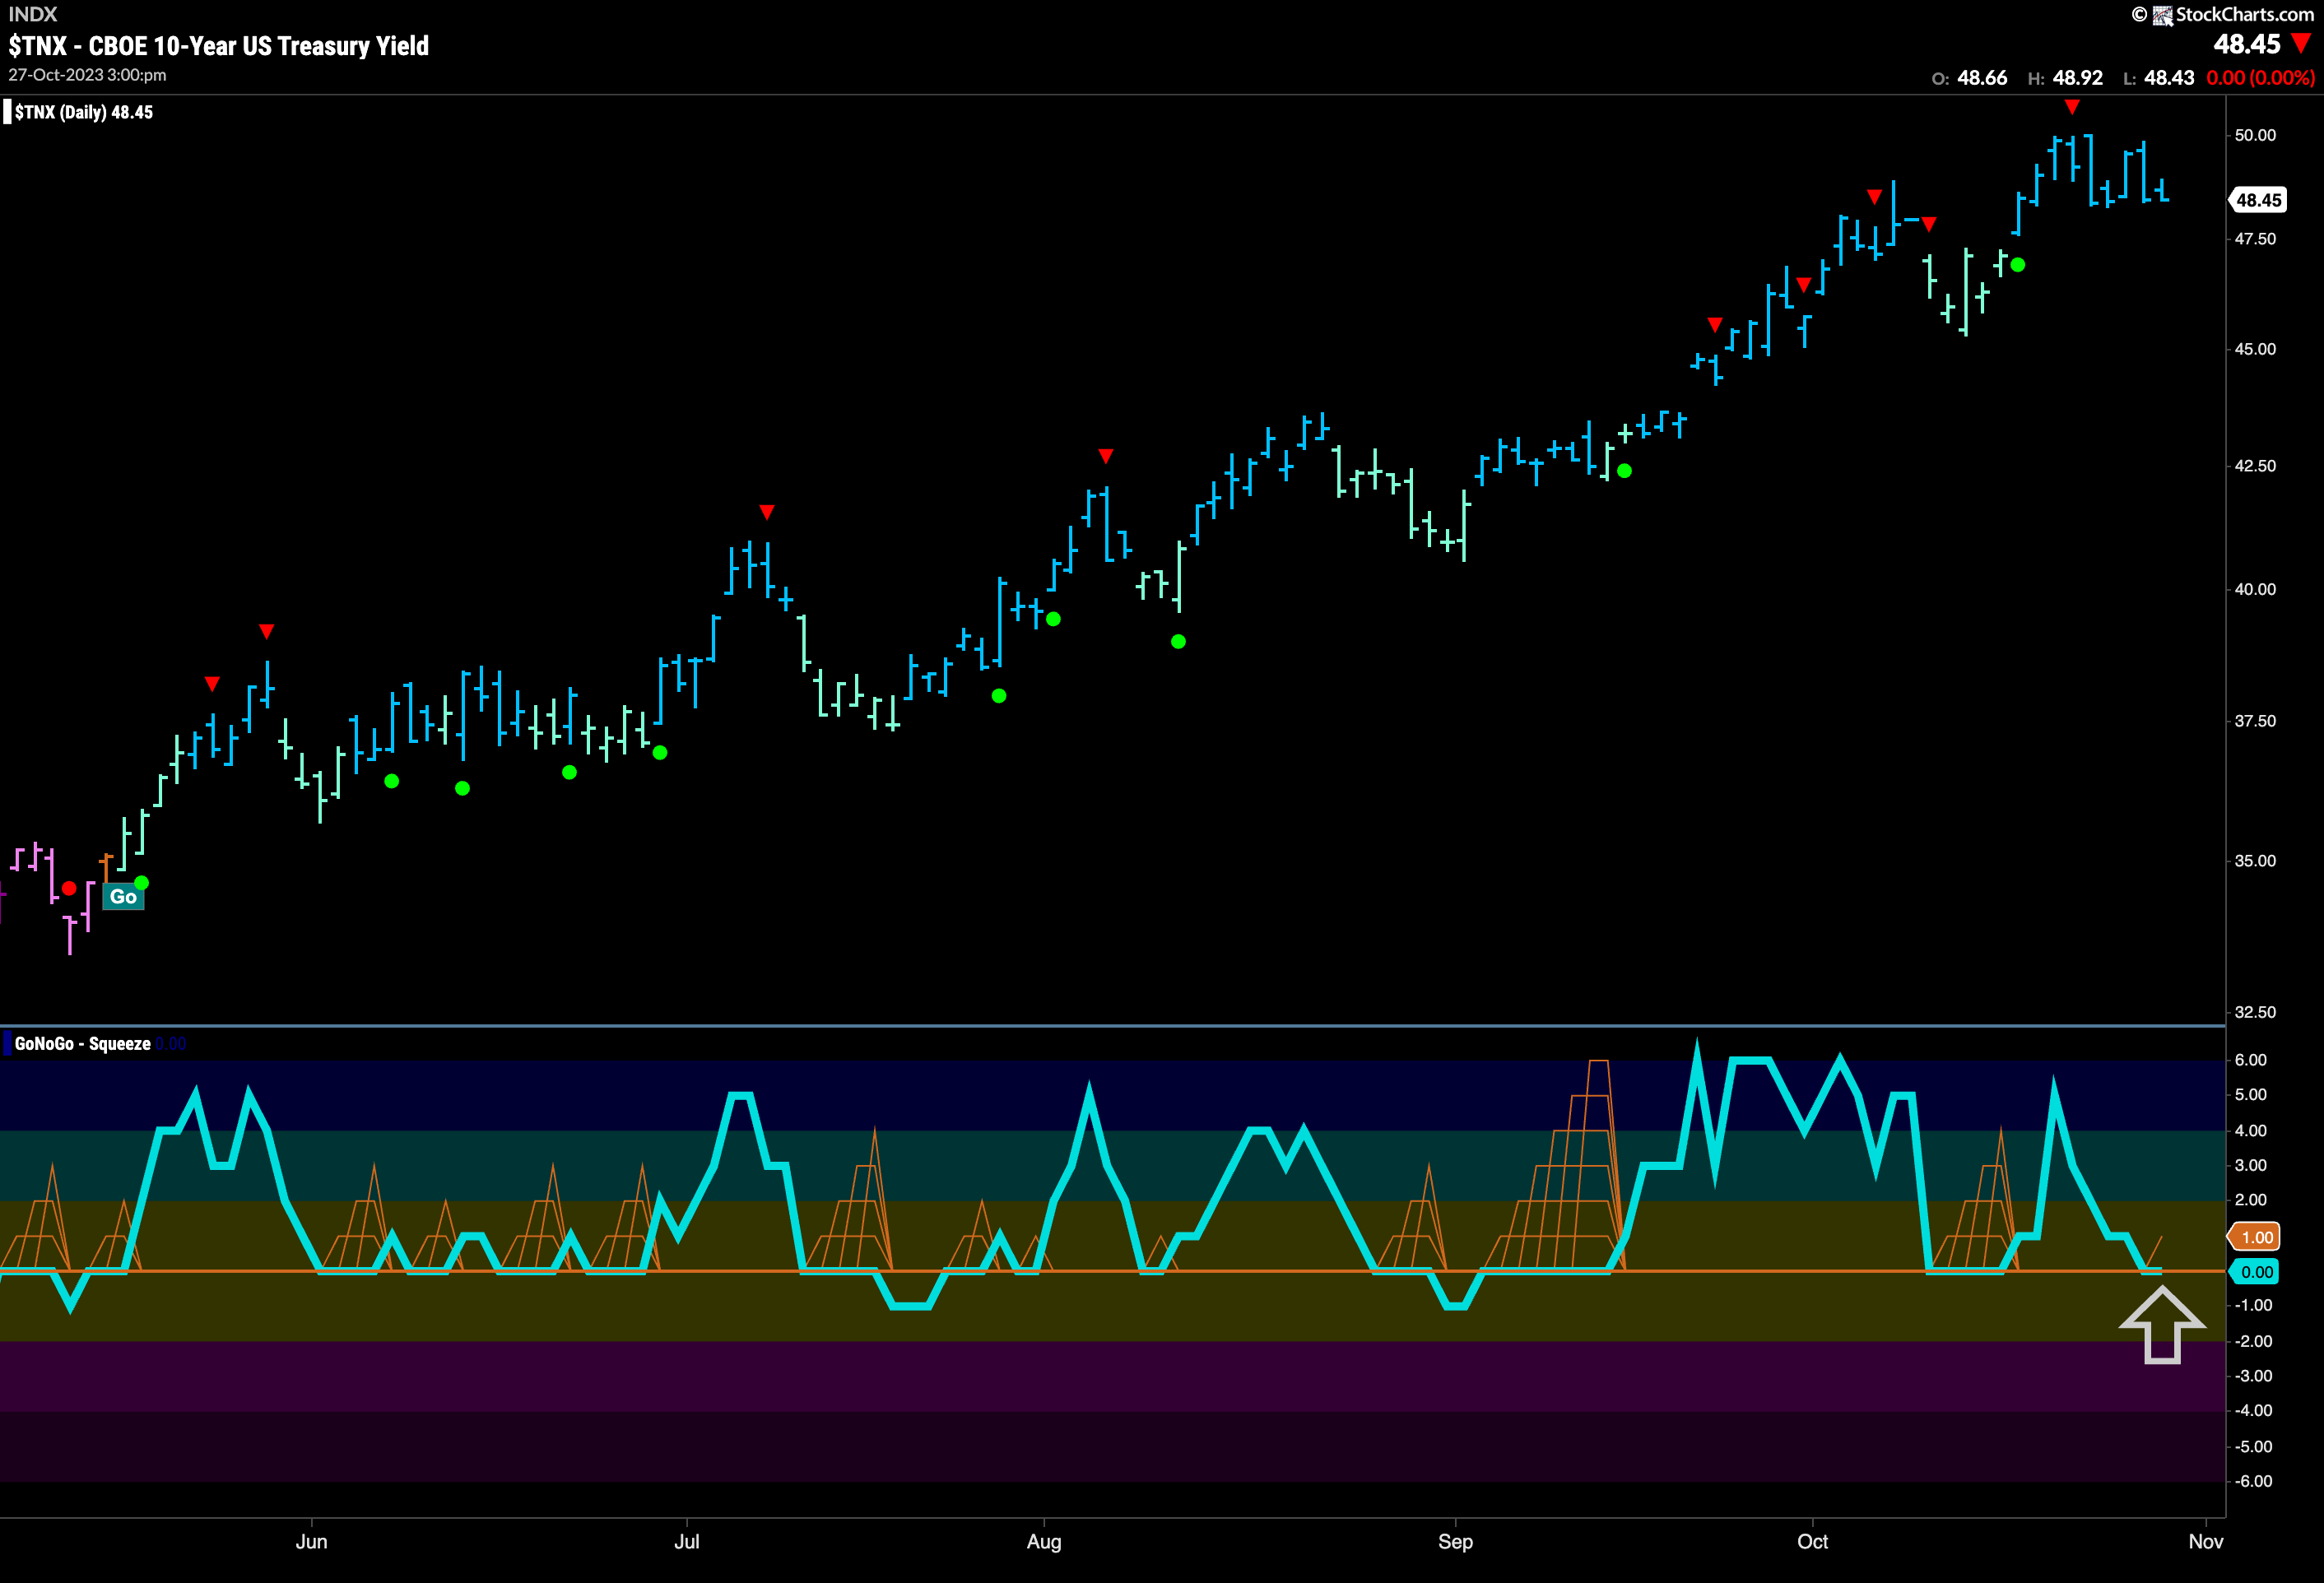
Treasury rates remain in a strong “Go” trend painting all blue bars this week. Since getting the Go Countertrend Correction Icon (red arrow) price has moved mostly sideways and that has caused GoNoGo Oscillator to fall to tag the zero line from above and we will watch to see if it finds support at this level. If it does, and rallies back into positive territory then we will expect price to make an attempt at another higher high.
Dollar Looks ffor New High
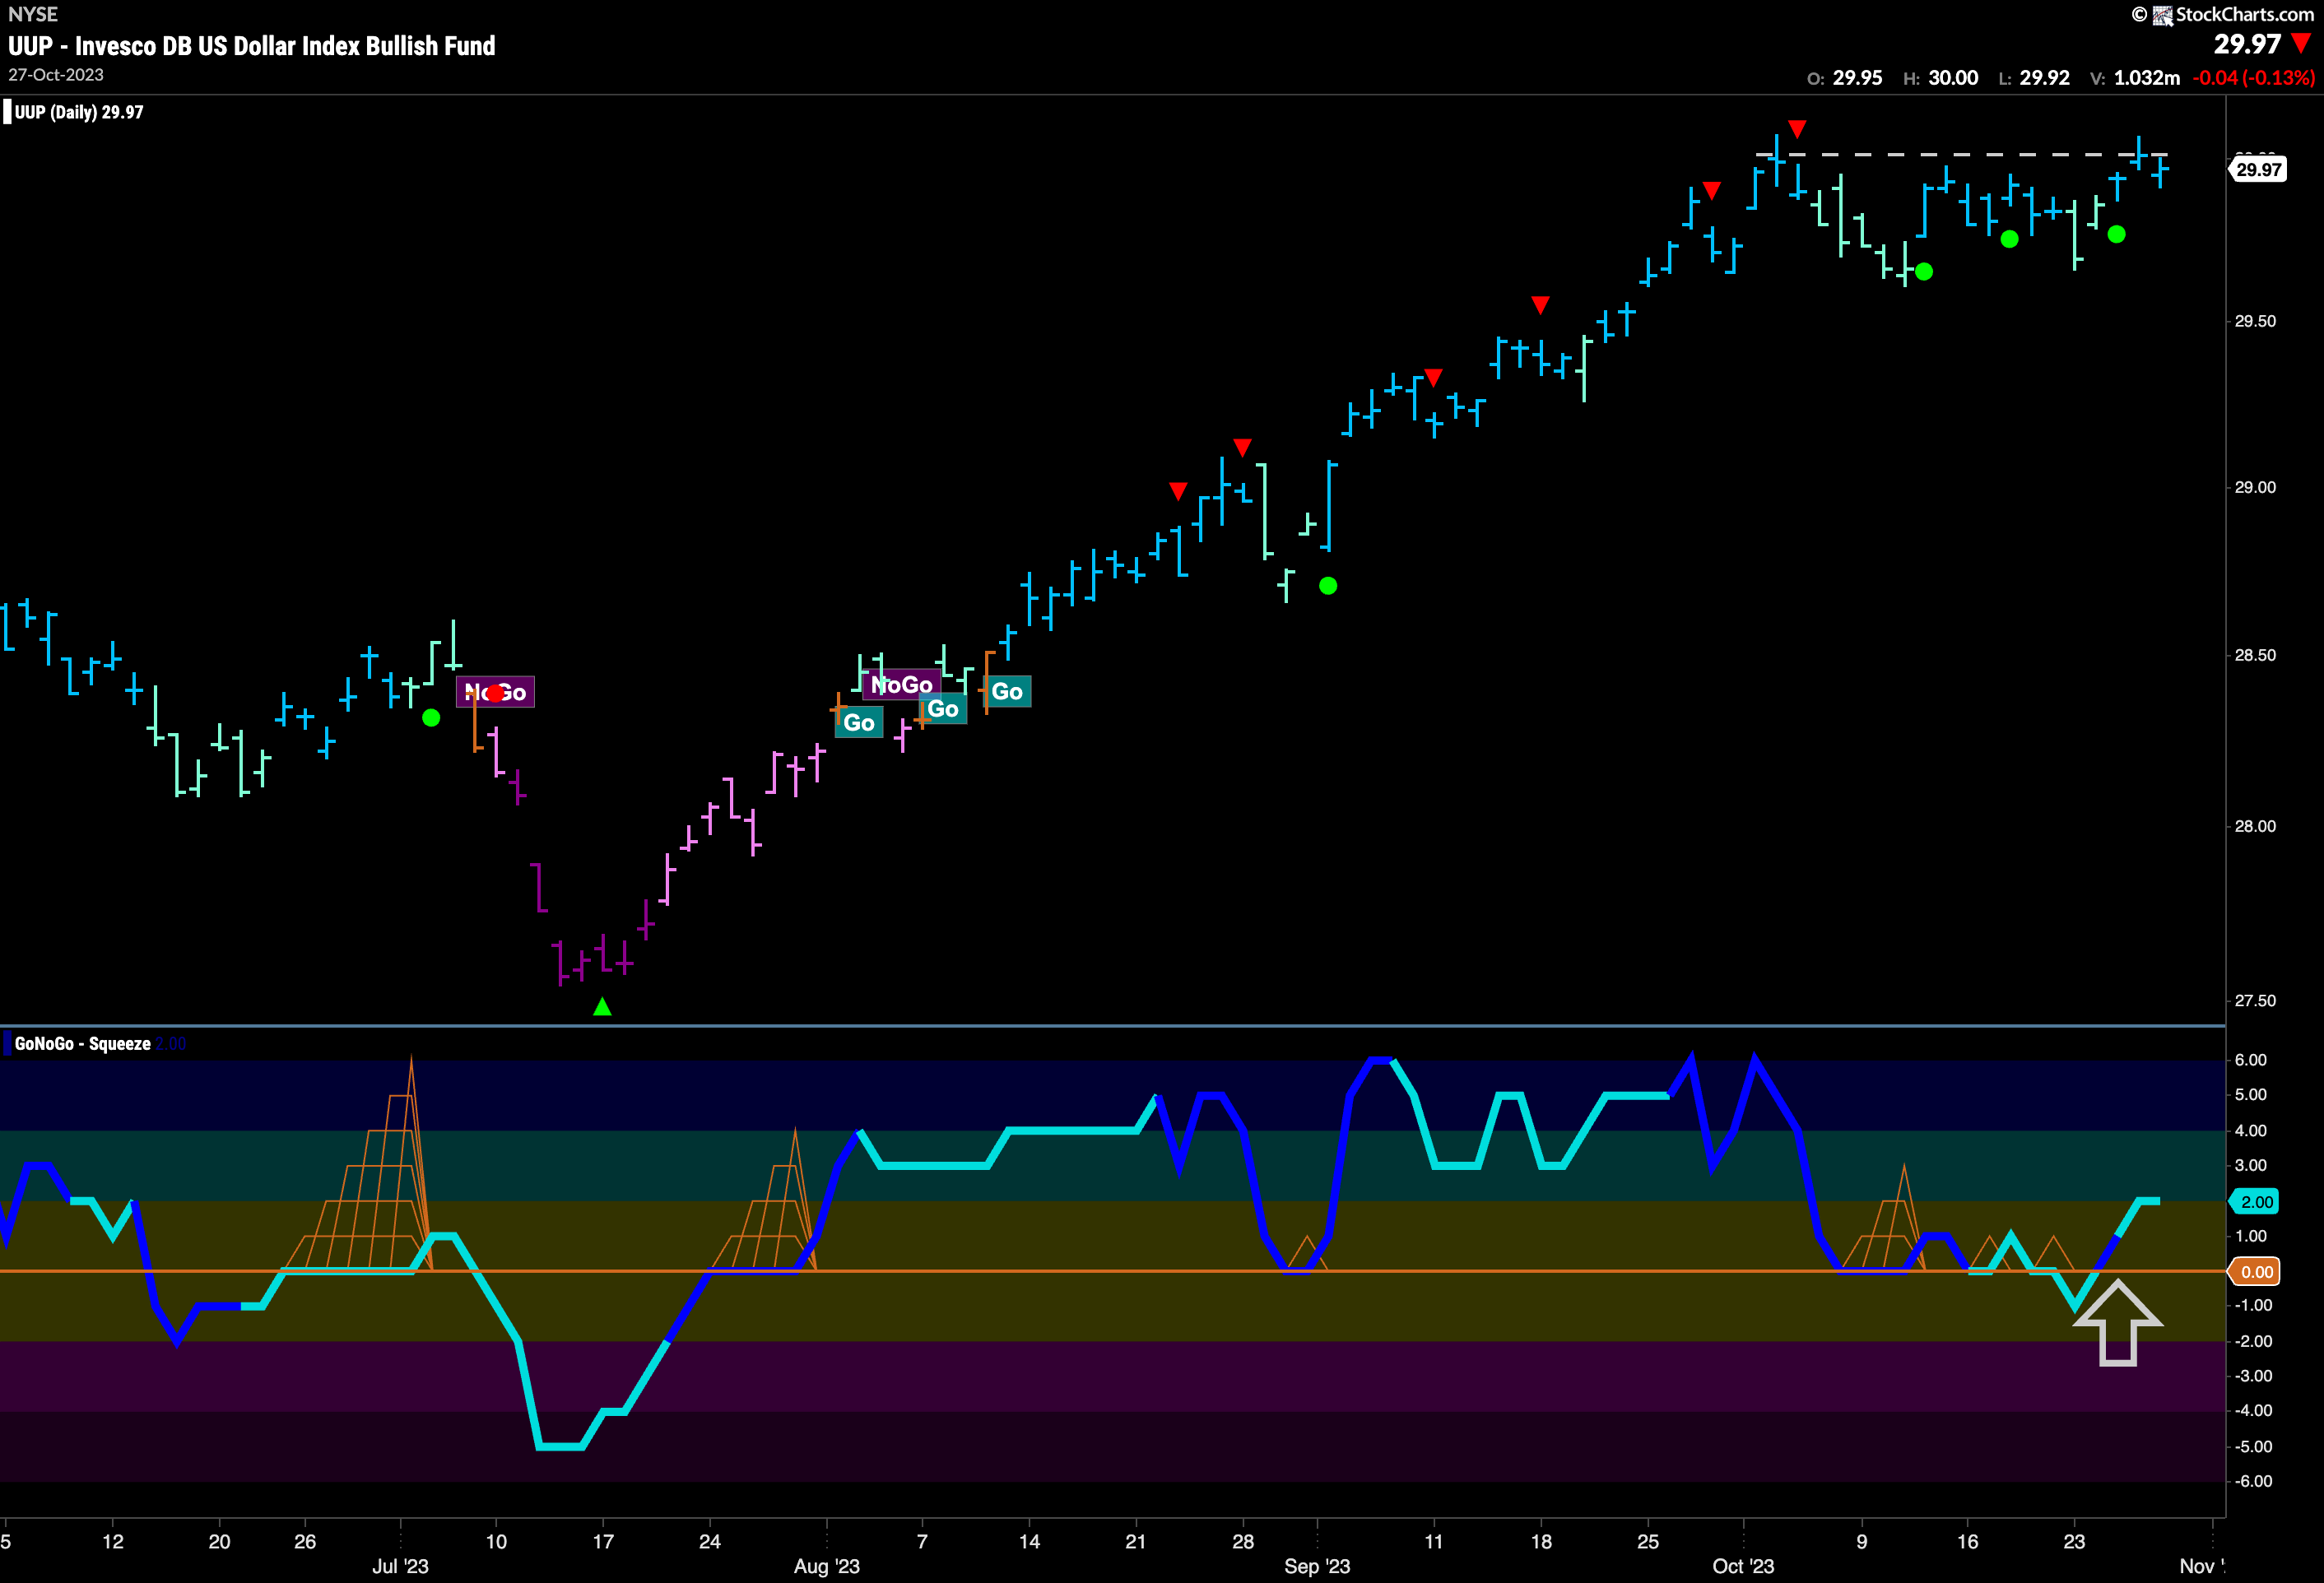
The dollar rallied in the latter part of the week and we saw price rise to test the resistance we see on the chart from the prior high. During the consolidation sideways that has happened since the last Go Countertrend Correction Icon (red arrow) we have seen the oscillator predominantly find support at the zero level and that has triggered several Go Trend Continuation Icons (green circles) on the chart. This tells us that momentum continues to be on the side of the “Go” trend. We will watch this week to see if price can set a new higher high.
Oil Continues to Chop
Oil is struggling for direction. Any color painted by the GoNoGo Trend has not lasted more than a few bars and this week saw a mix of amber “Go Fish” and weak pink “NoGo” bars. GoNoGo Oscillator is at the zero line. Volume is heavy throughout this period of uncertainty so there is much market participation just little direction. We will watch to see if the oscillator will be able to move clearly away from the zero line and if so we will be able to say that the market has made up its mind over future direction. 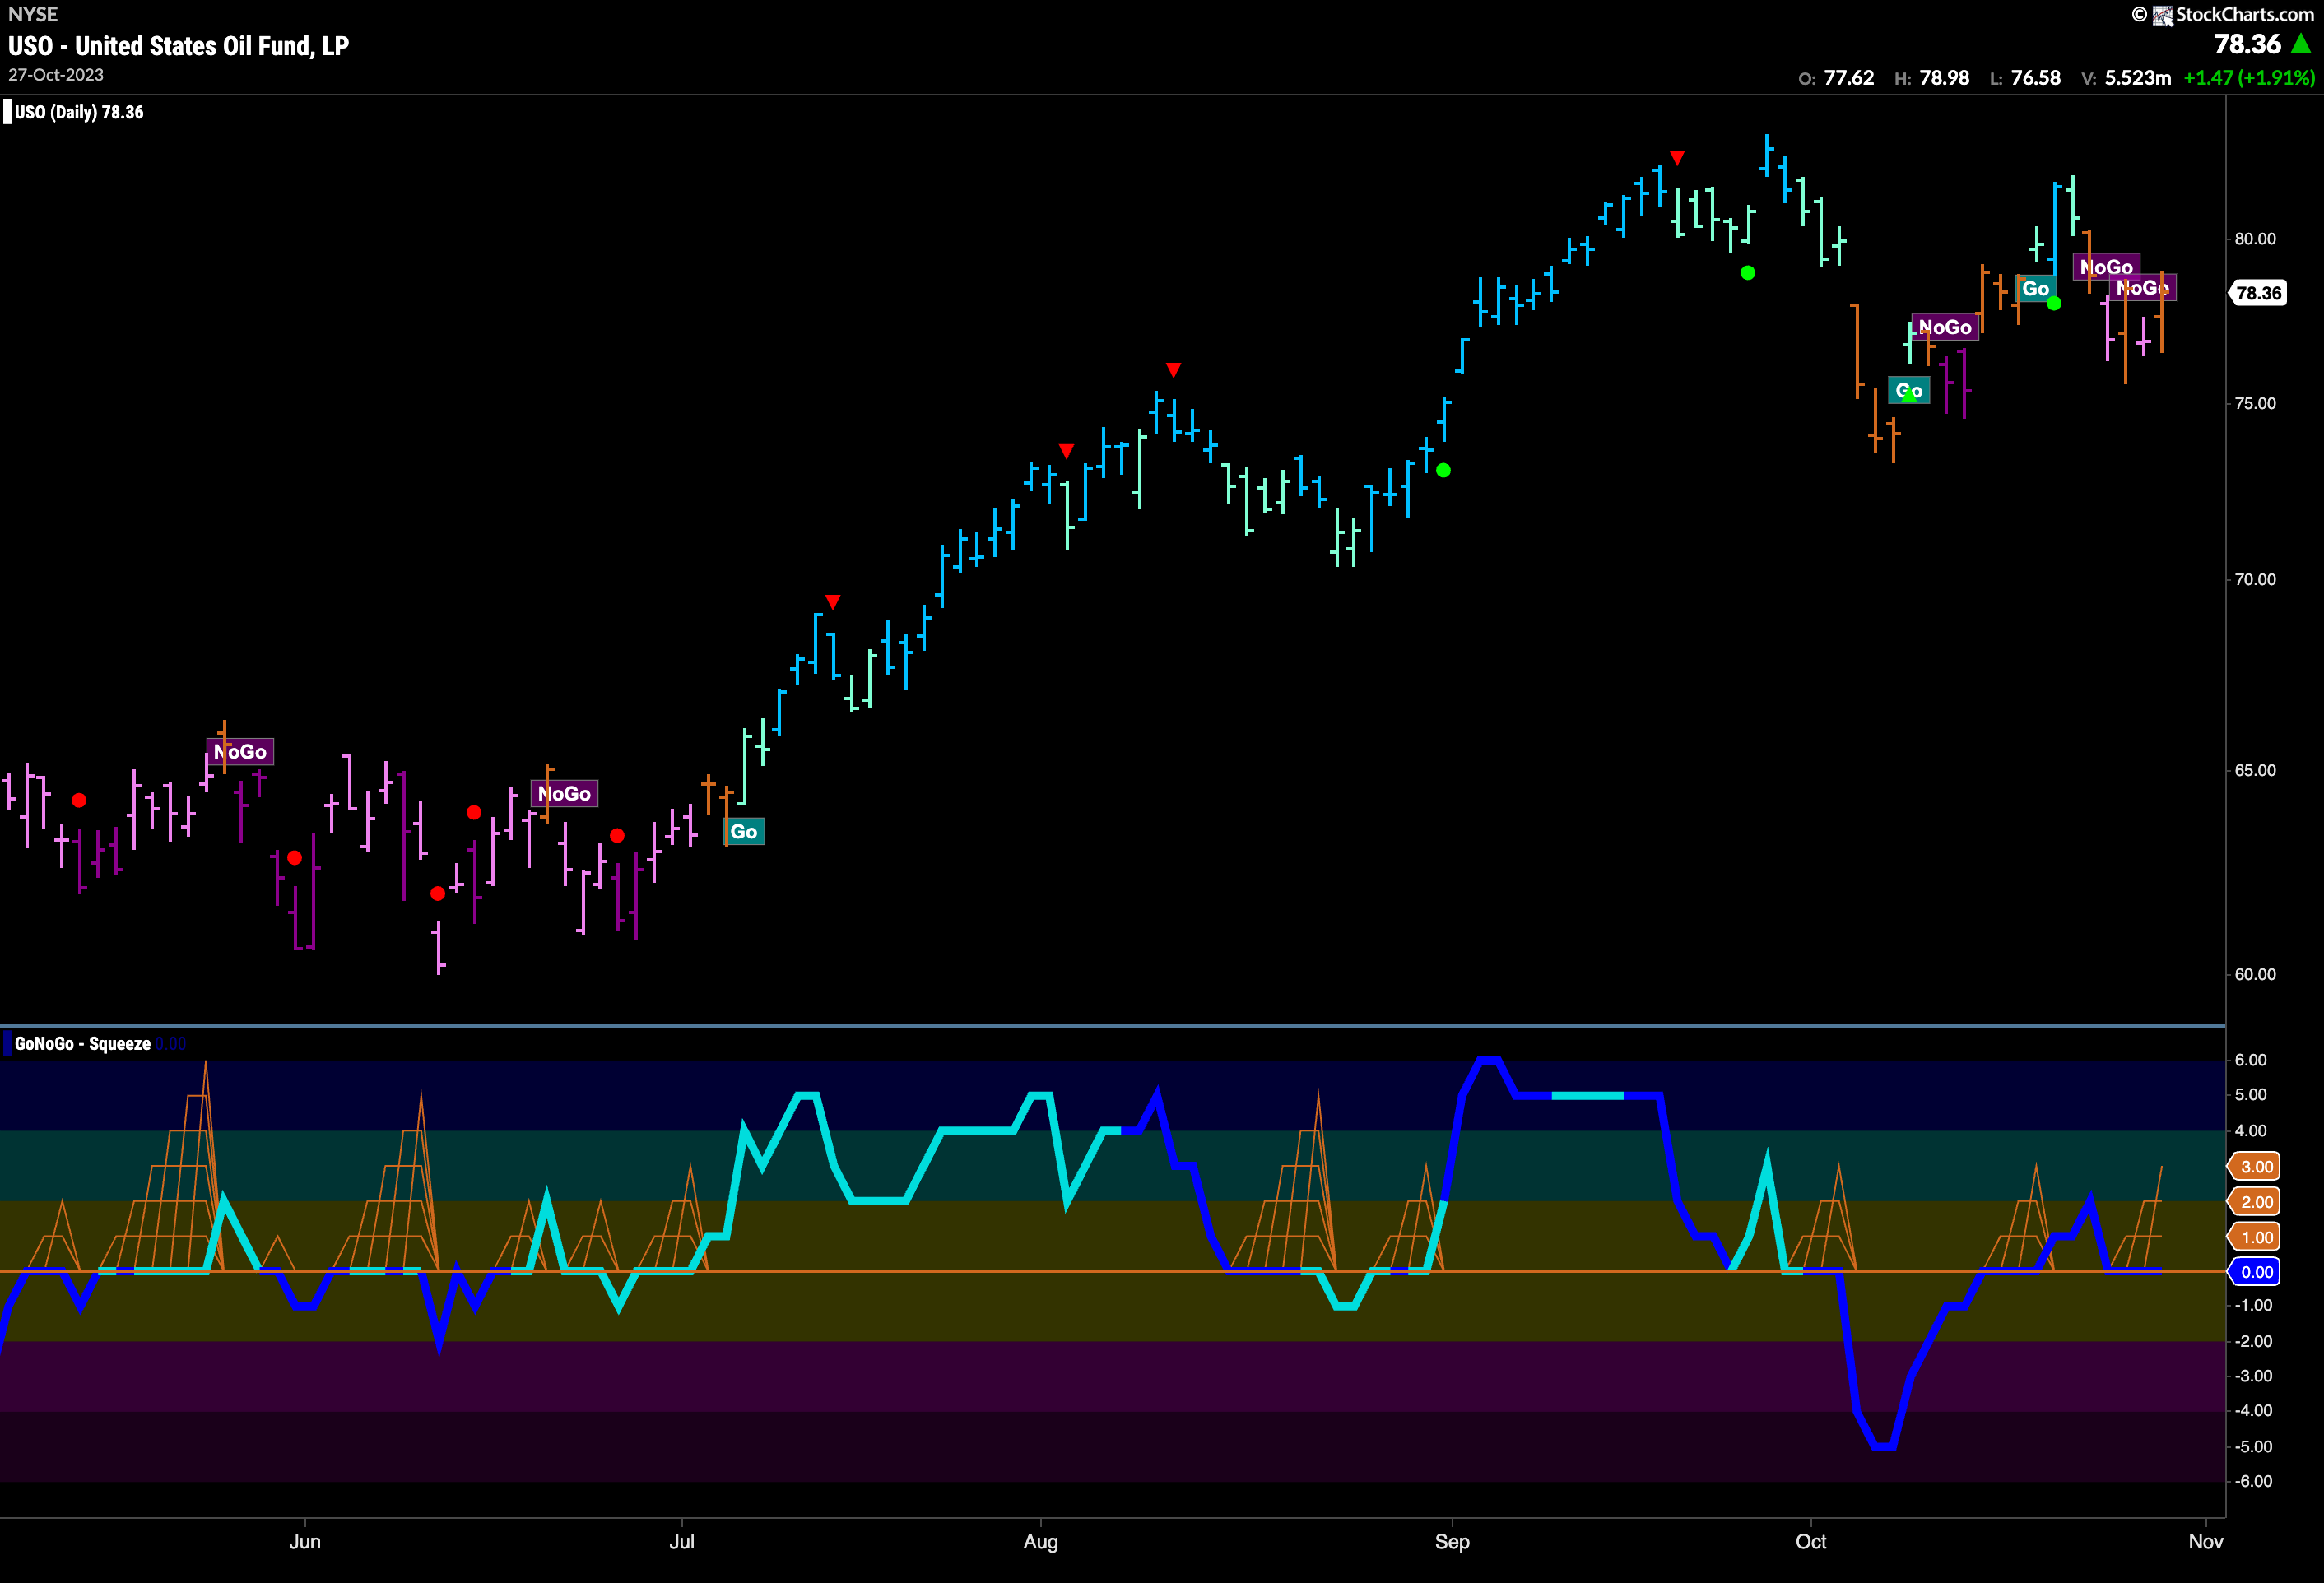
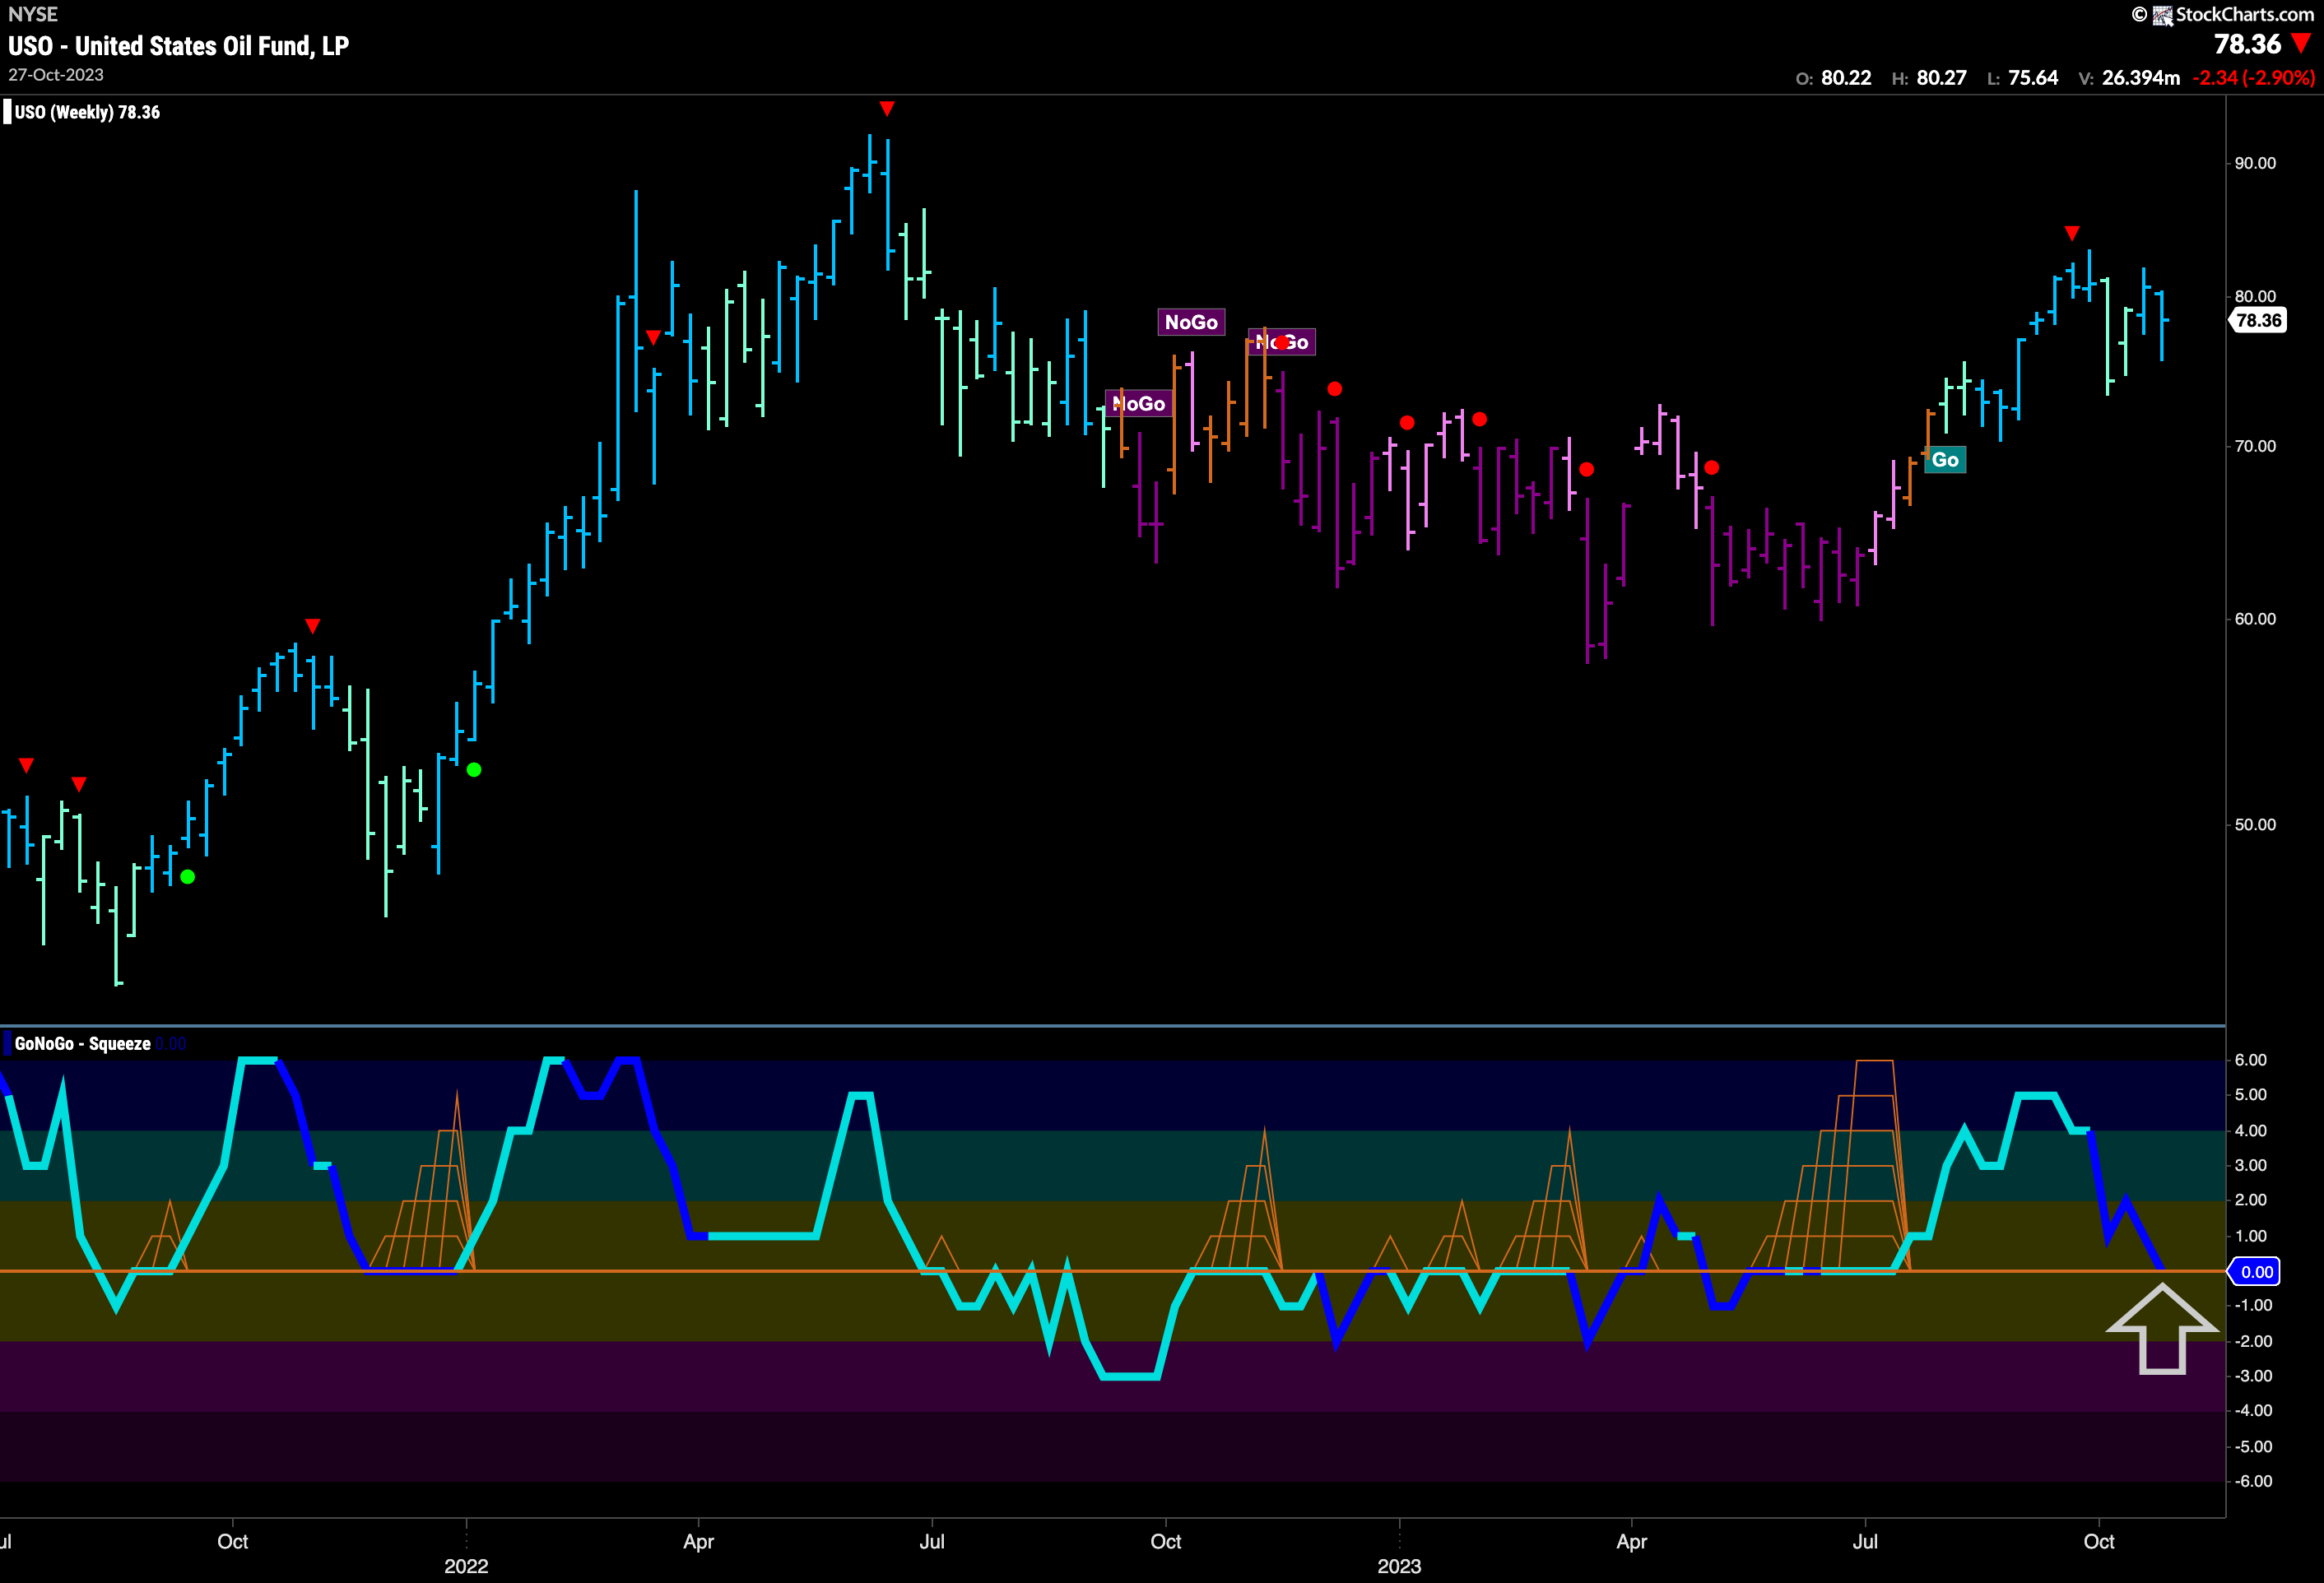
The weekly chart shows that we are at an important inflection point on the larger time frame as well. We see that the “Go” trend remains in place but that GoNoGo Oscillator has fallen to test the zero line from above. We will look to see if momentum finds support at this level and if it does we can expect the “Go” trend to continue. All else being equal, as long as the “Go” trend is in place and GoNoGo Oscillator finds support at the zero line we would think price may resolve to the upside. We would see this on the daily chart first.
Gold Makes a Break Higher
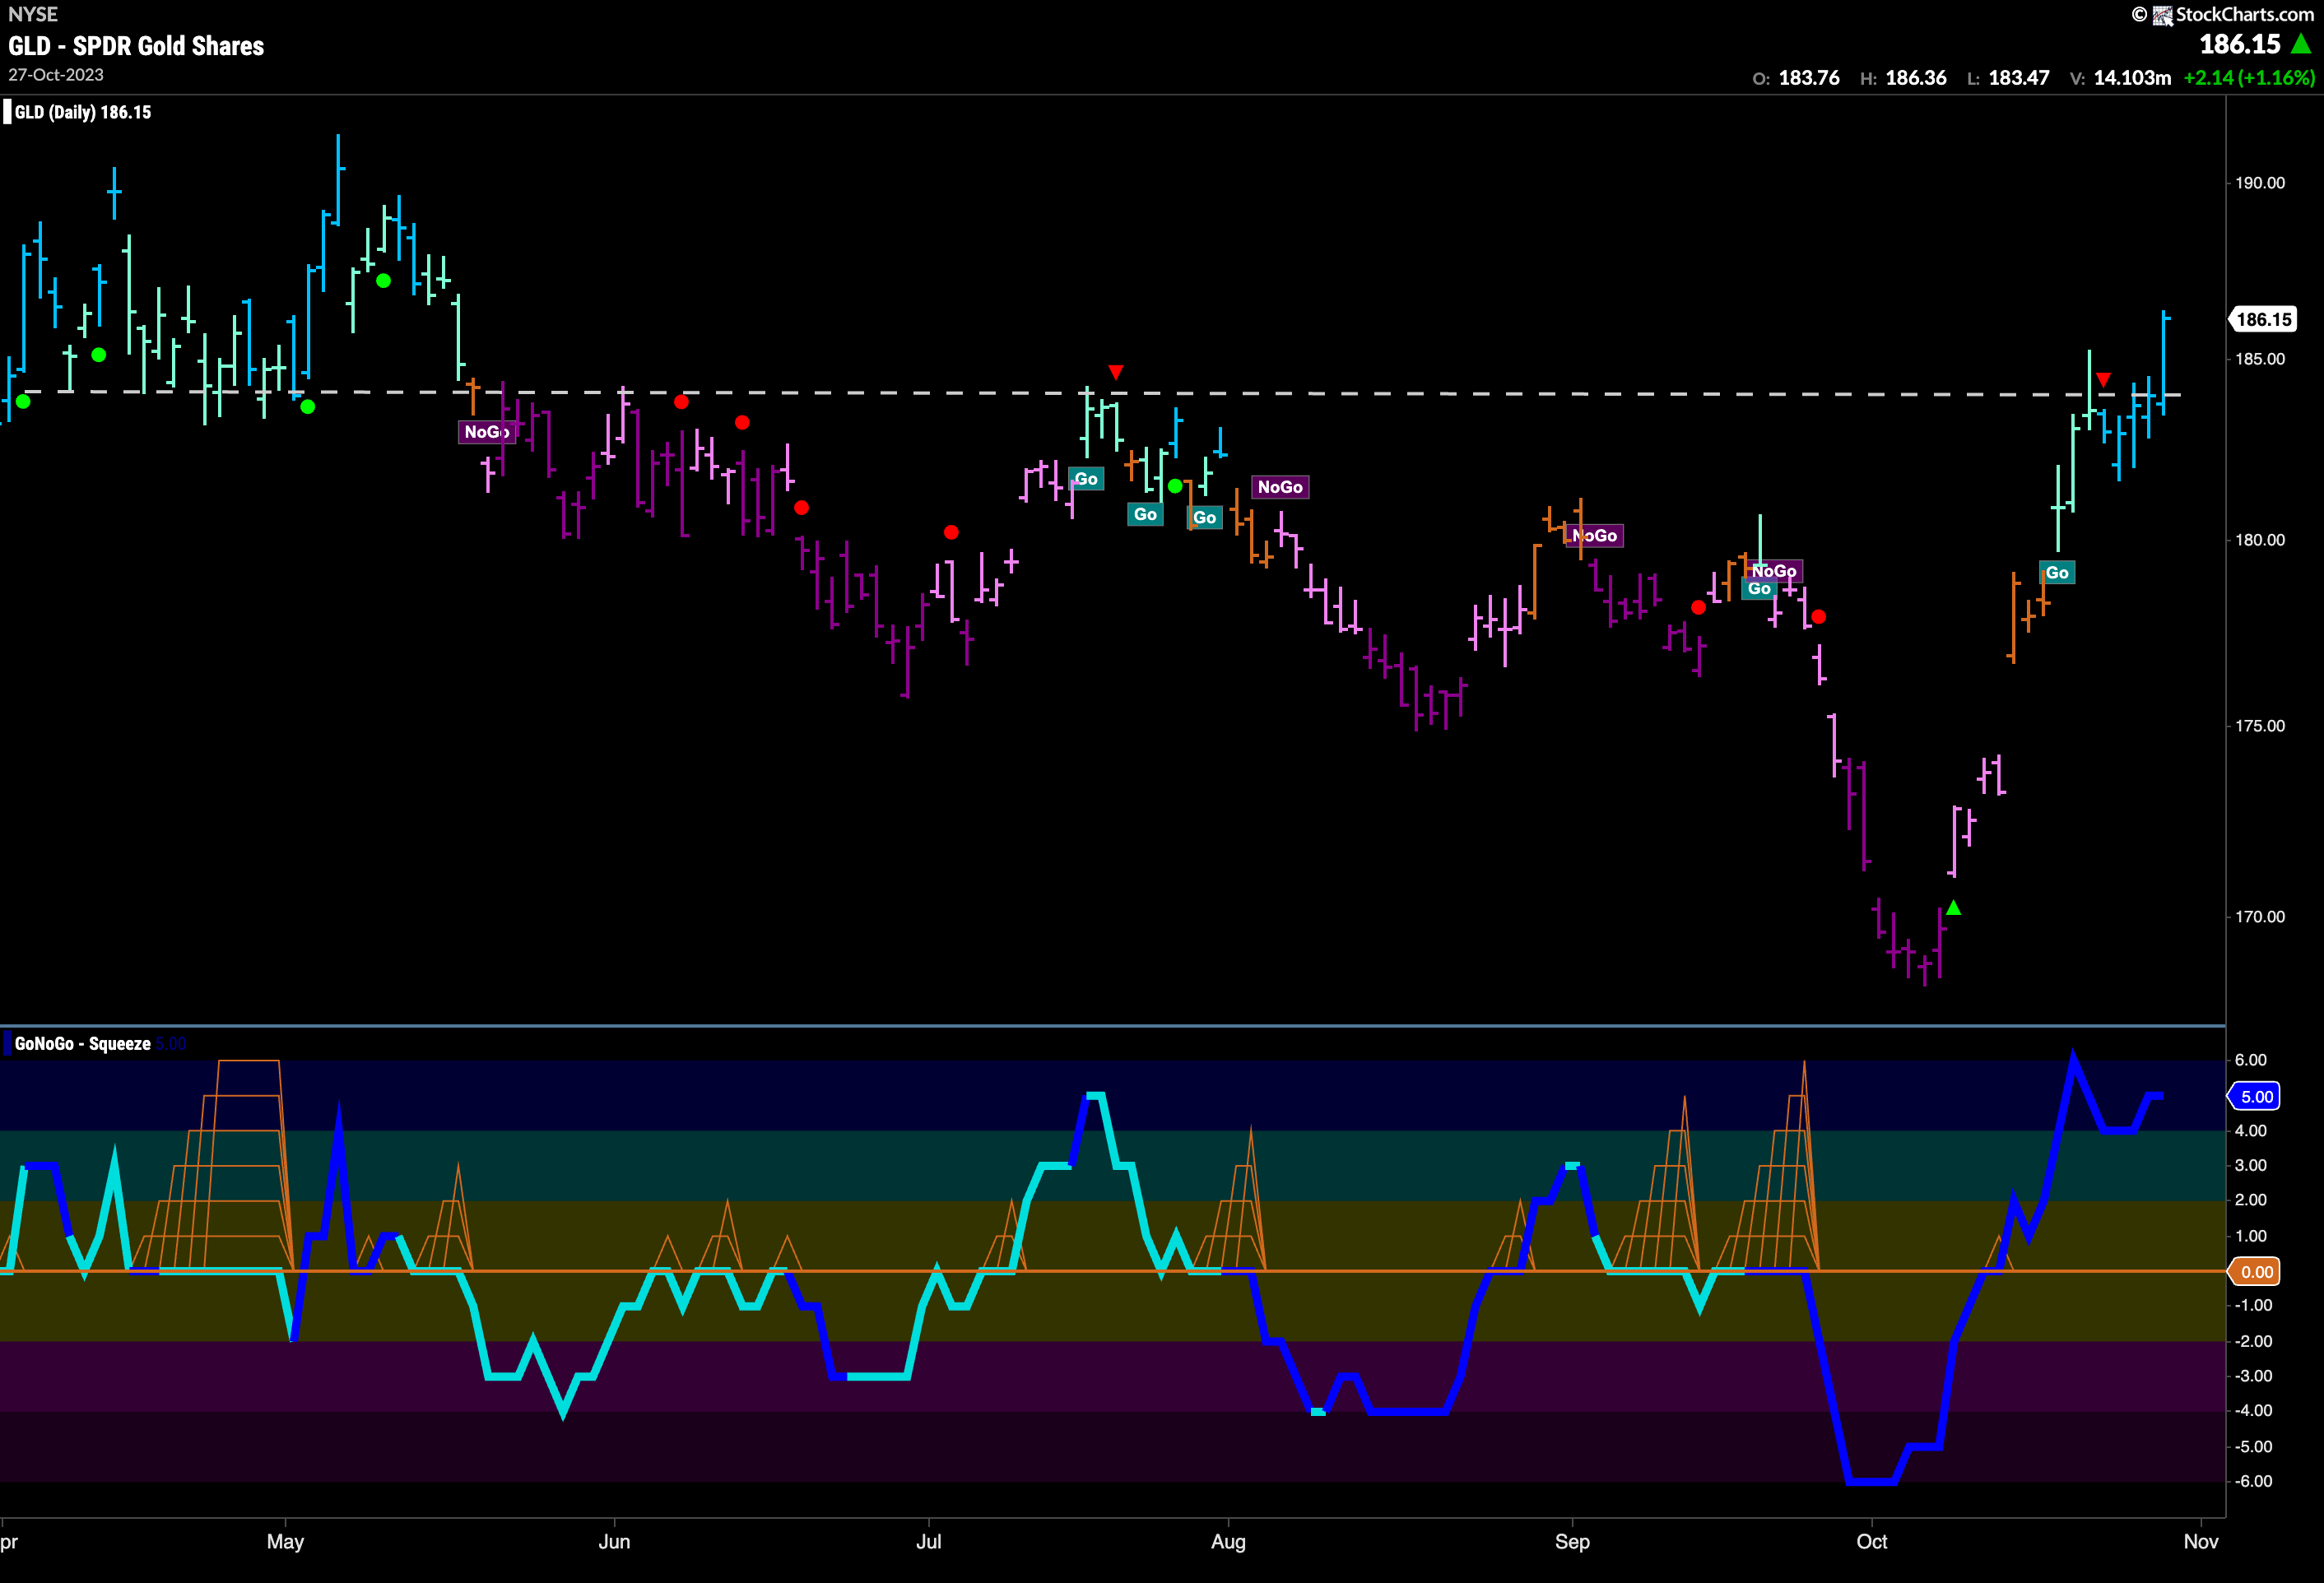
With heavy volume and GoNoGo Oscillator bursting through the zero line we saw GoNoGo Trend flag a “Go” over a week ago. This past week saw the trend strengthen as the indicator painted bright blue “Go” bars. On the final bar of the week price climbed above horizontal resistance and so we have a new higher high in price. We will watch to see if this momentum can be sustained as investors are seemingly parking money in gold as a flight to safety with the equity markets in turmoil.
Sector RelMap
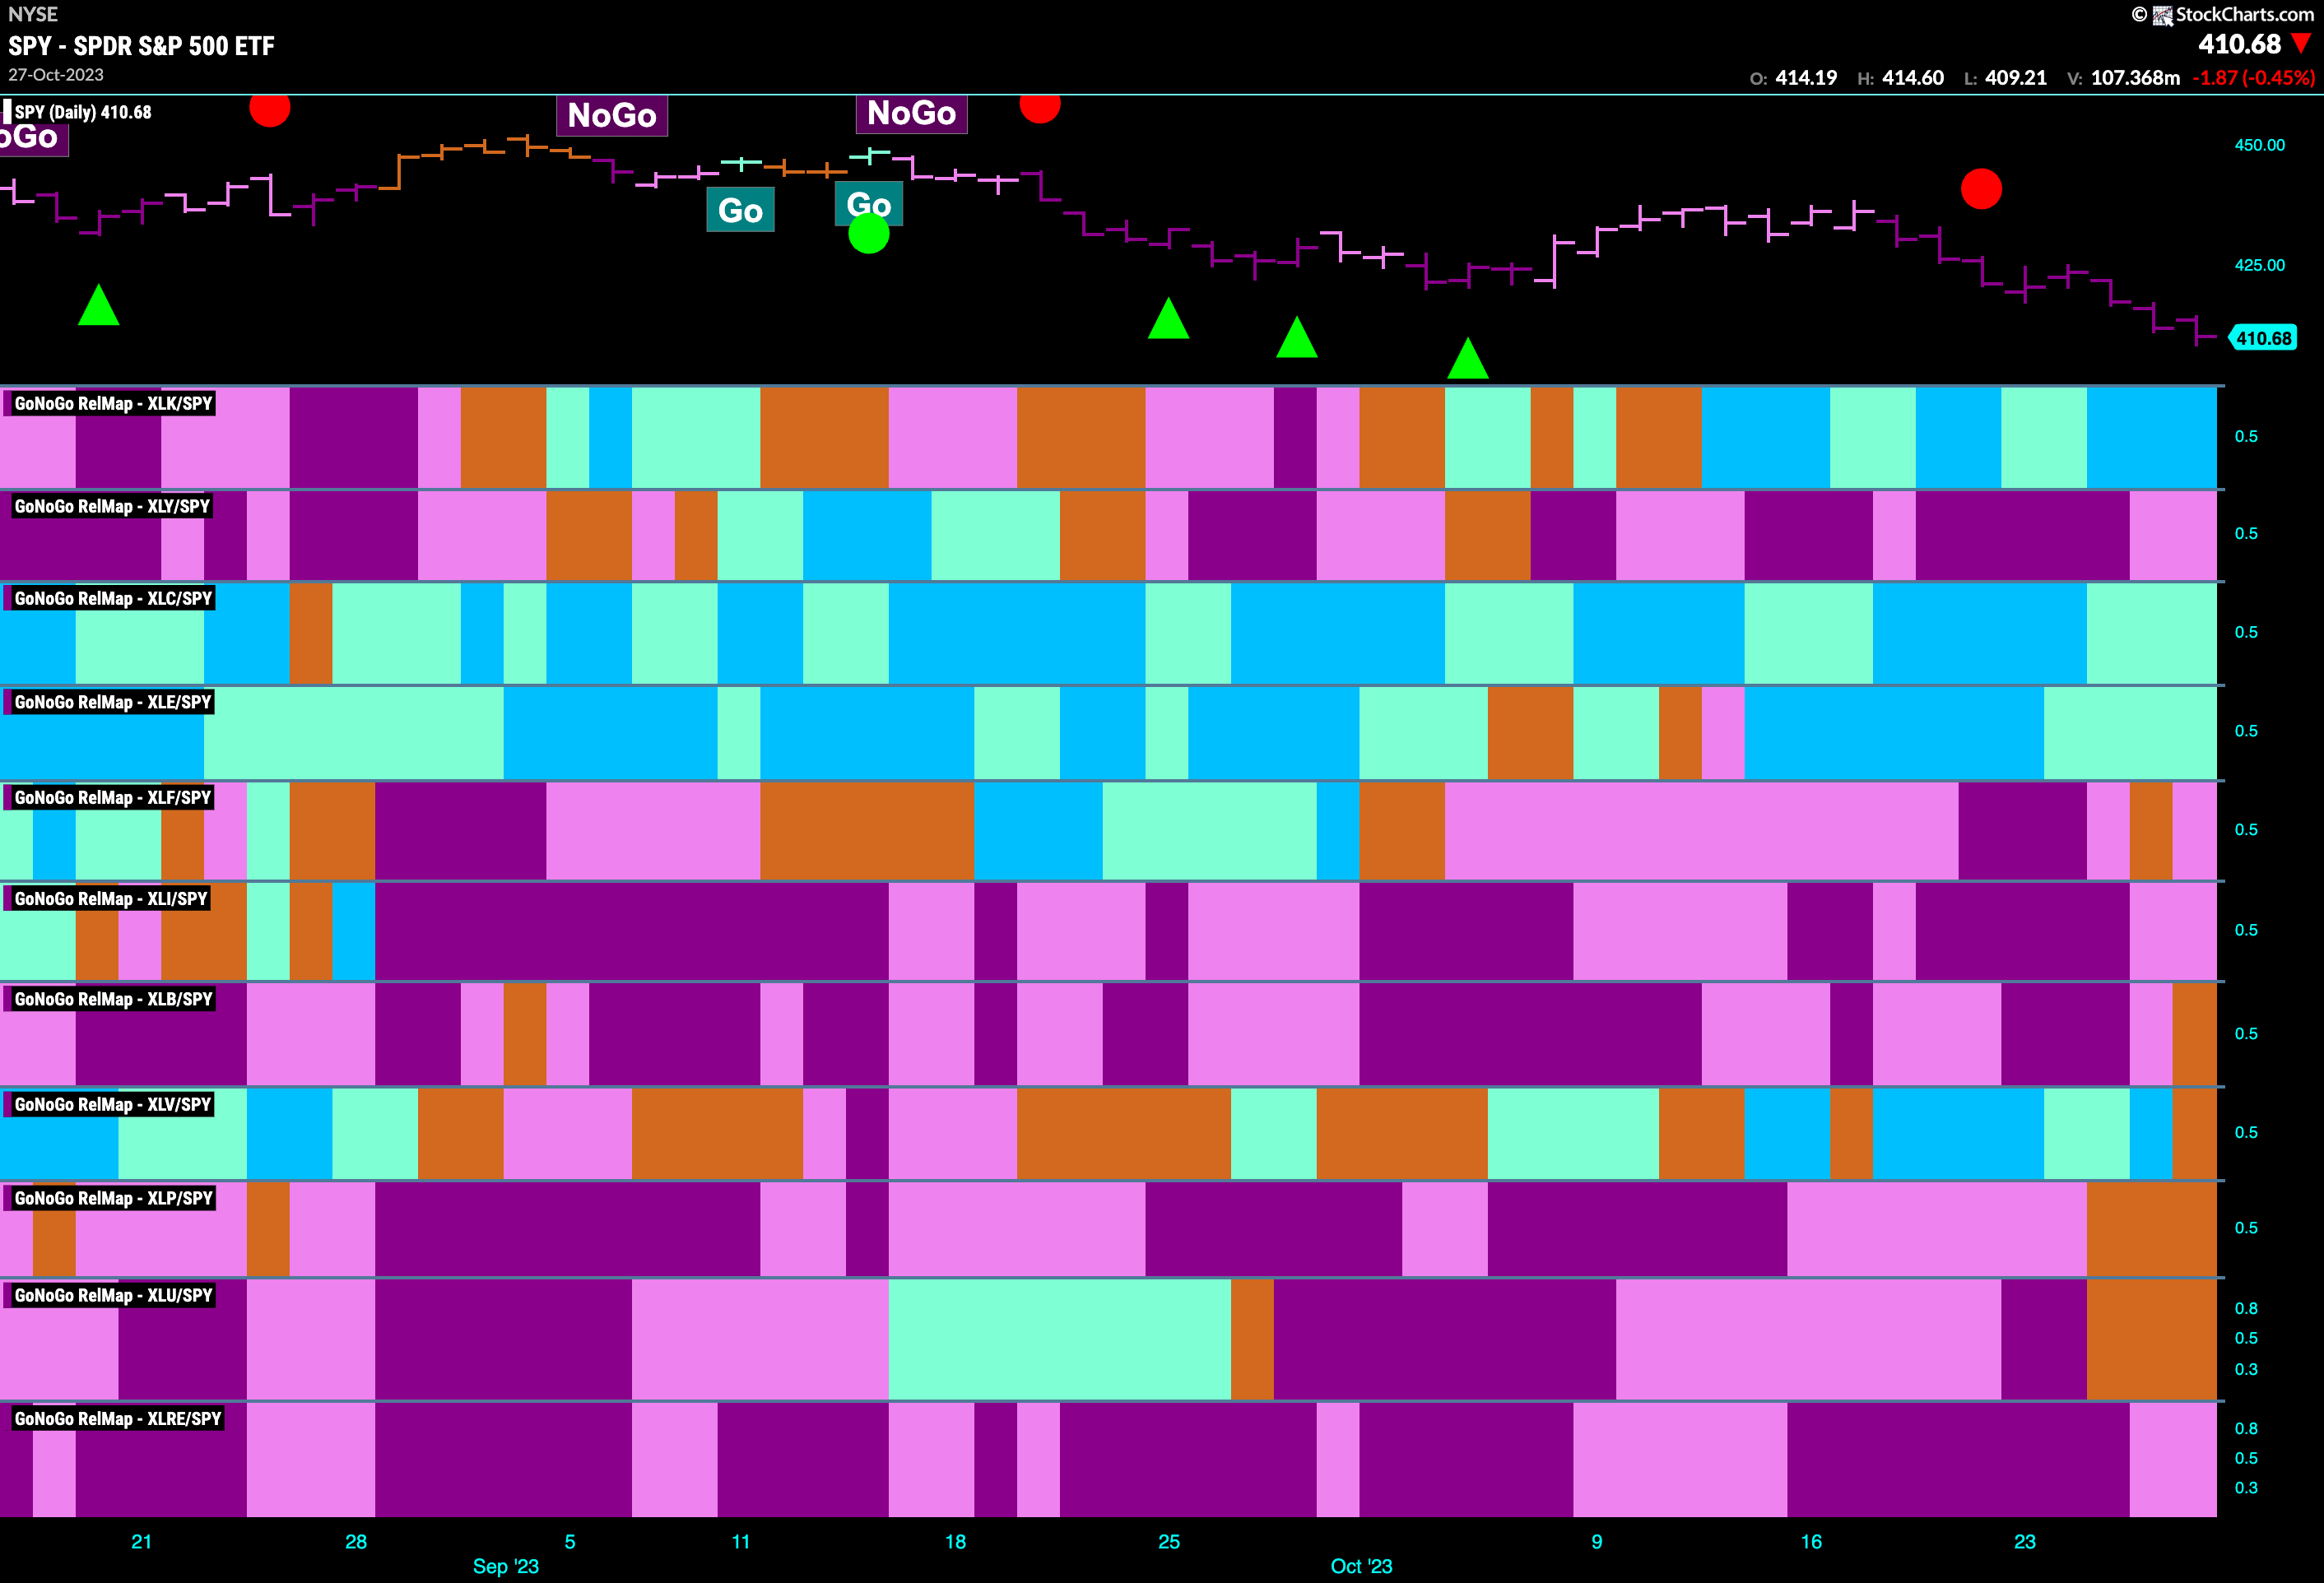
Below is the GoNoGo Sector RelMap. This GoNoGo RelMap applies the GoNoGo Trend to the relative strength ratios of the sectors to the base index. Looking at this map, we can quickly see where the relative outperformance is coming from as well as which sectors are lagging on a relative basis. 3 sectors are outperforming the base index this week. $XLK, $XLC, and $XLE, are painting “Go” bars.
Communications Sub-Group RelMap
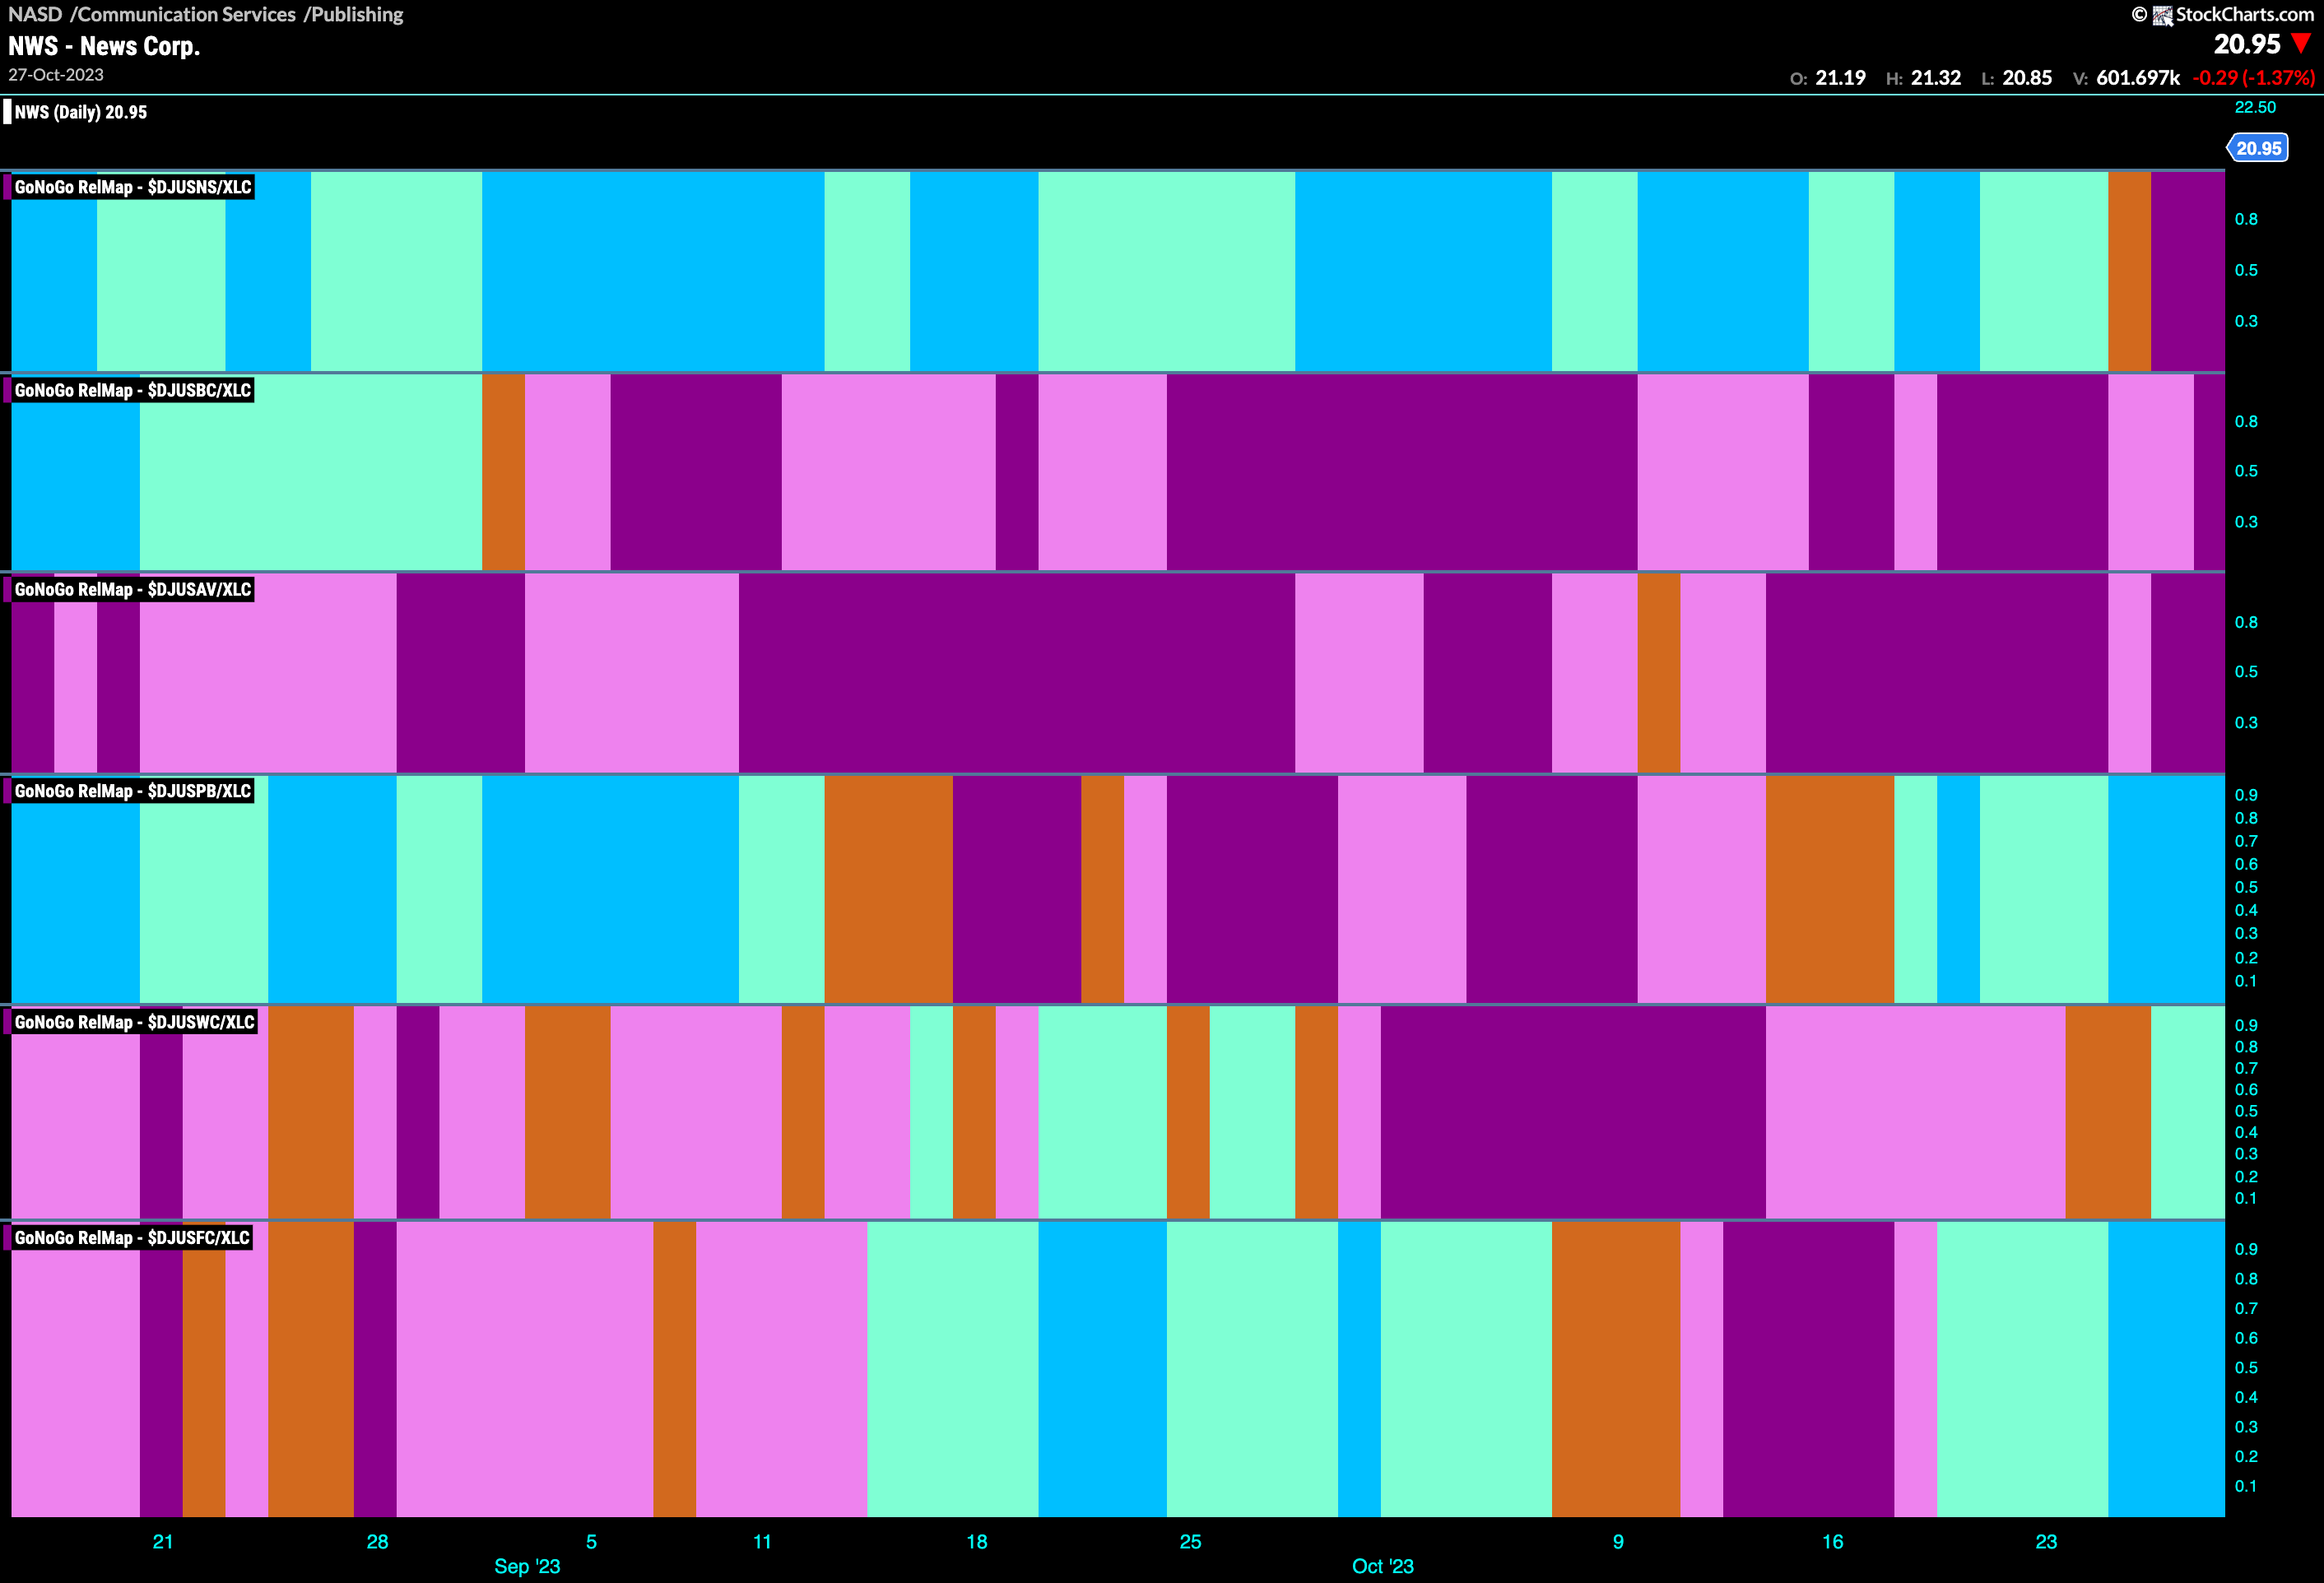
The GoNoGo Sector RelMap above shows the continued relative outperformance of the communications sector. The sub group map below shows that the publishing index has emerged as a strong leader over the last couple of weeks. GoNoGo Trend is painting strong blue “Go” bars in the 4th panel in the map below.
$MORN – ing Over?
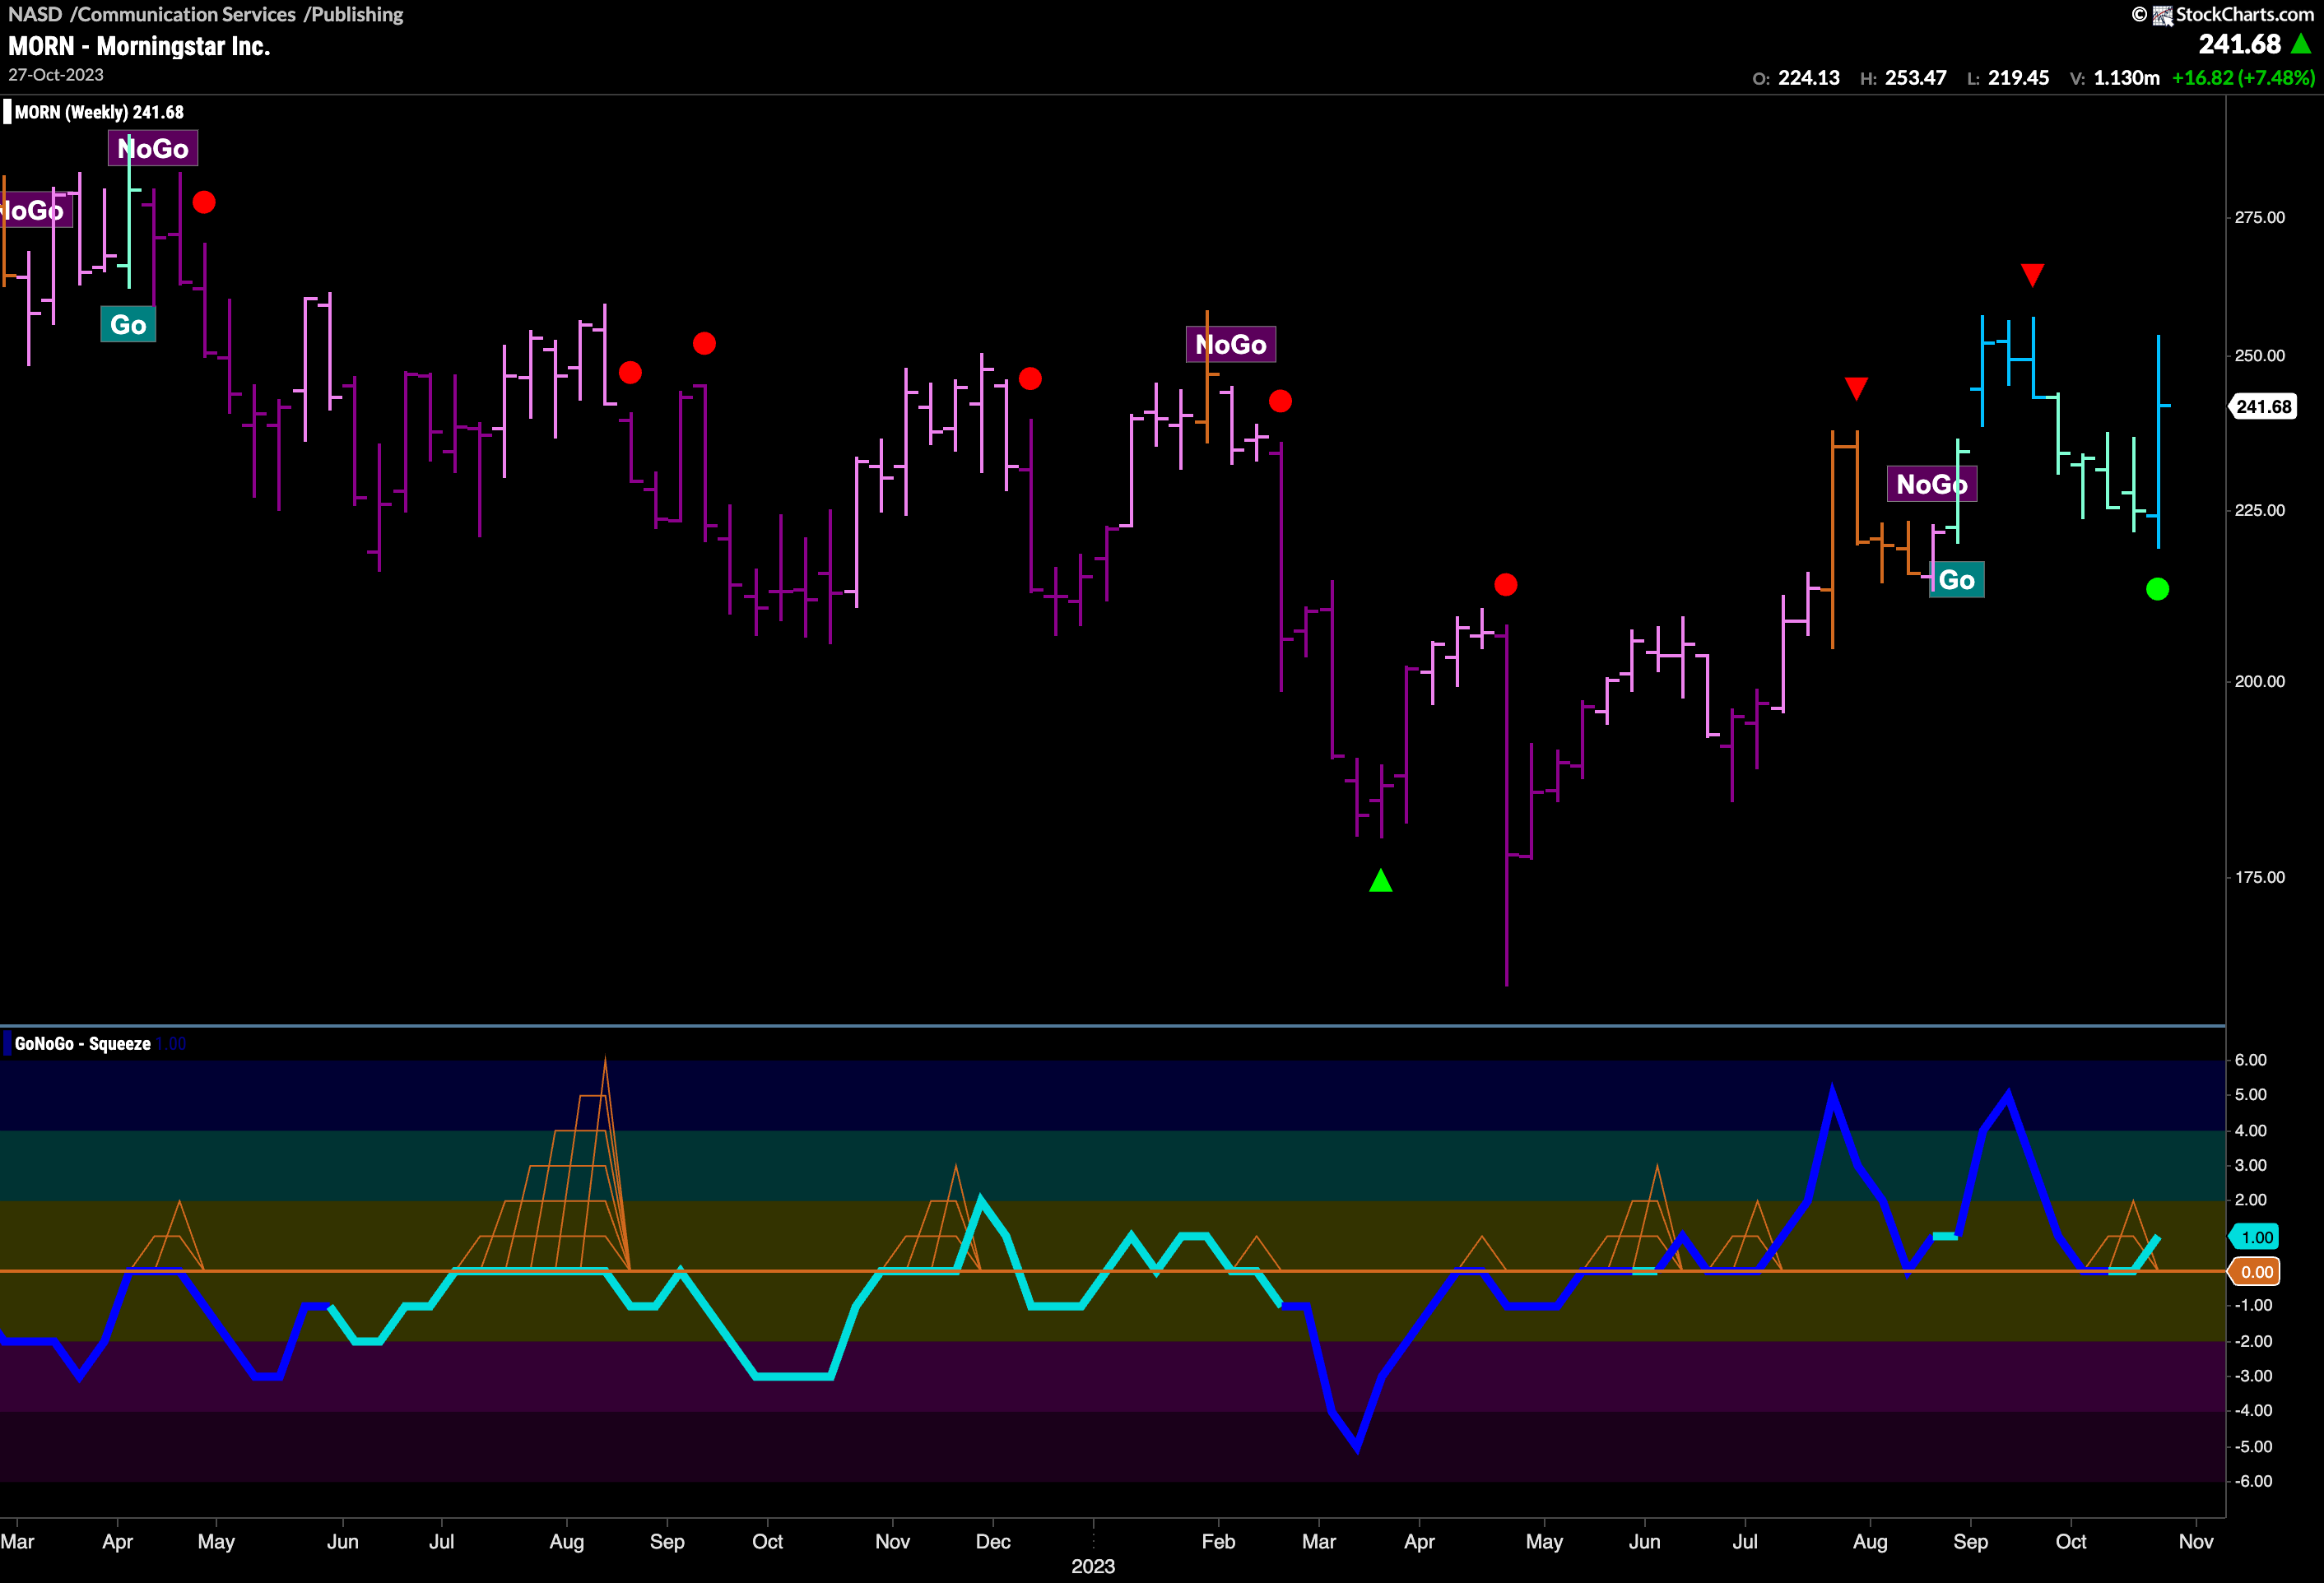
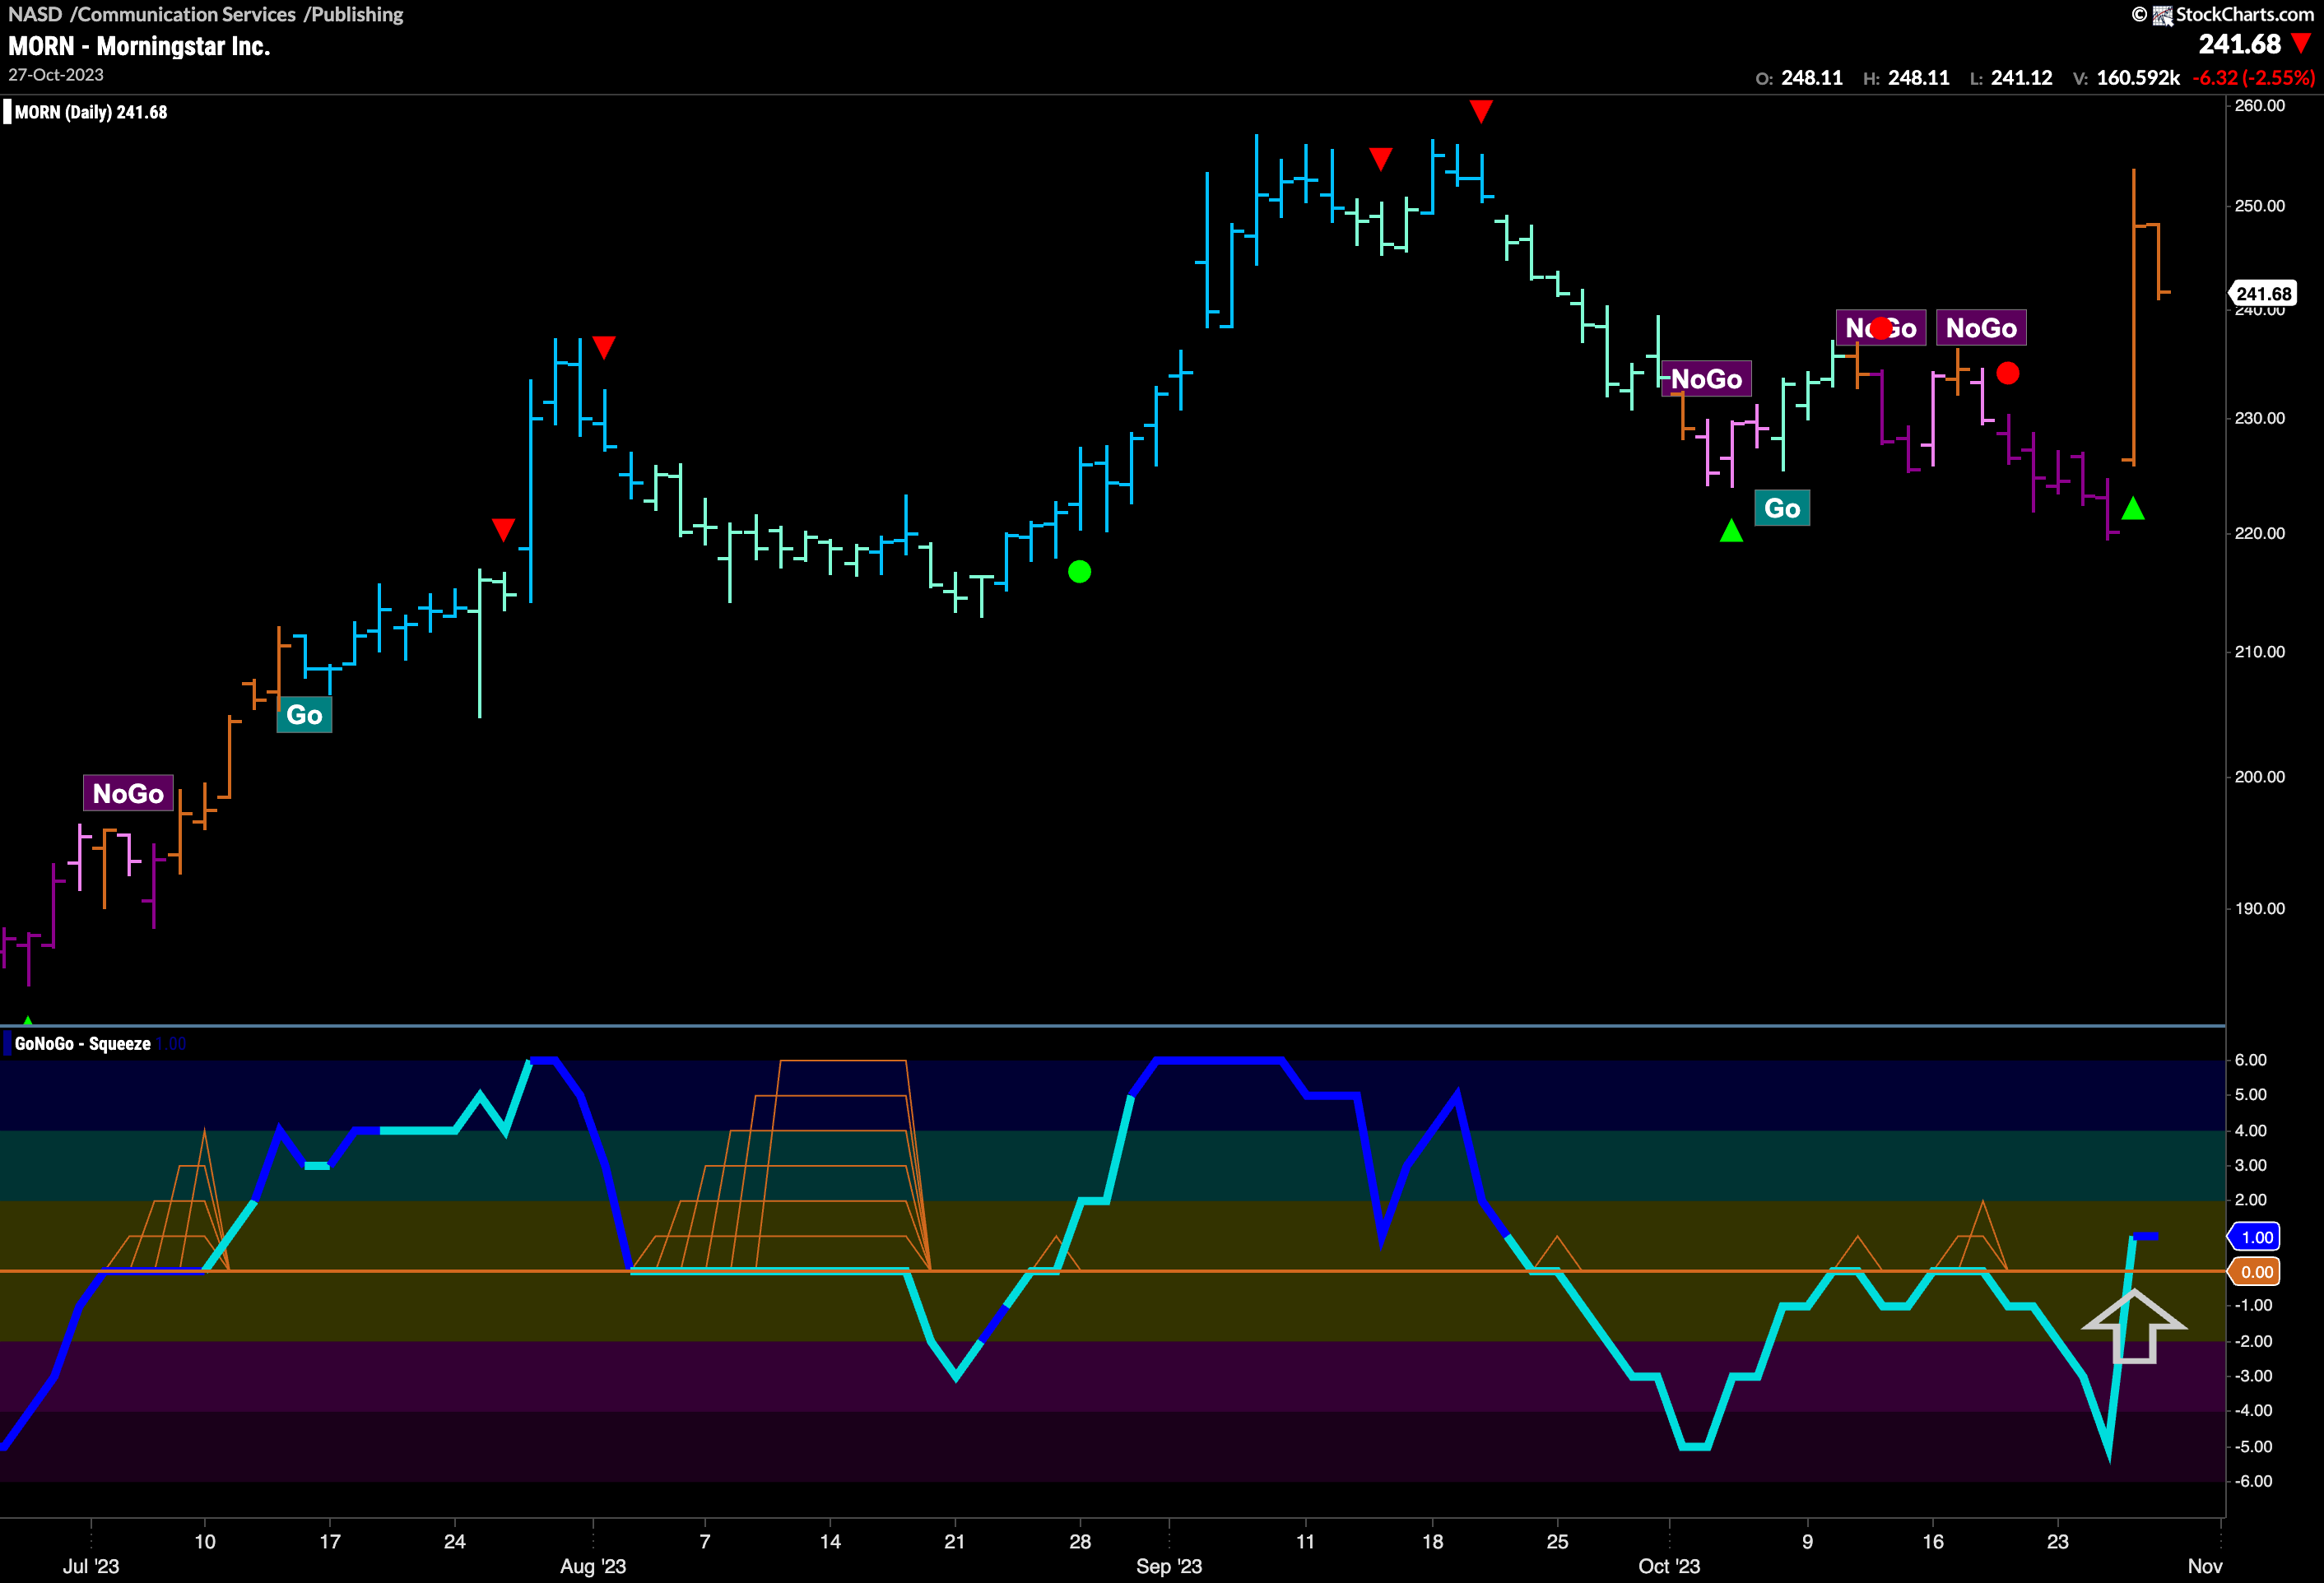
Is it time to get positive about $MORN’s chances of higher prices? The GoNoG Sub Group RelMap of the communications sector above showed that it was publishing that had emerged as one of the leaders. Morningstar made a massive move on Thursday of last week and the strong price bar allowed GoNoGo Trend to paint an amber “Go Fish” bar after a week of “NoGo” colors. At the same time, GoNoGo Oscillator broke back into positive territory confirming the change in trend. We will watch this week to see if GoNoGo Trend can move from “Go Fish” to “Go” and mount an attack on the prior high from September.
The weekly chart below shows that it may be the start of something bigger. A new “Go” trend has been identified over the last two months and this past week saw a Go Trend Continuation Icon as GoNoGo Oscillator once again found support at the zero line. This has seen price set a new higher low and we will watch to see if price can set a new higher high as we move forward. It must be said that there is some strong resistance on the chart from the highs of the last “NoGo” trend but if momentum can stay at or above zero we will look for price to try to break to new highs.
