
The “Go” trend in equities persists in the major indices this week. All remain very close to all time highs but didn’t hit new noes. The news is generally very good with over 20% of U.S. companies having already reported earnings and most having beaten EPS estimates. Against this healthy backdrop investors must weigh the effect of President Biden’s proposed tax cuts and the threat of inflation. Perhaps this stopped the markets from setting another all-time high? Commodities were mostly strong this week as the dollar continued in its “NoGo” trend. As most commodities are priced in dollars that may spur more gains in those assets. And there was a big sell off in cryptocurrencies, or was there? Certainly Bitcoin took a tumble.
"A volatility squeeze reminds me of a tube of toothpaste: eventually the cap will pop off!" — Unknown
Cross Asset Comparison | GoNoGo HeatMap
In a top-down approach to market analysis, investors need to compare across asset classes. Below is a GoNoGo Heat Map® which highlights the trend conditions of equities, fixed income, commodities, currencies, and digital assets. The dollar index sees its “NoGo” trend persist and strengthen. A falling dollar is thought to be good for stock prices and commodities. This is a risk-on environment. Bullish. Bitcoin, notably, fell out of a “Go” trend and into a “NoGo” trend this week on excessive selling.

Equity Sectors Relative Strength | GoNoGo RelMap
The S&P 500 was able to hold onto most of its recent gains this week. As investors weigh the good with the bad, a look into the trend of relative strength can help us “fish where the fishes are”. Remember, the GoNoGo RelMap applies the GoNoGo Trend concept of blending foundational technical concepts to identify trend to relative ratios.
See the GoNoGo RelMap® below of the S&P sectors relative performance against the broader index:

- Materials ($XLB), Consumer Discretionary ($XLY), Technology ($XLK), Industrials ($XLI) and Utilities ($XLU) are in “Go” trends
- After some amber “Go Fish” bars, its good to see Industrials back in a “Go” trend
- The “Go” trends in Technology and Utilities continue to be able to co-exist
Time to Enter the Emerging Markets?
Below is the daily chart of the ratio of $EEM IShares Emerging Markets ETF to the $SPY SPDR S&P 500 ETF. With an ever present threat of inflation, let’s assess the technical environment using the GoNoGo Trend and Oscillator applied to the relative strength ratio of emerging markets to the S&P 500.
- After emerging markets outperformed for much of 2020 and into early 2021, we see the “NoGo” take hold in late February of this year. Since then, U.S. domestic markets have fared better
- During that time, as expected, the GoNoGo Oscillator stayed below zero, indicating that Momentum never reversed into overbought territory
- Currently, the GoNoGo Oscillator is testing the zero line from below, where it should be rejected if the NoGo trend is strong enough to continue
- A break into positive territory would indicate weakness in the NoGo trend

If we focus then on the chart of the $EEM, what do we see? Below is the GoNoGo daily chart of the Emerging Markets ETF.
- GoNoGo Trend has identified a new “Go” on the most recent bar
- This recognition of trend change comes right at levels that have been resistance and so we will need to see price consolidate above these levels
- As we like to see during a reversal pattern, the GoNoGo Oscillator was able to cross into positive territory during the right half of the pattern and has since found support at the zero line

Capturing Copper Gains with $TRQ
With the Dollar continuing its slide, many think that money managers should increase their exposure to commodities. Copper has been outperforming since the summer of last year as hopes of a resurgent economy started to take shape. Below is the GoNoGo chart on weekly prices of $CPER the copper index fund.
- The “Go” trend is strong and has been in place since last July
- During this trend, the GoNoGo Oscillator has been in positive territory
- A bounce off the zero line in November provided a good entry into the long term trend
- A move above resistance from prior high would be strong

We highlighted $TRQ, Turquoise Hill Resources in the March 8th issue of Flight Path, as a materials company that was well positioned to take advantage of the copper trade. Let’s look at them again.
- After setting a series of higher highs and higher lows, the GoNoGo Trend is painting aqua “Go” bars
- Red countertrend correction arrows suggested this recent pullback may occur
- The GoNoGo Oscillator is testing support at the zero line again, as it has throughout this trend
- A rally from here would trigger a fresh low risk Go Trend Continuation entry

Crypto Cash Out or Re-allocate?
2 weeks ago we noted that relative to Bitcoin, Ethereum was outperforming. With Bitcoin falling hard over the last two weeks let’s see how the relative performance between the two leading cryptocurrencies played out.
- First, the GoNoGo Oscillator broke above zero, suggesting that the NoGo correction might be short-lived
- The GoNoGo Trend followed by identifying a “Go” trend and price broke above resistance
- We saw the concept of polarity here as price then retested the level that was resistance and it proved to be support
- The trend strengthened since, and has painted continuous blue “Go” bars

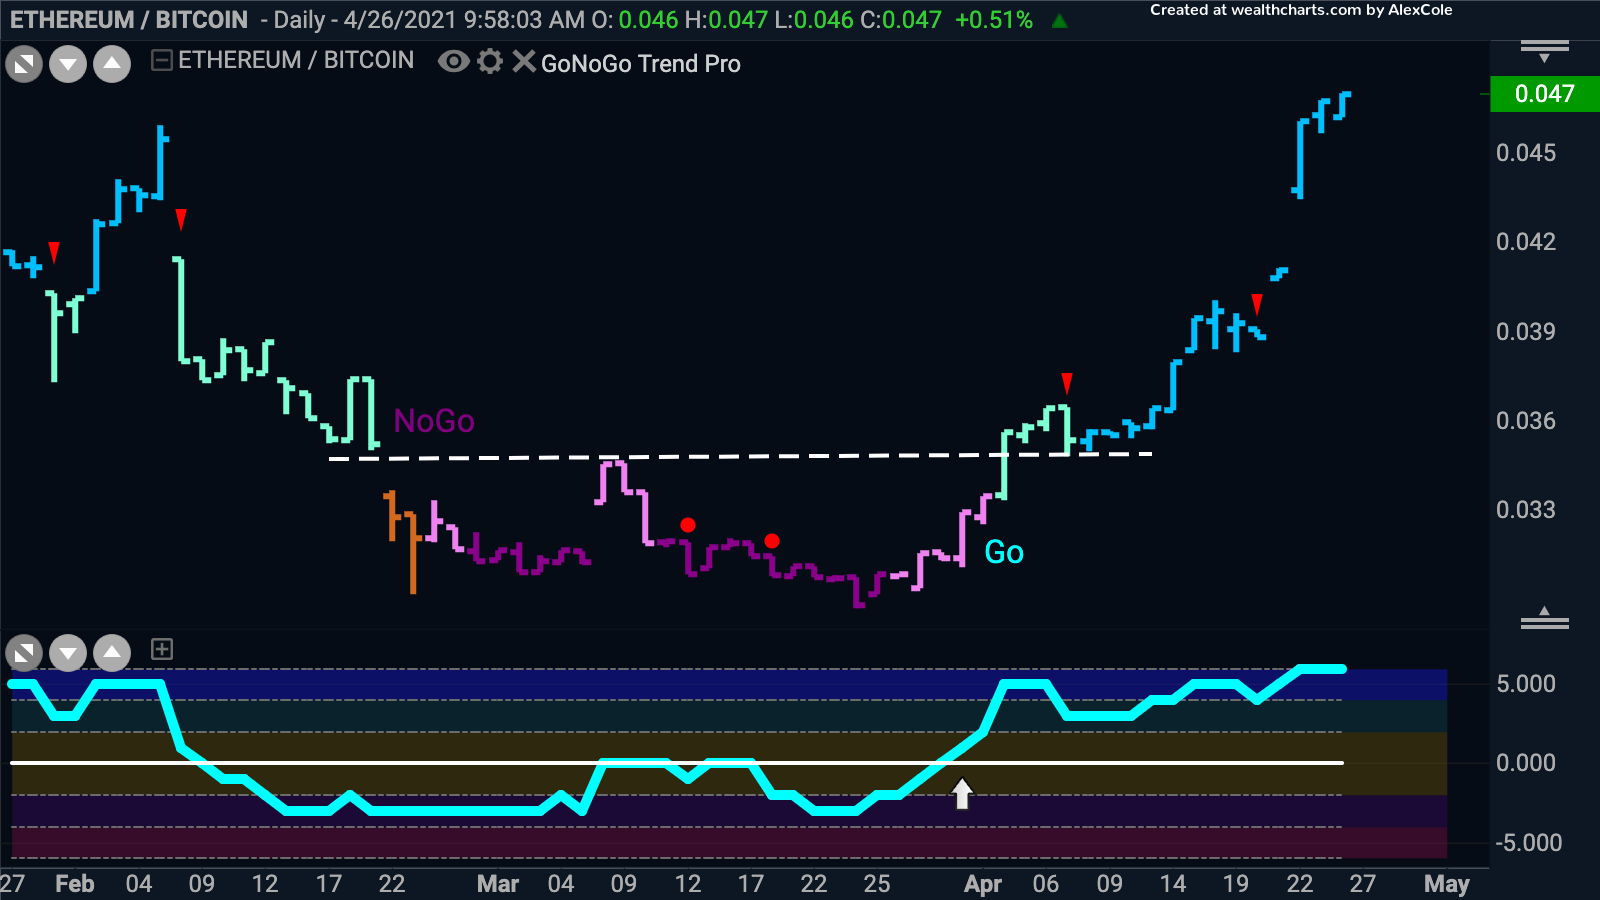
The chart below shows Etherum on its own with the GoNoGo Trend and GoNoGo Oscillator applied.
- The “Go” trend is still in place with price painting strong blue bars
- After falling close to the zero line the GoNoGo Oscillator has rallied back into positive territory but is not yet overbought
- Price is now approaching the all-time highs from just over a week ago

This is a strikingly different chart from that of Bitcoin itself, which has seen a greater than 25% fall from its highs and is now a few bars into a “NoGo” trend. Will Ethereum be able to continue its outperformance? Is it likely to correct, following the path of its bigger crypto counterpart or is this a sign that Bitcoin’s correction itself is a buying opportunity?


